Downloaded 228 times


![Text WordTree [Wattenberg & Viégas 2008]
www.jasondavies.com/wordtree
www.jasondavies.com/wordtree](https://image.slidesharecdn.com/kristwhackshackers-141008230755-conversion-gate02/75/Data-Visualization-at-Twitter-49-2048.jpg)
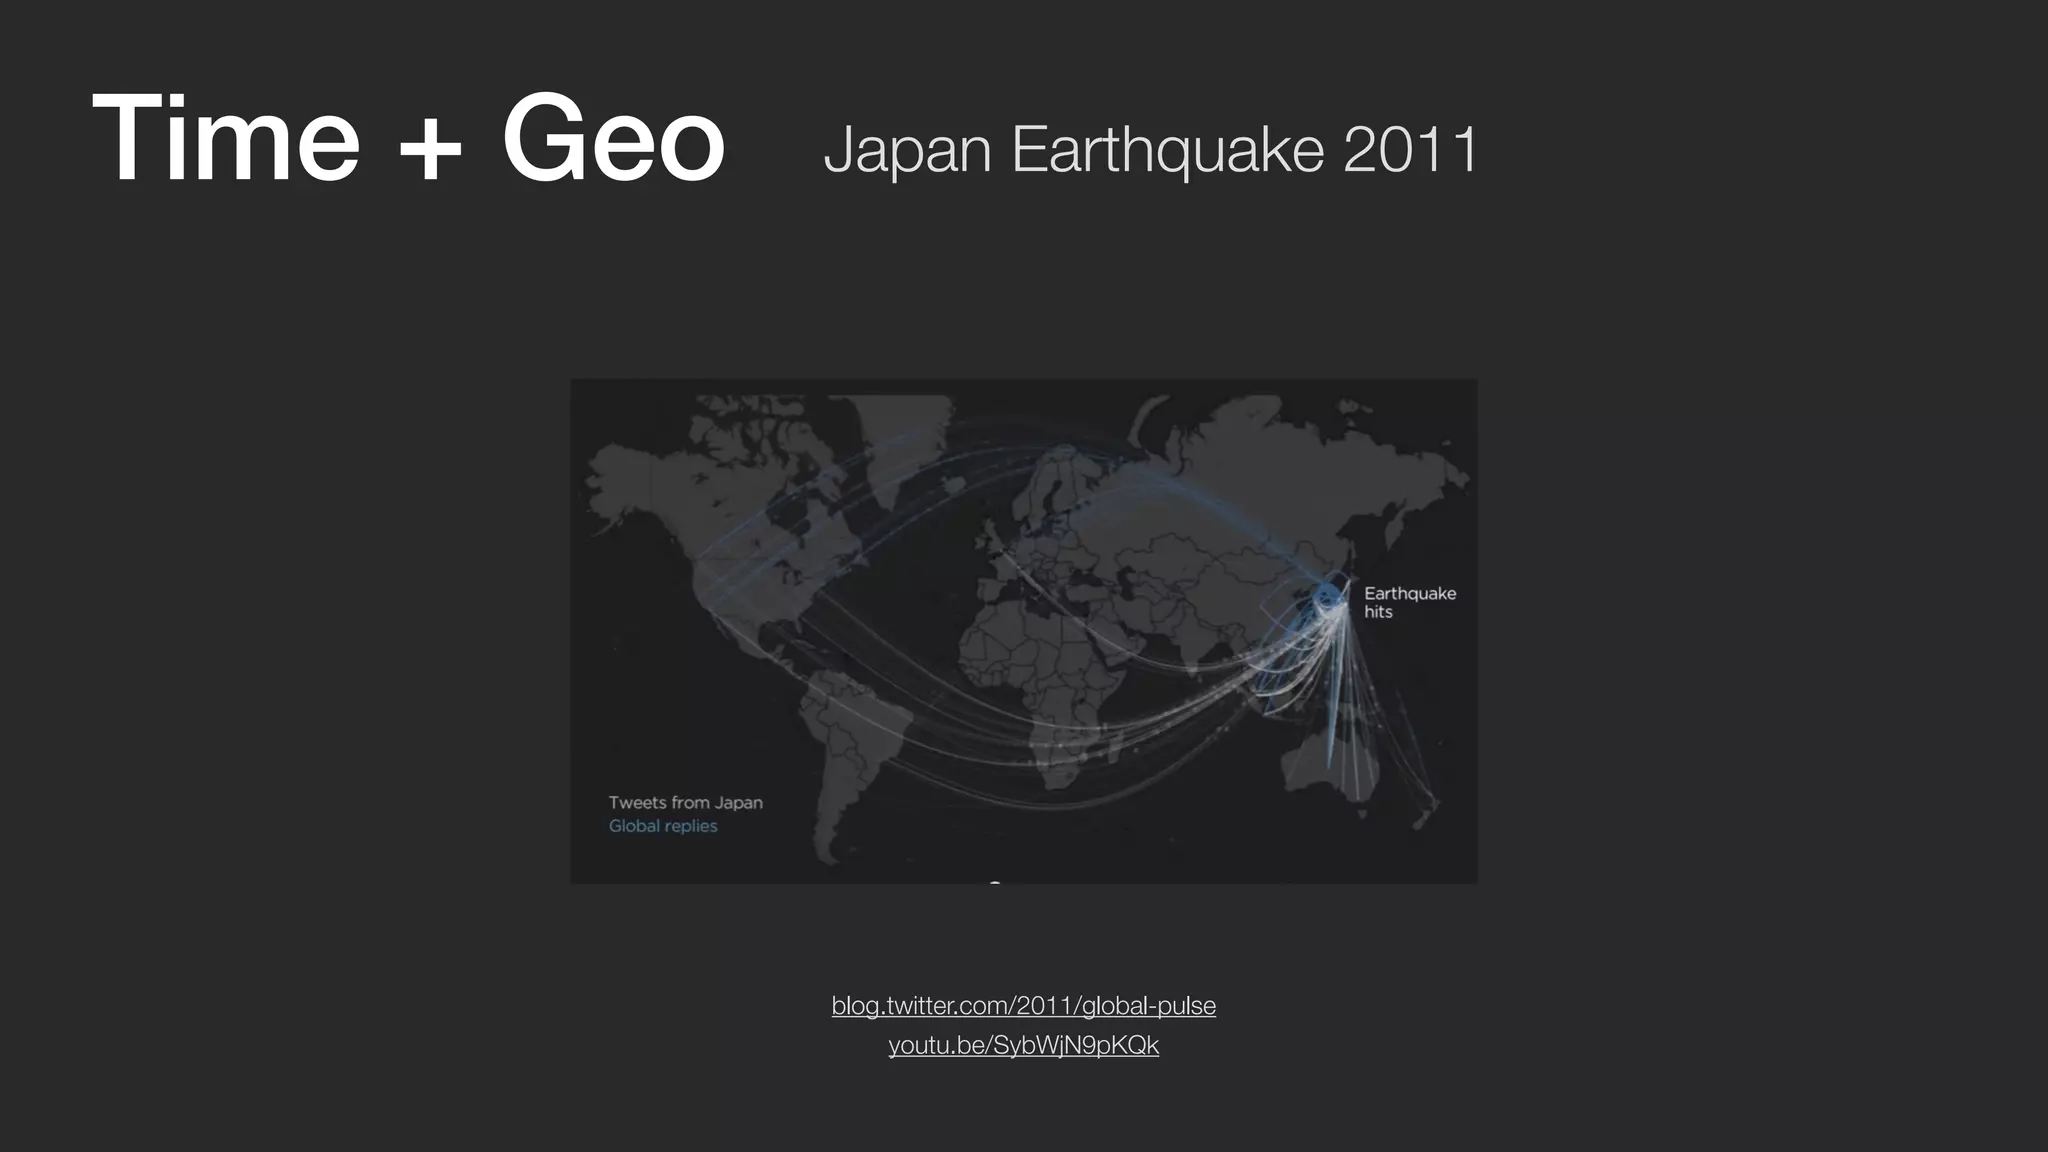


![Time + Geo Tweet pattern [Rios & Lin 2012]
Night
Late night
Daytime
Night
Late night
Daytime](https://image.slidesharecdn.com/kristwhackshackers-141008230755-conversion-gate02/75/Data-Visualization-at-Twitter-54-2048.jpg)
![Time + Geo Tweet pattern [Rios & Lin 2012]
Night
Late night
Daytime
Night
Late night
Daytime](https://image.slidesharecdn.com/kristwhackshackers-141008230755-conversion-gate02/75/Data-Visualization-at-Twitter-55-2048.jpg)
![Time + Geo Tweet pattern [Rios & Lin 2012]
Night
Late night
Daytime
Night
Late night
Daytime](https://image.slidesharecdn.com/kristwhackshackers-141008230755-conversion-gate02/75/Data-Visualization-at-Twitter-56-2048.jpg)
![Time + Geo Tweet pattern [Rios & Lin 2012]
Night
Late night
Daytime
Night
Late night
Daytime](https://image.slidesharecdn.com/kristwhackshackers-141008230755-conversion-gate02/75/Data-Visualization-at-Twitter-57-2048.jpg)
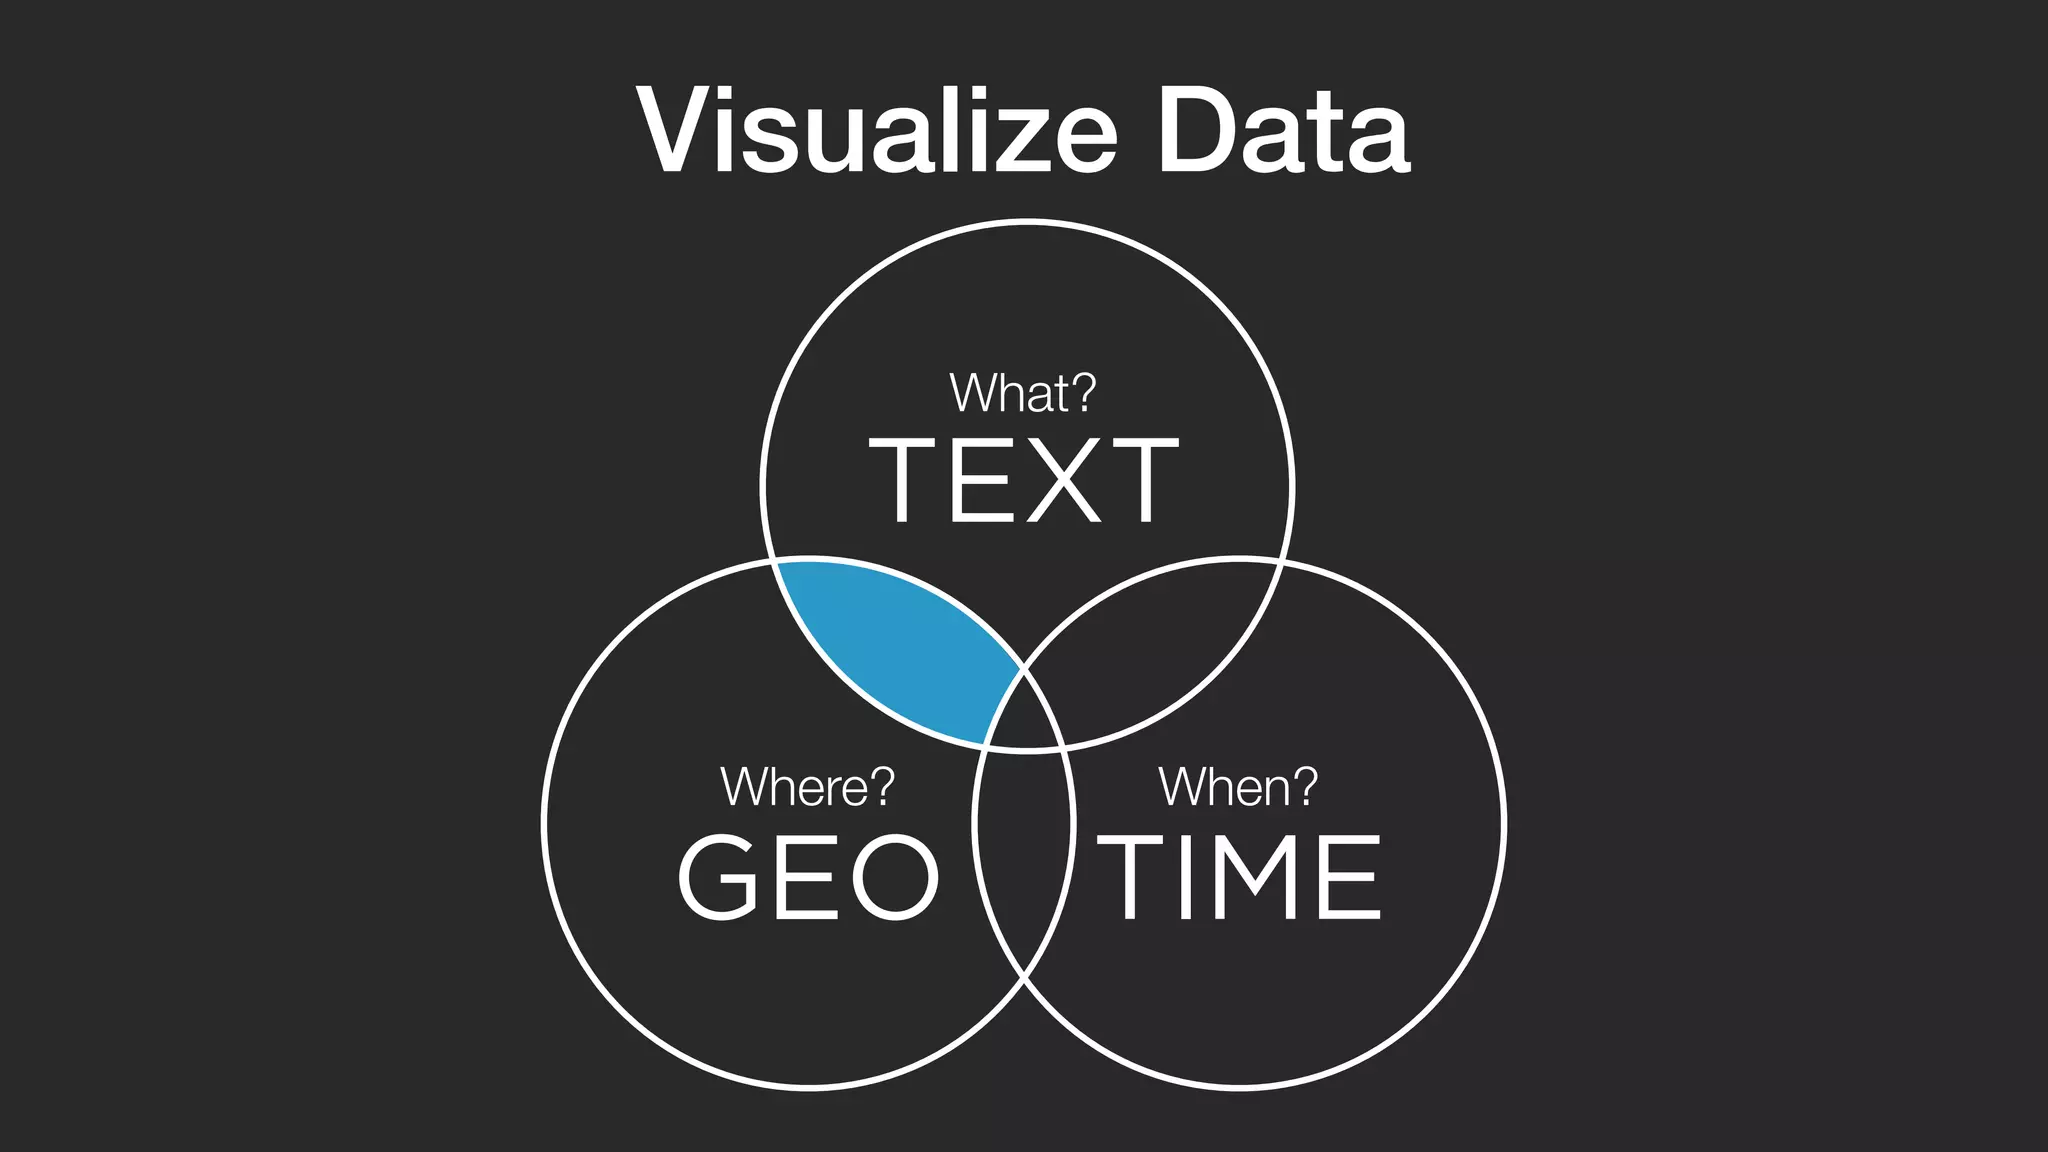

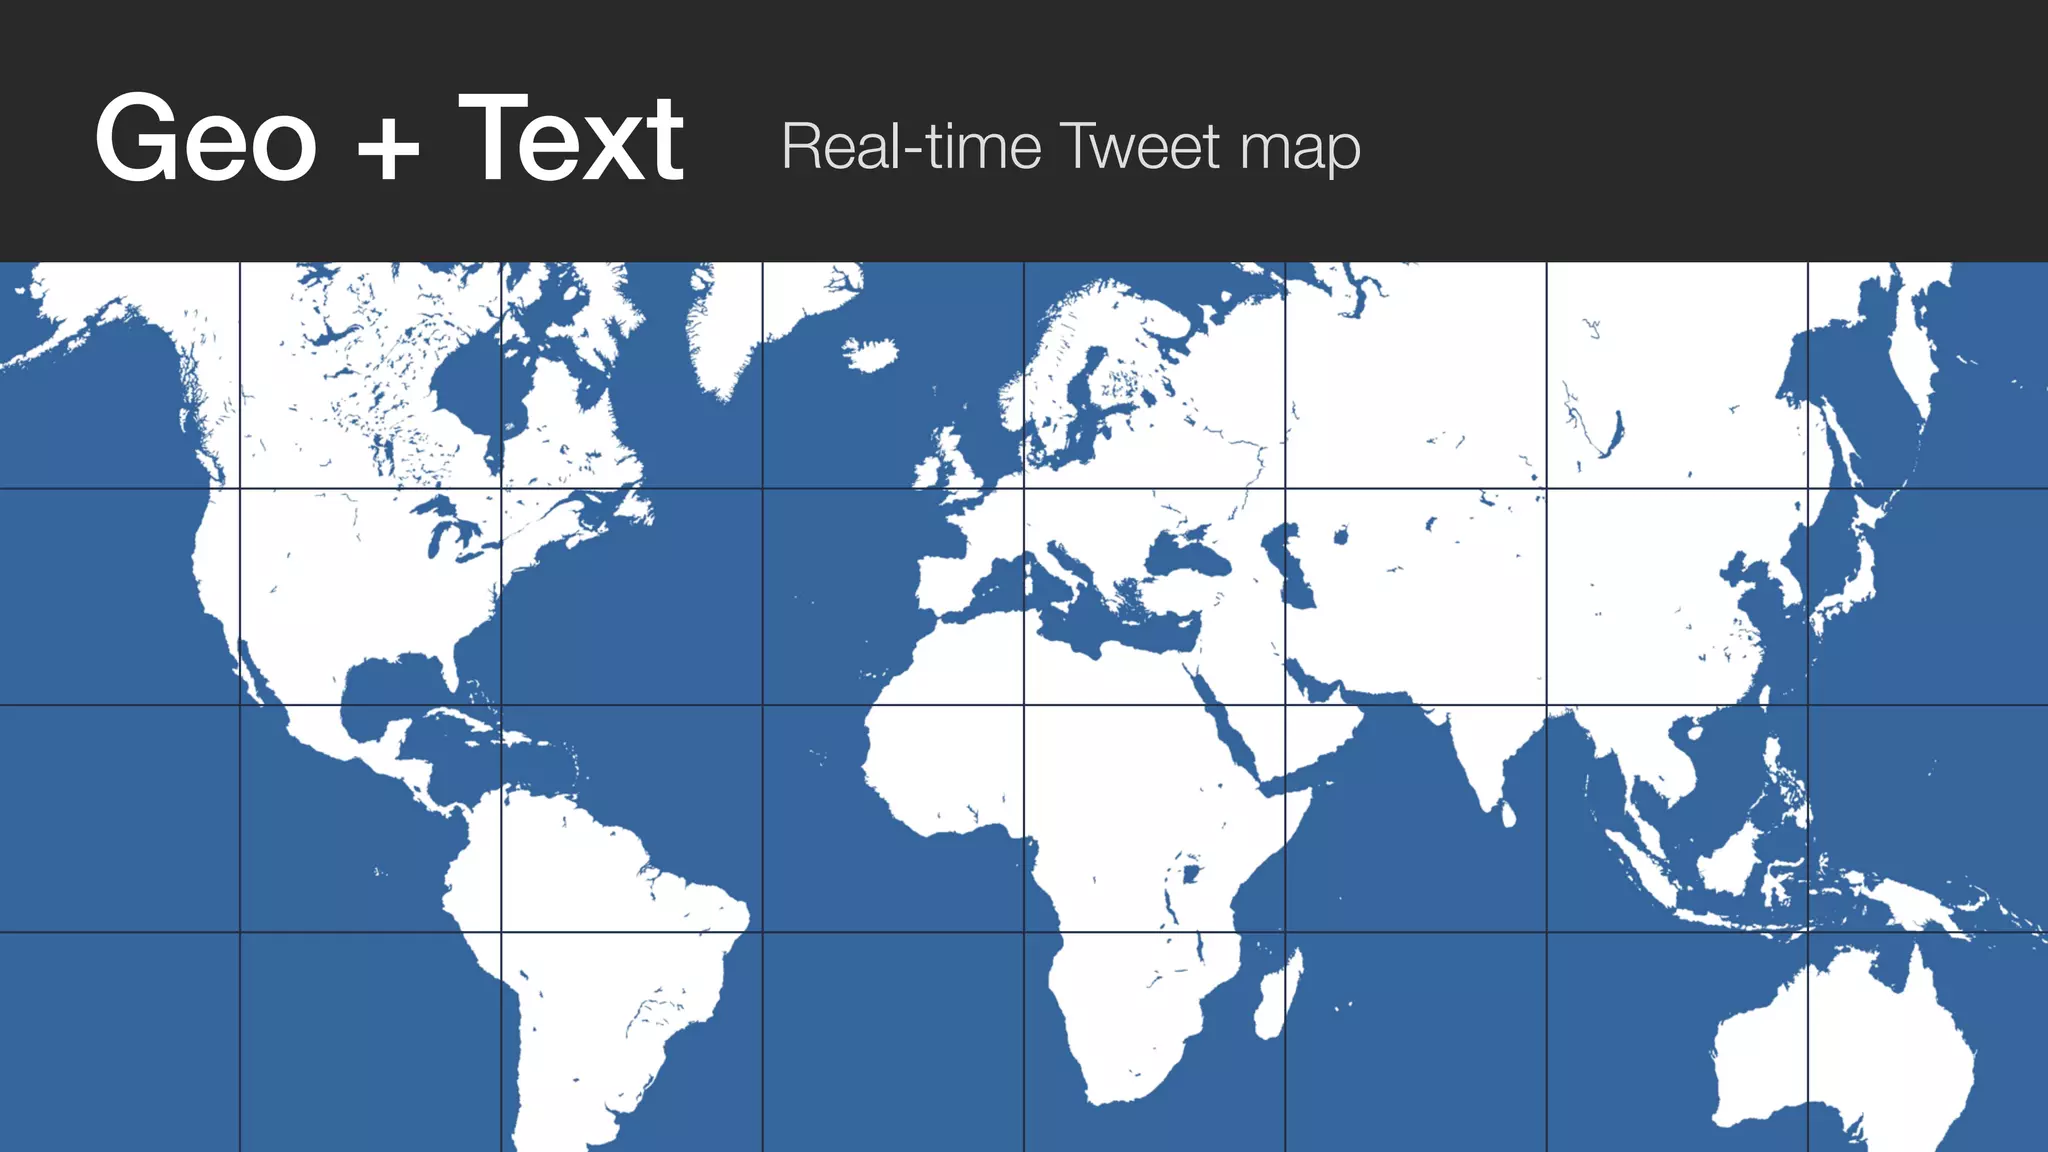
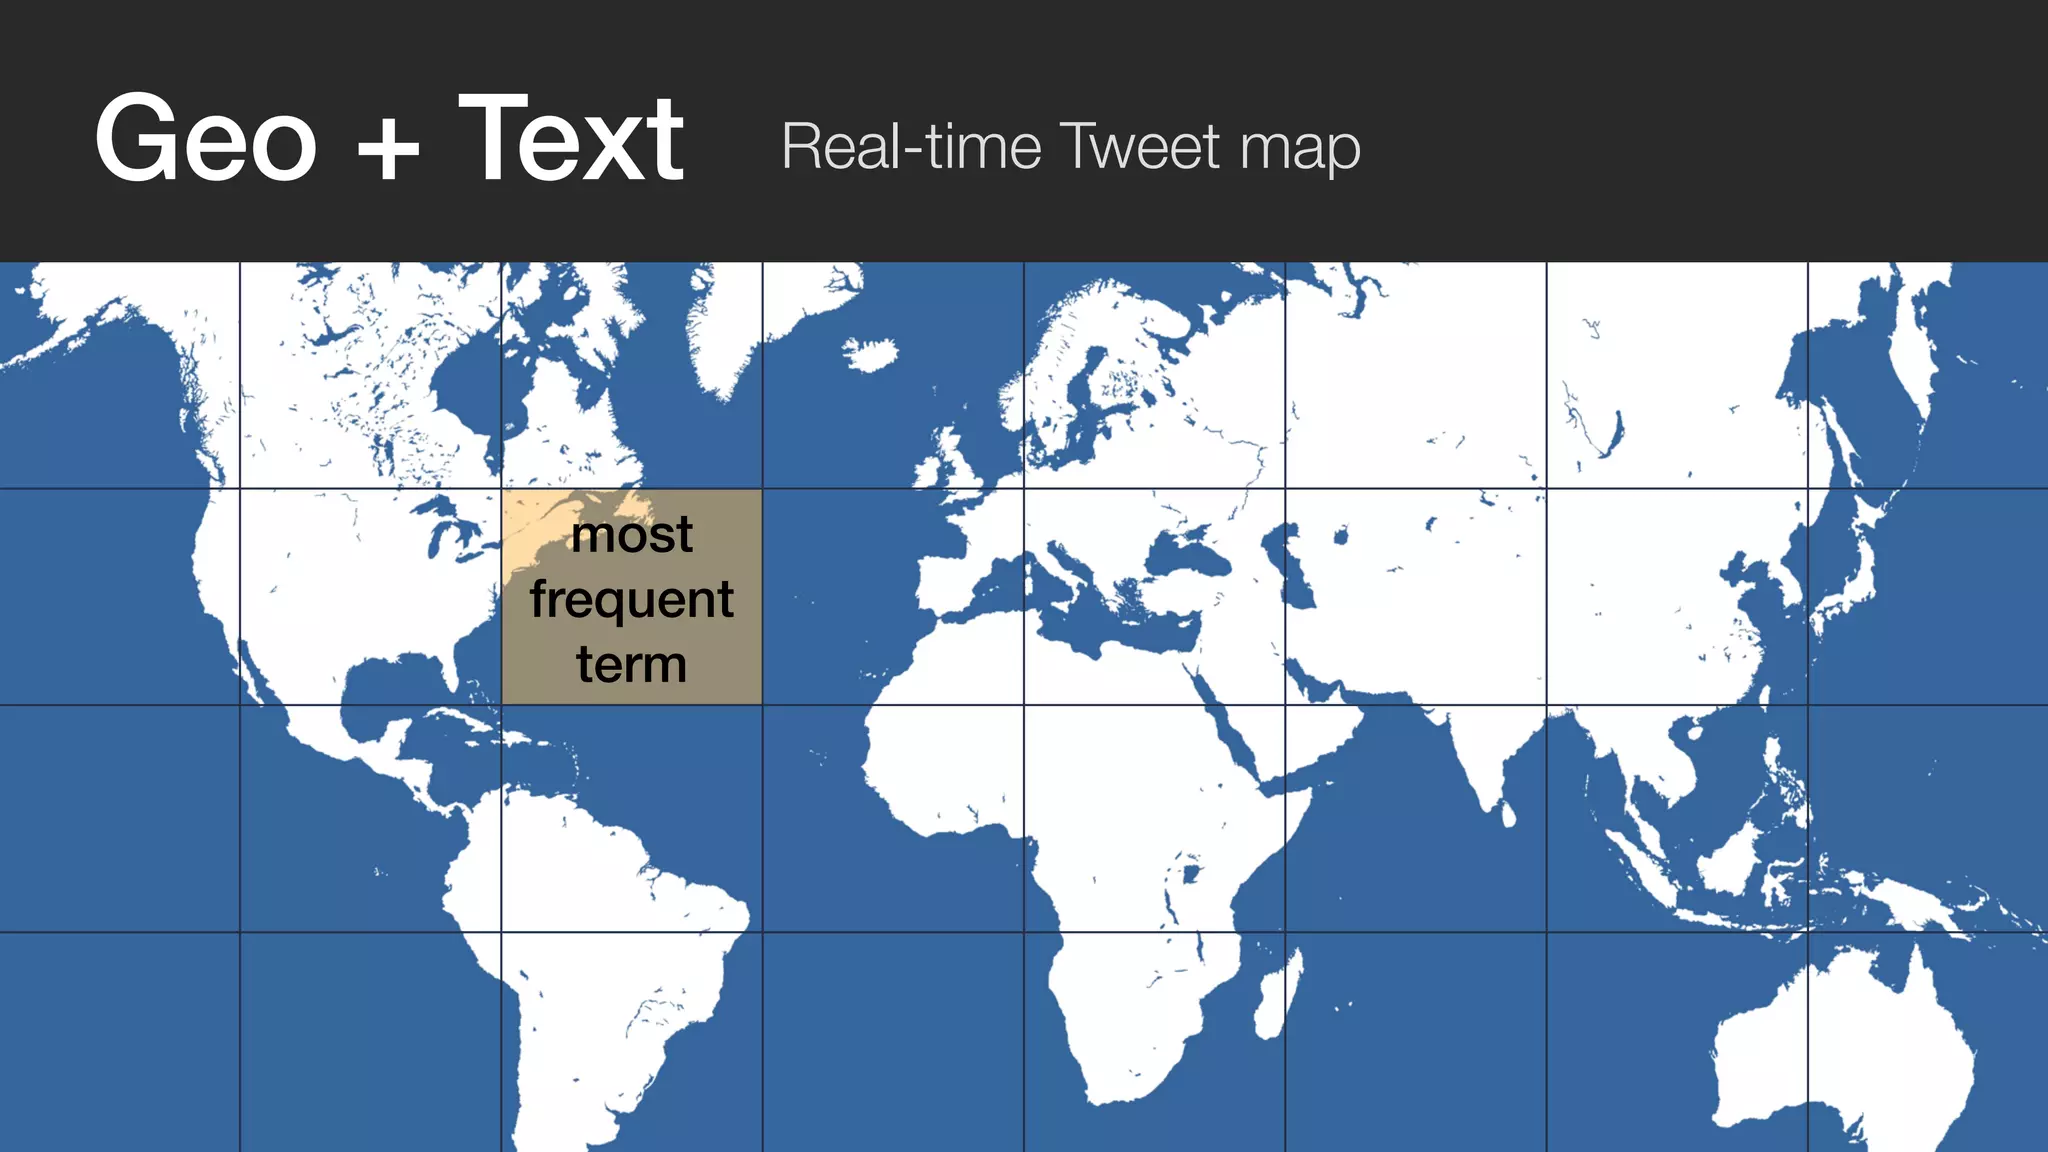
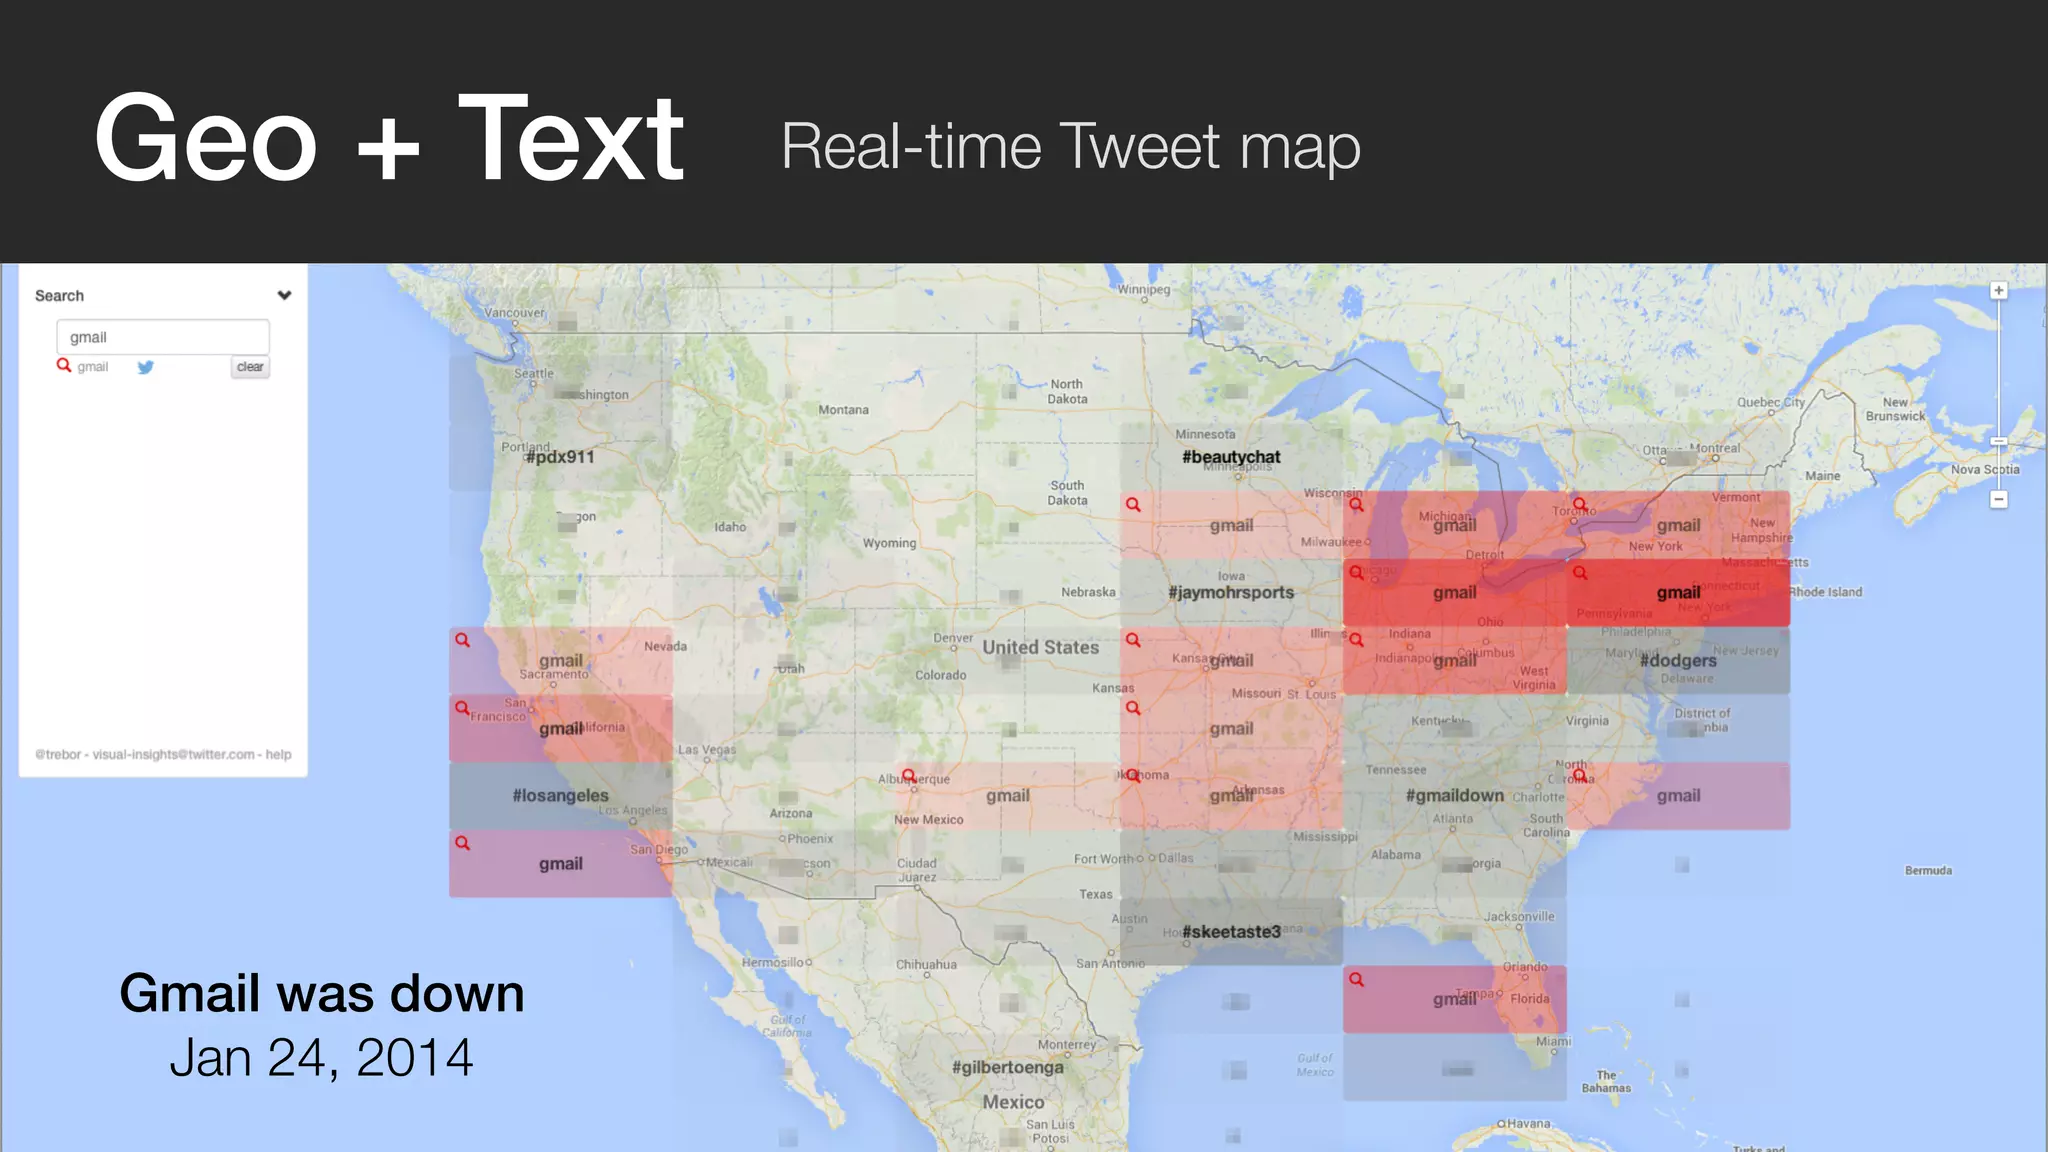
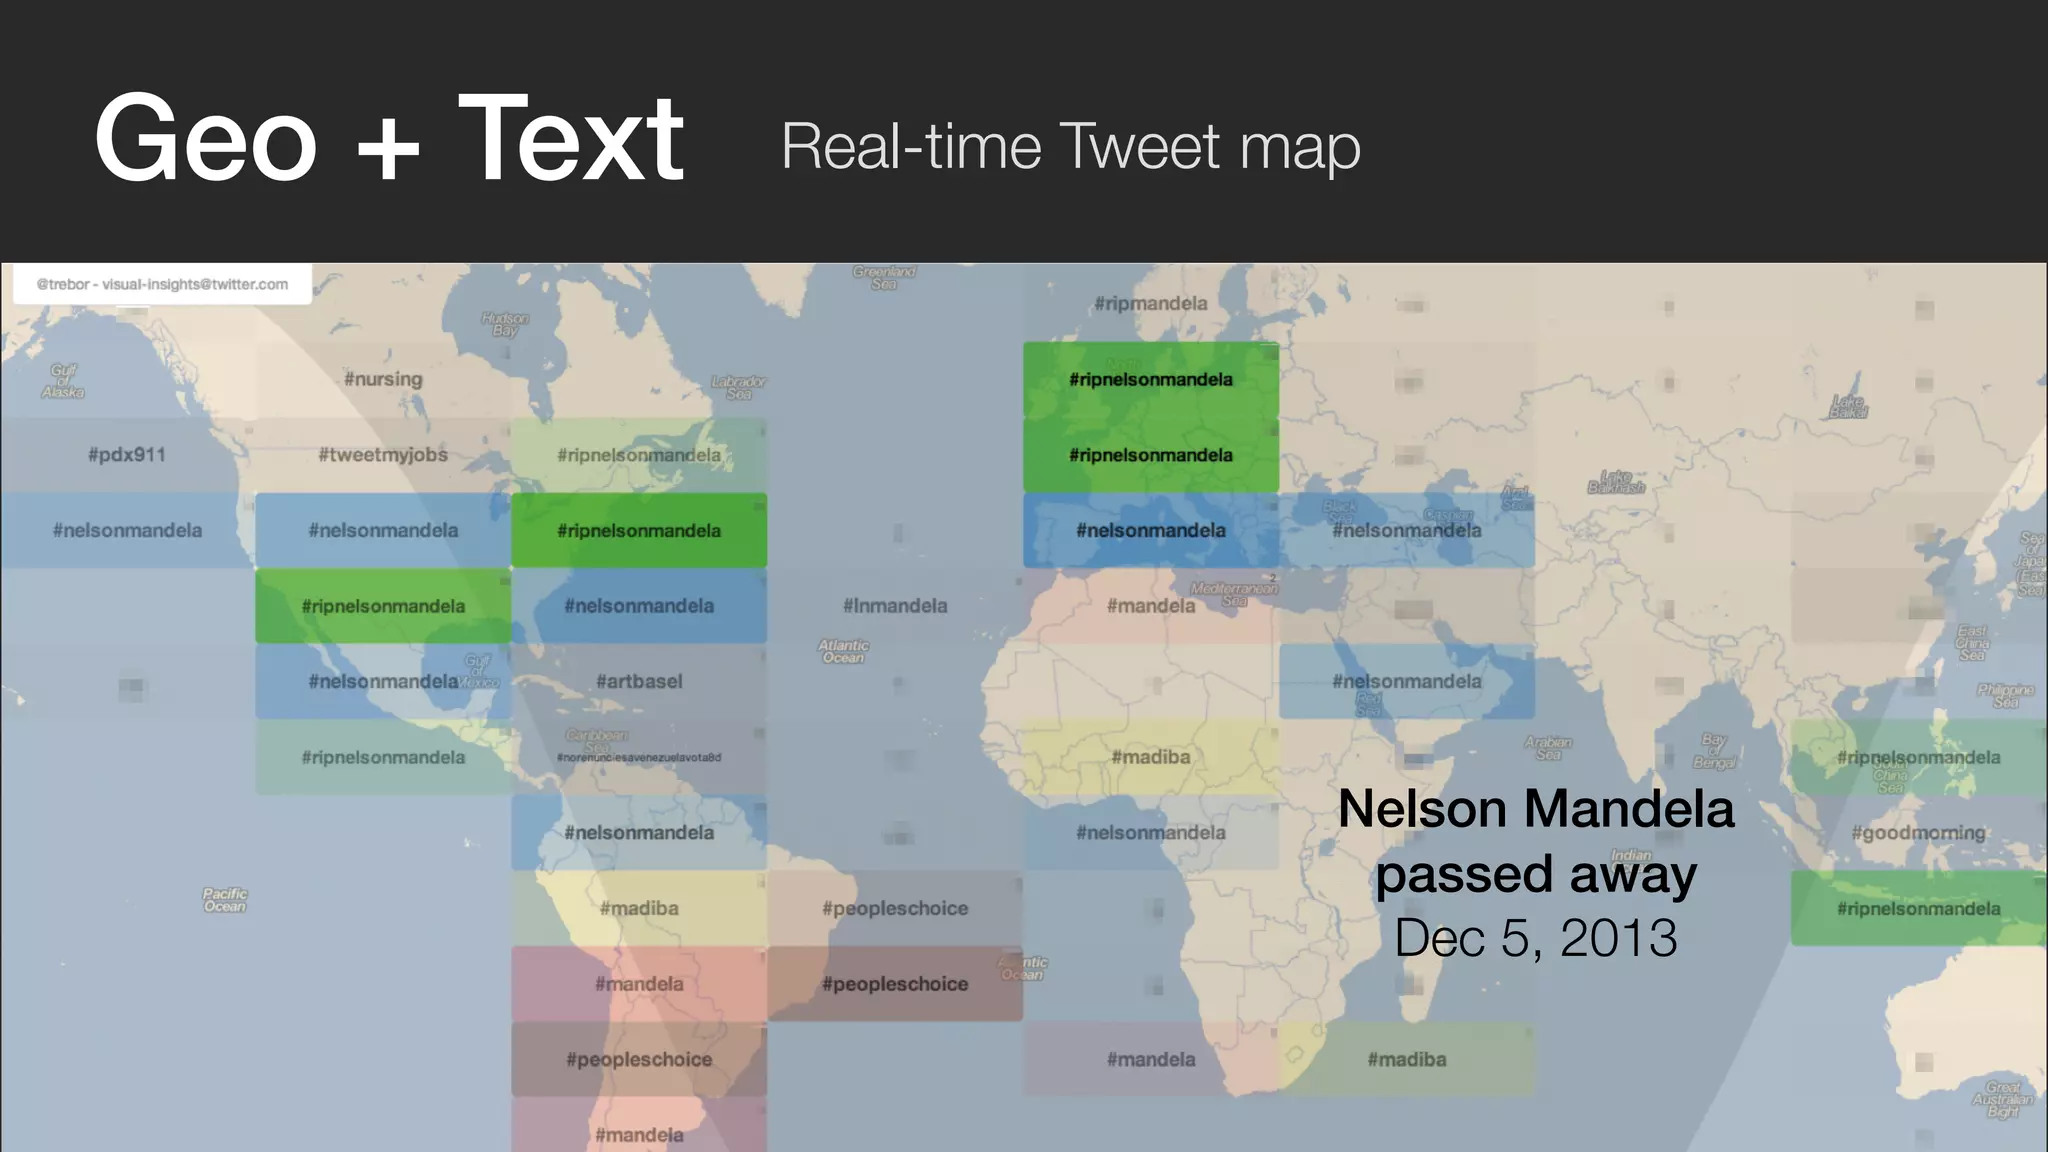
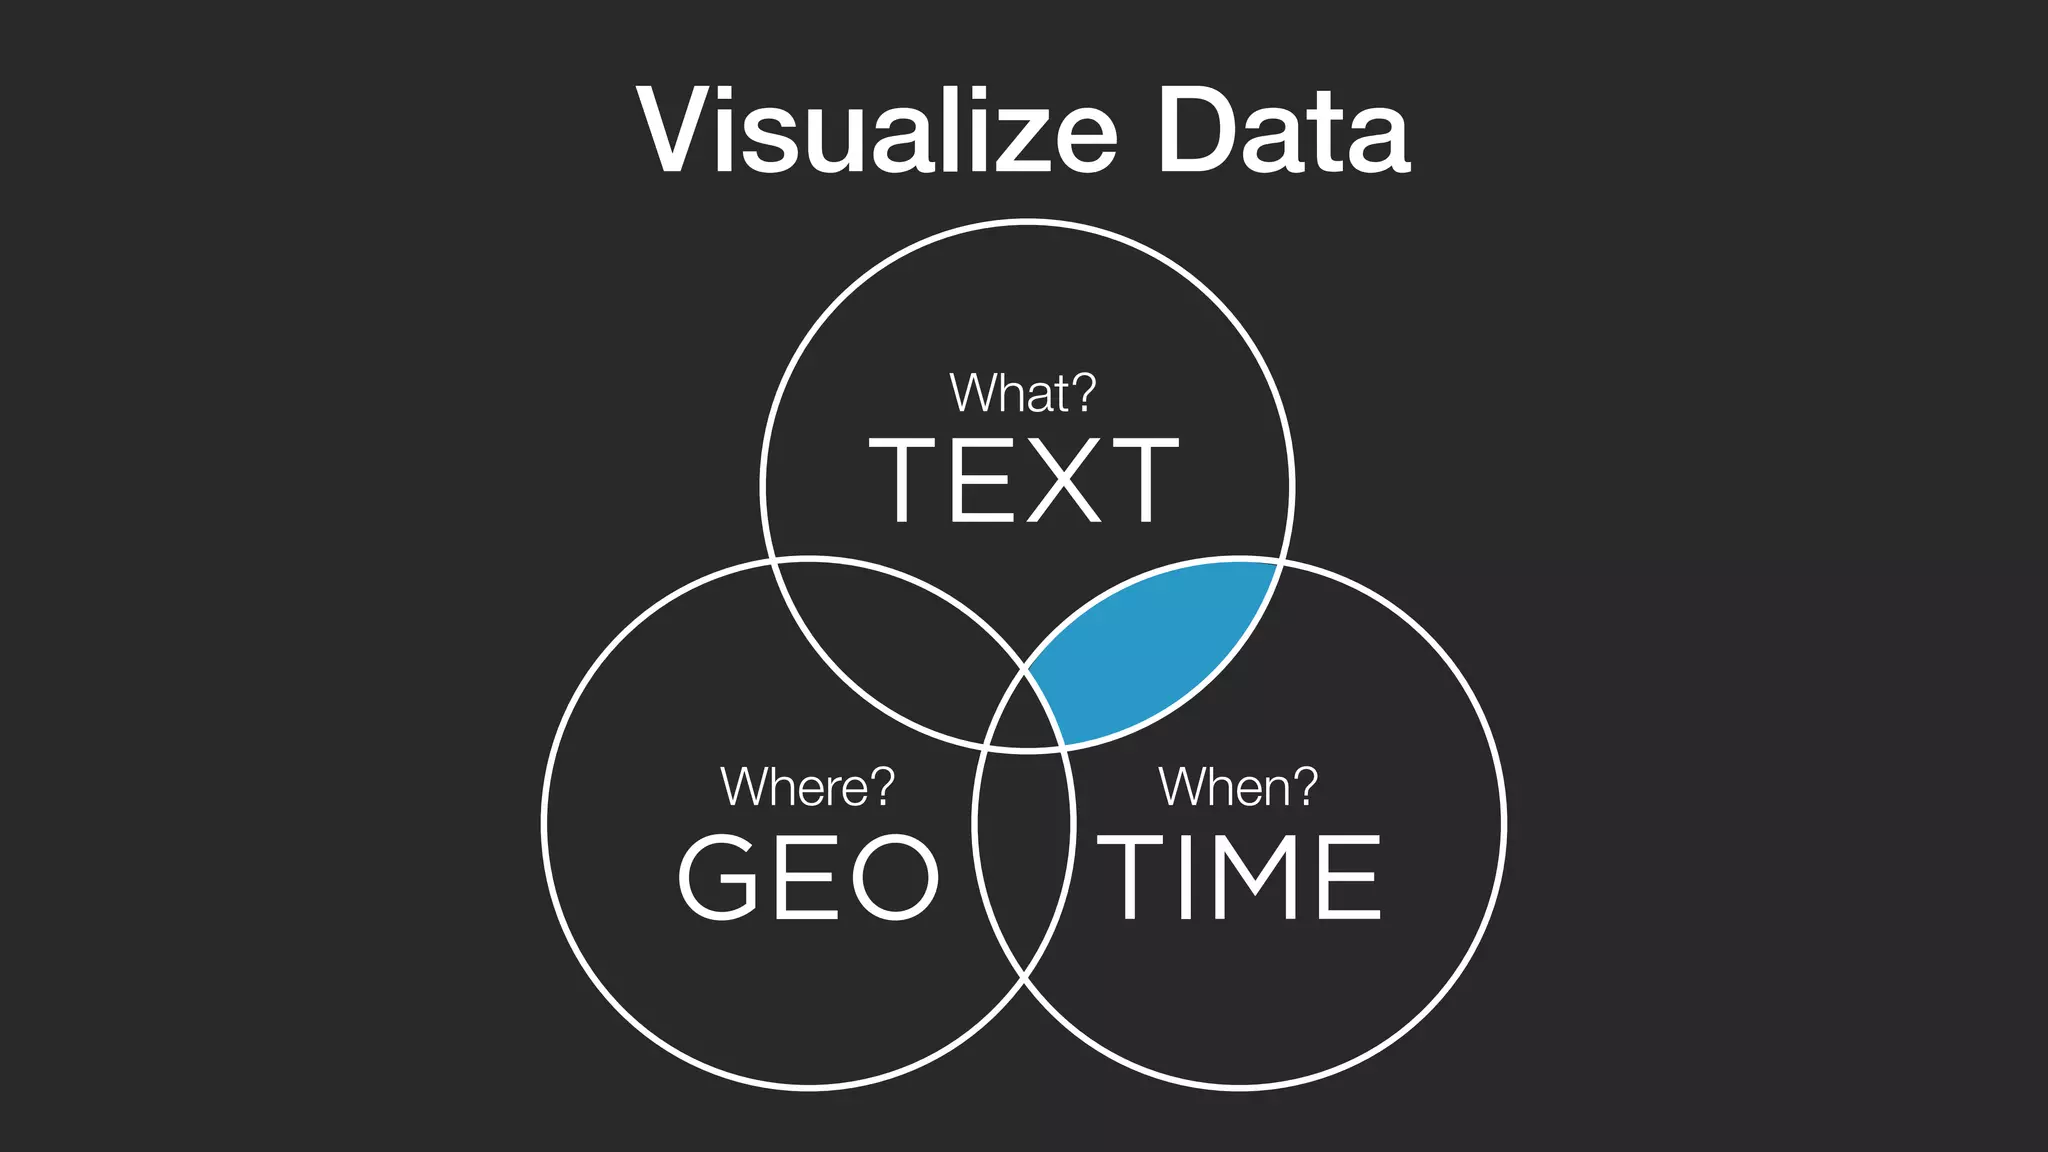
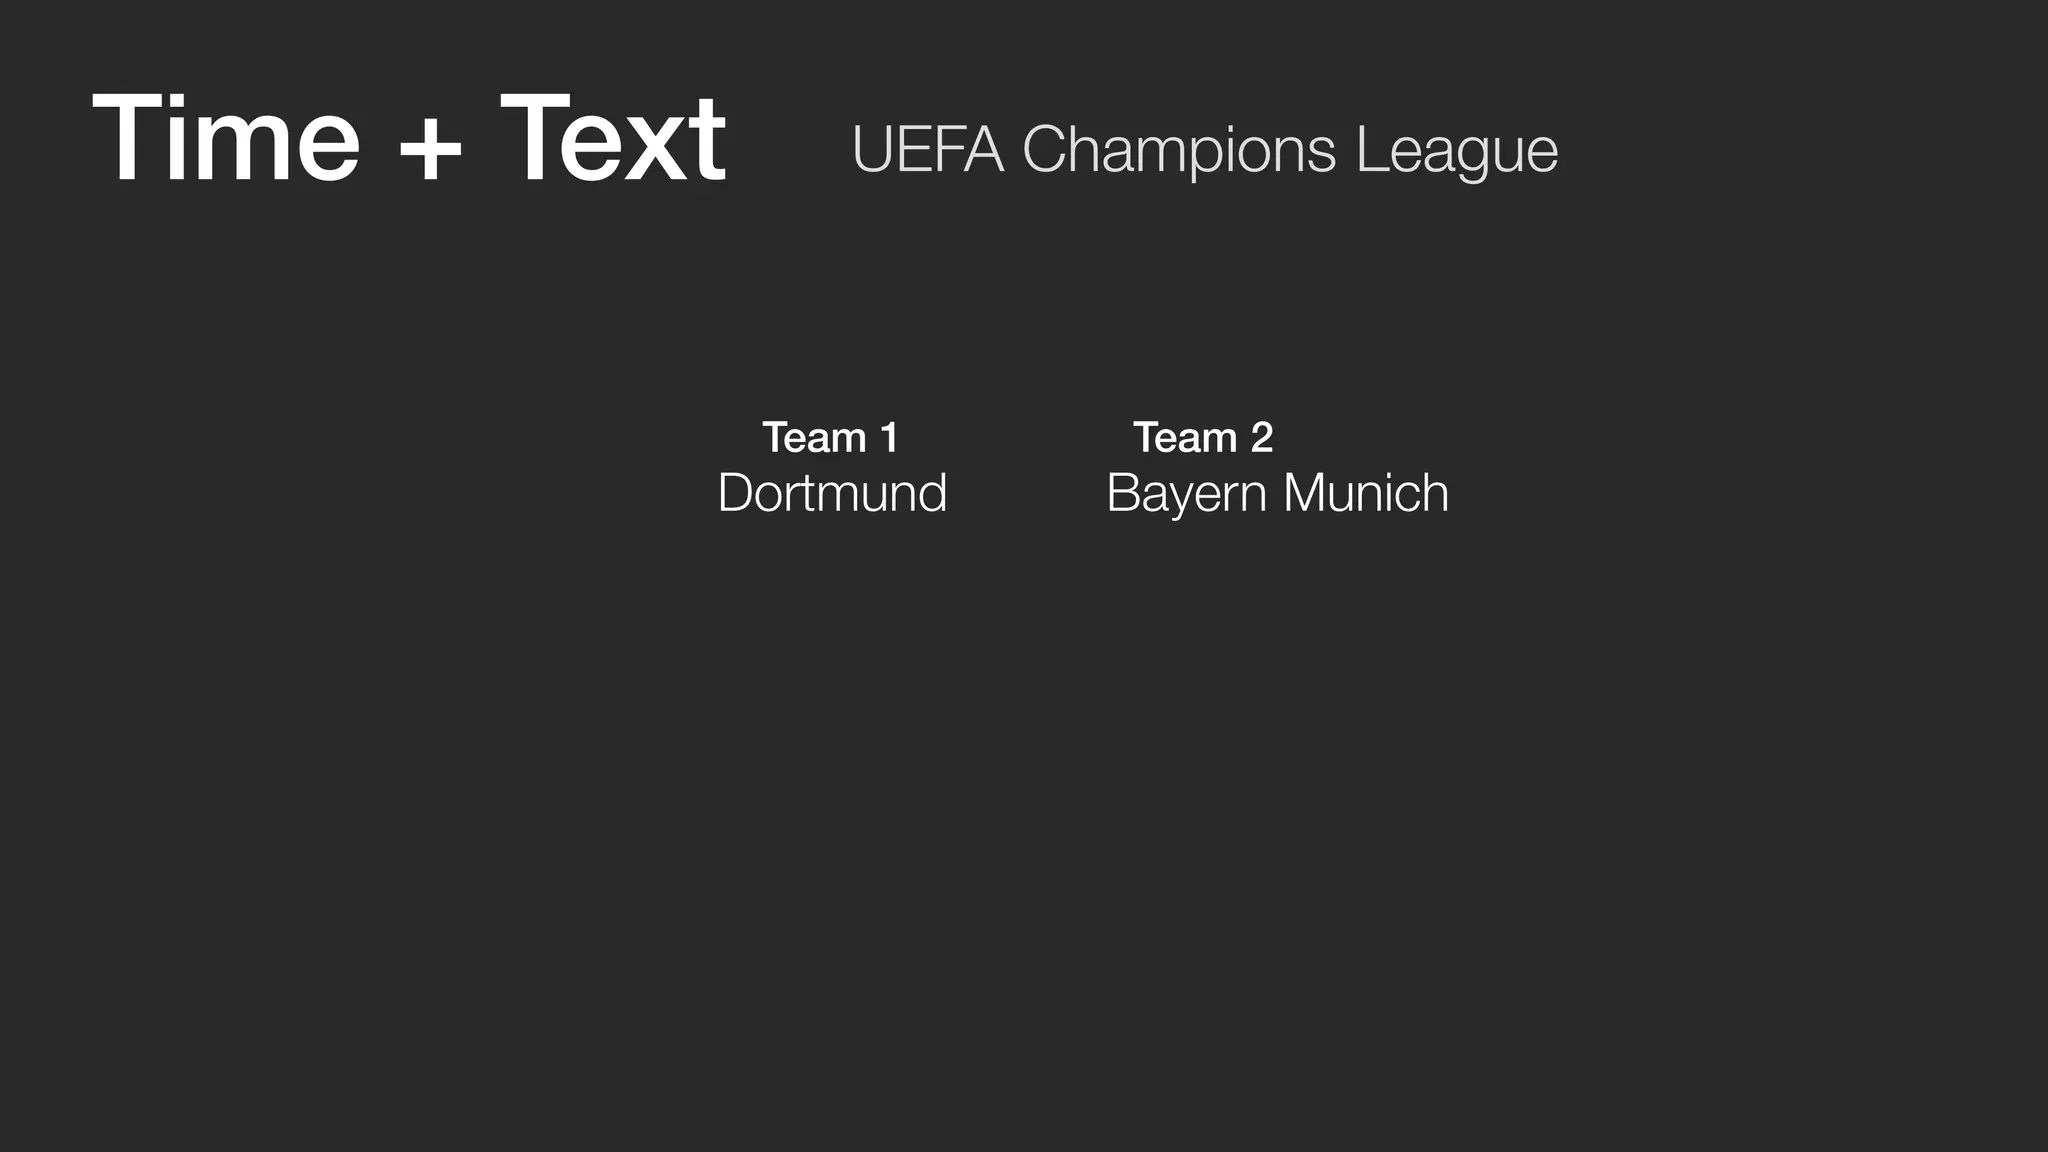
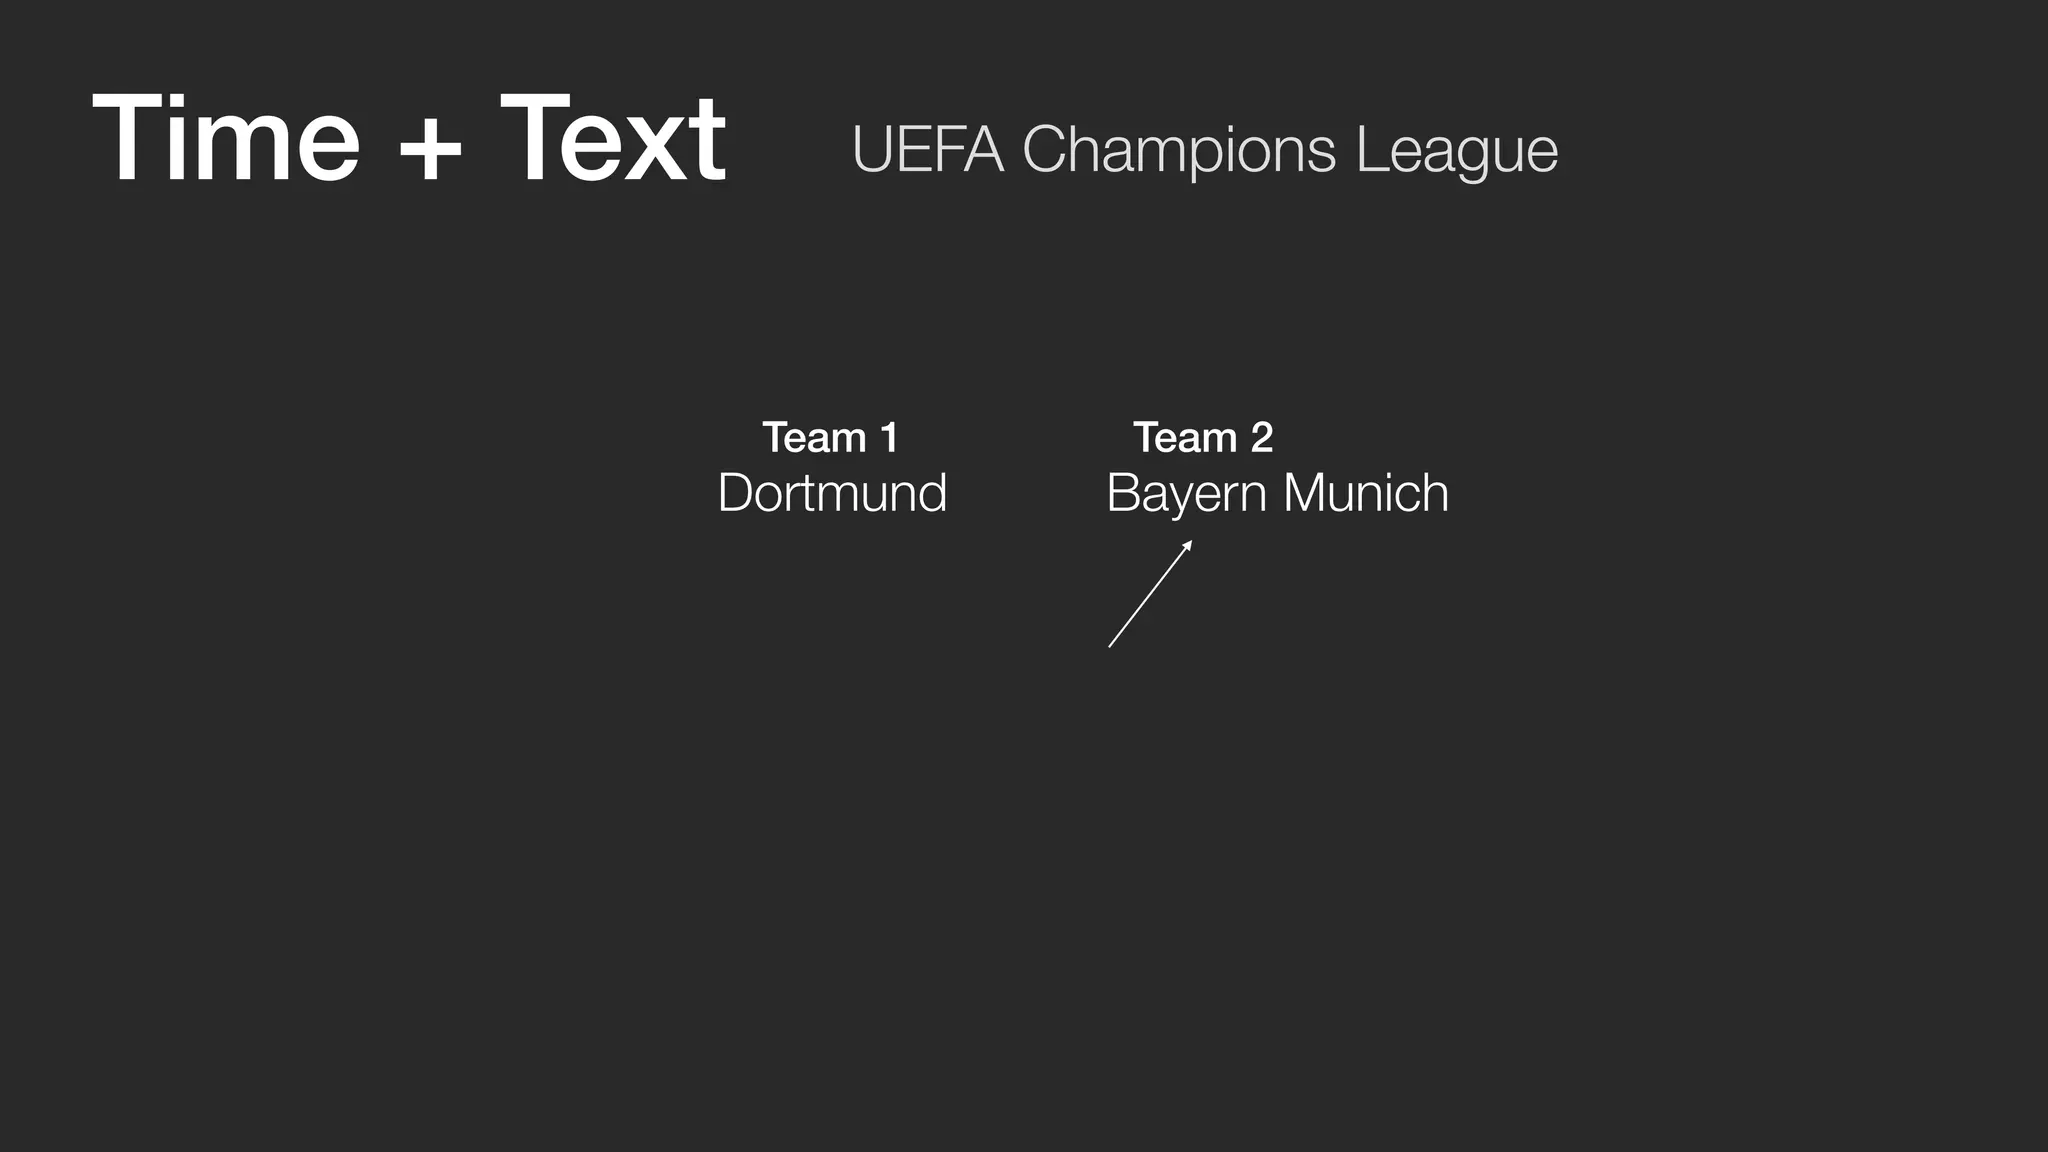
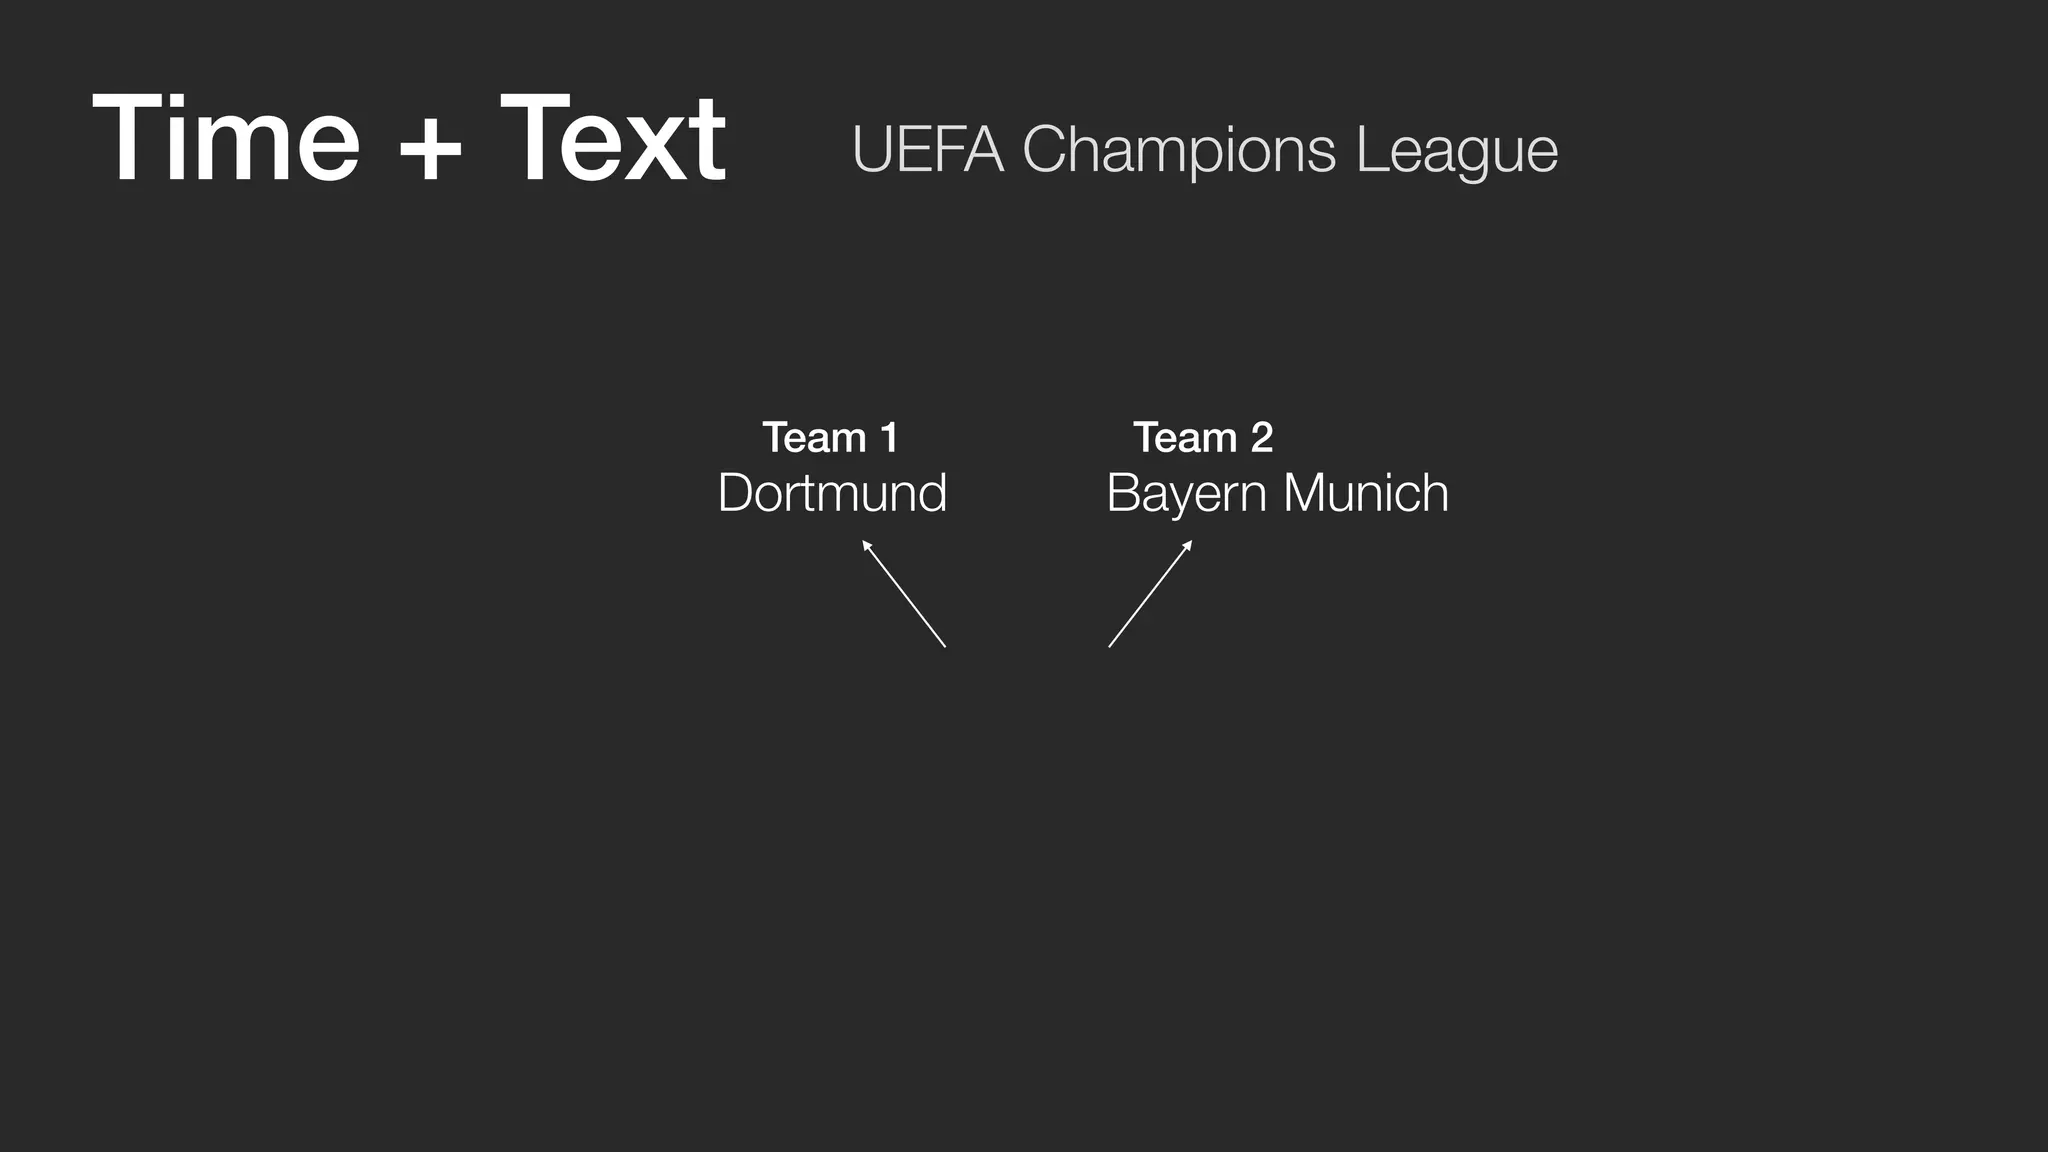
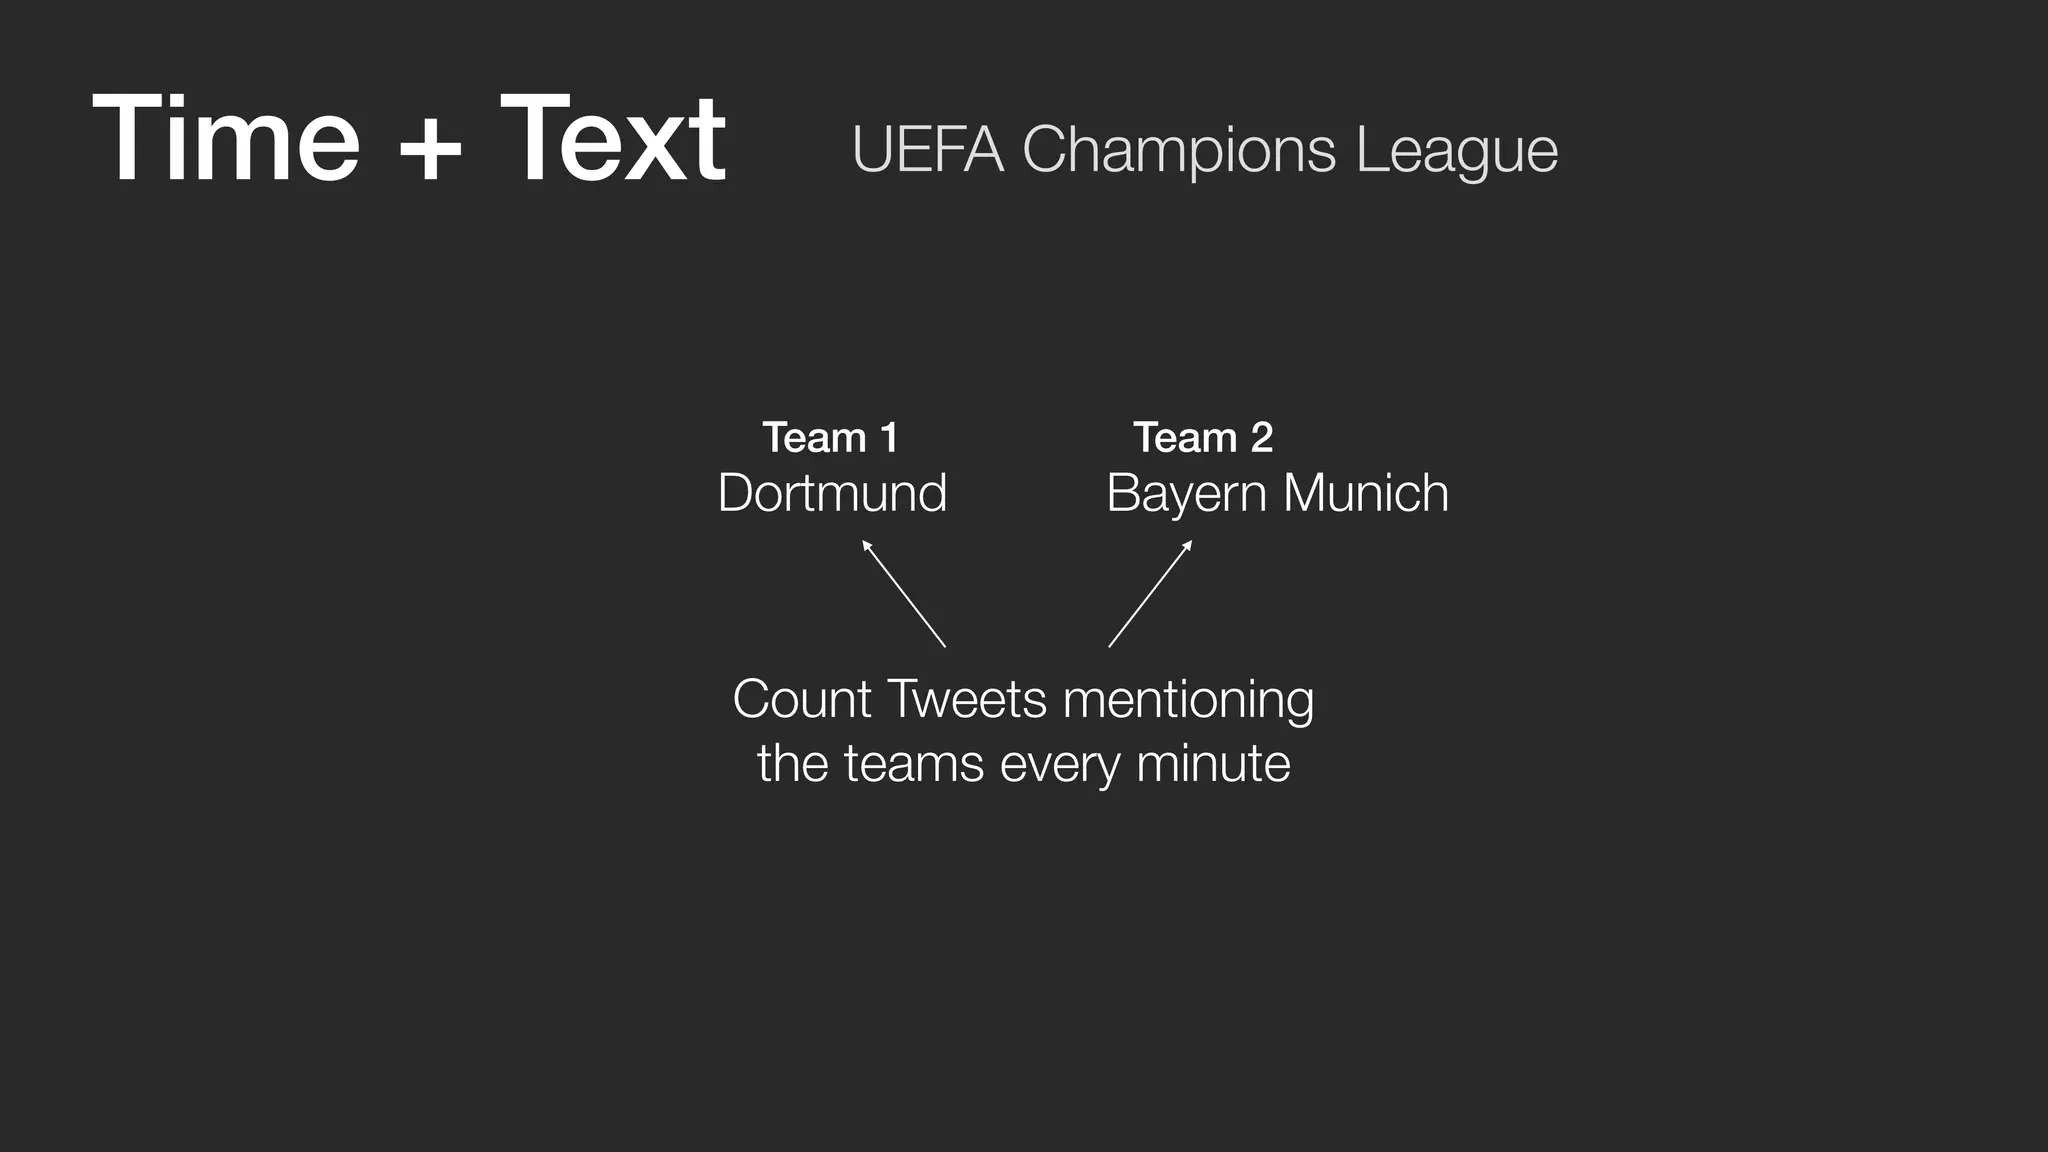
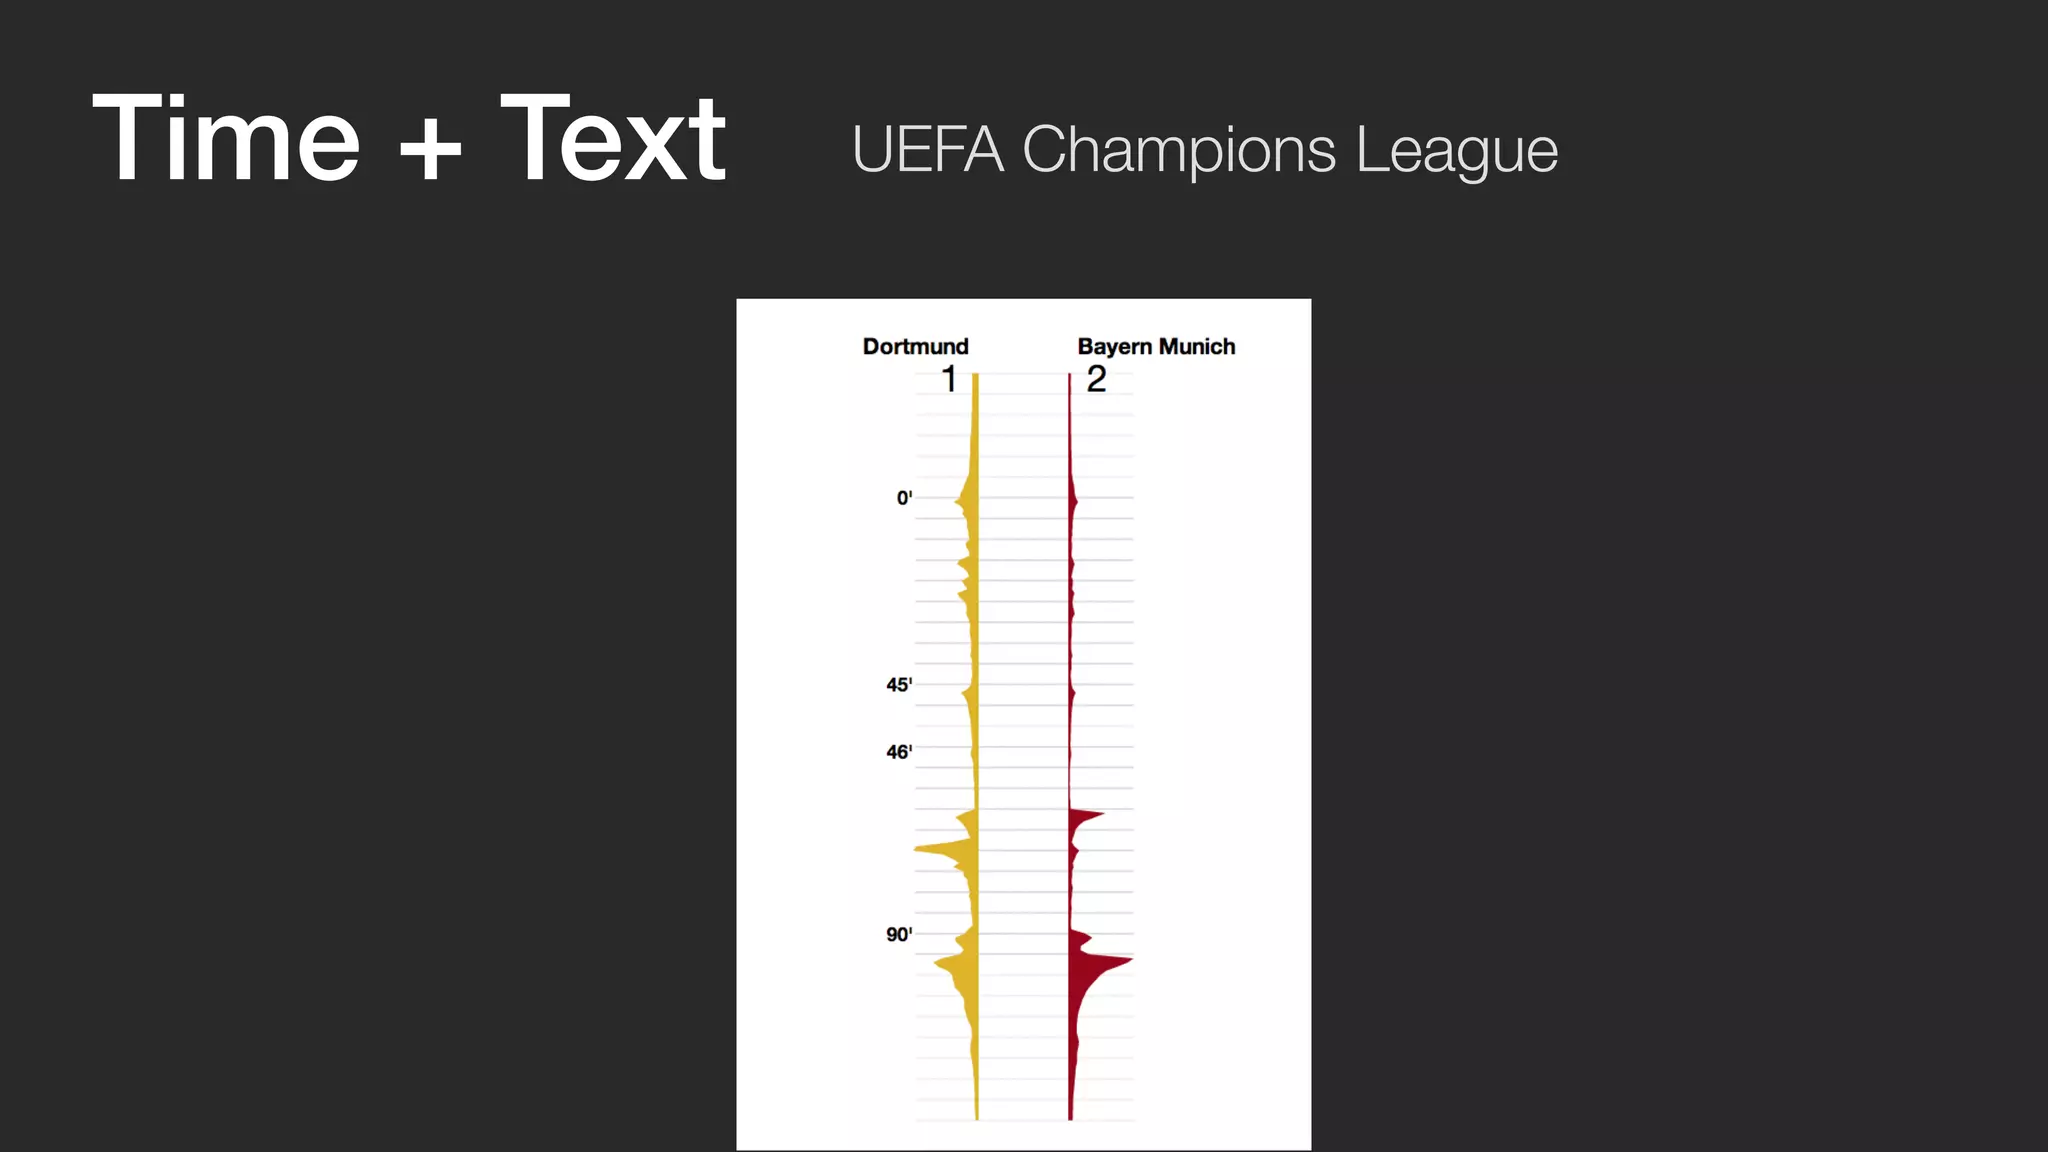
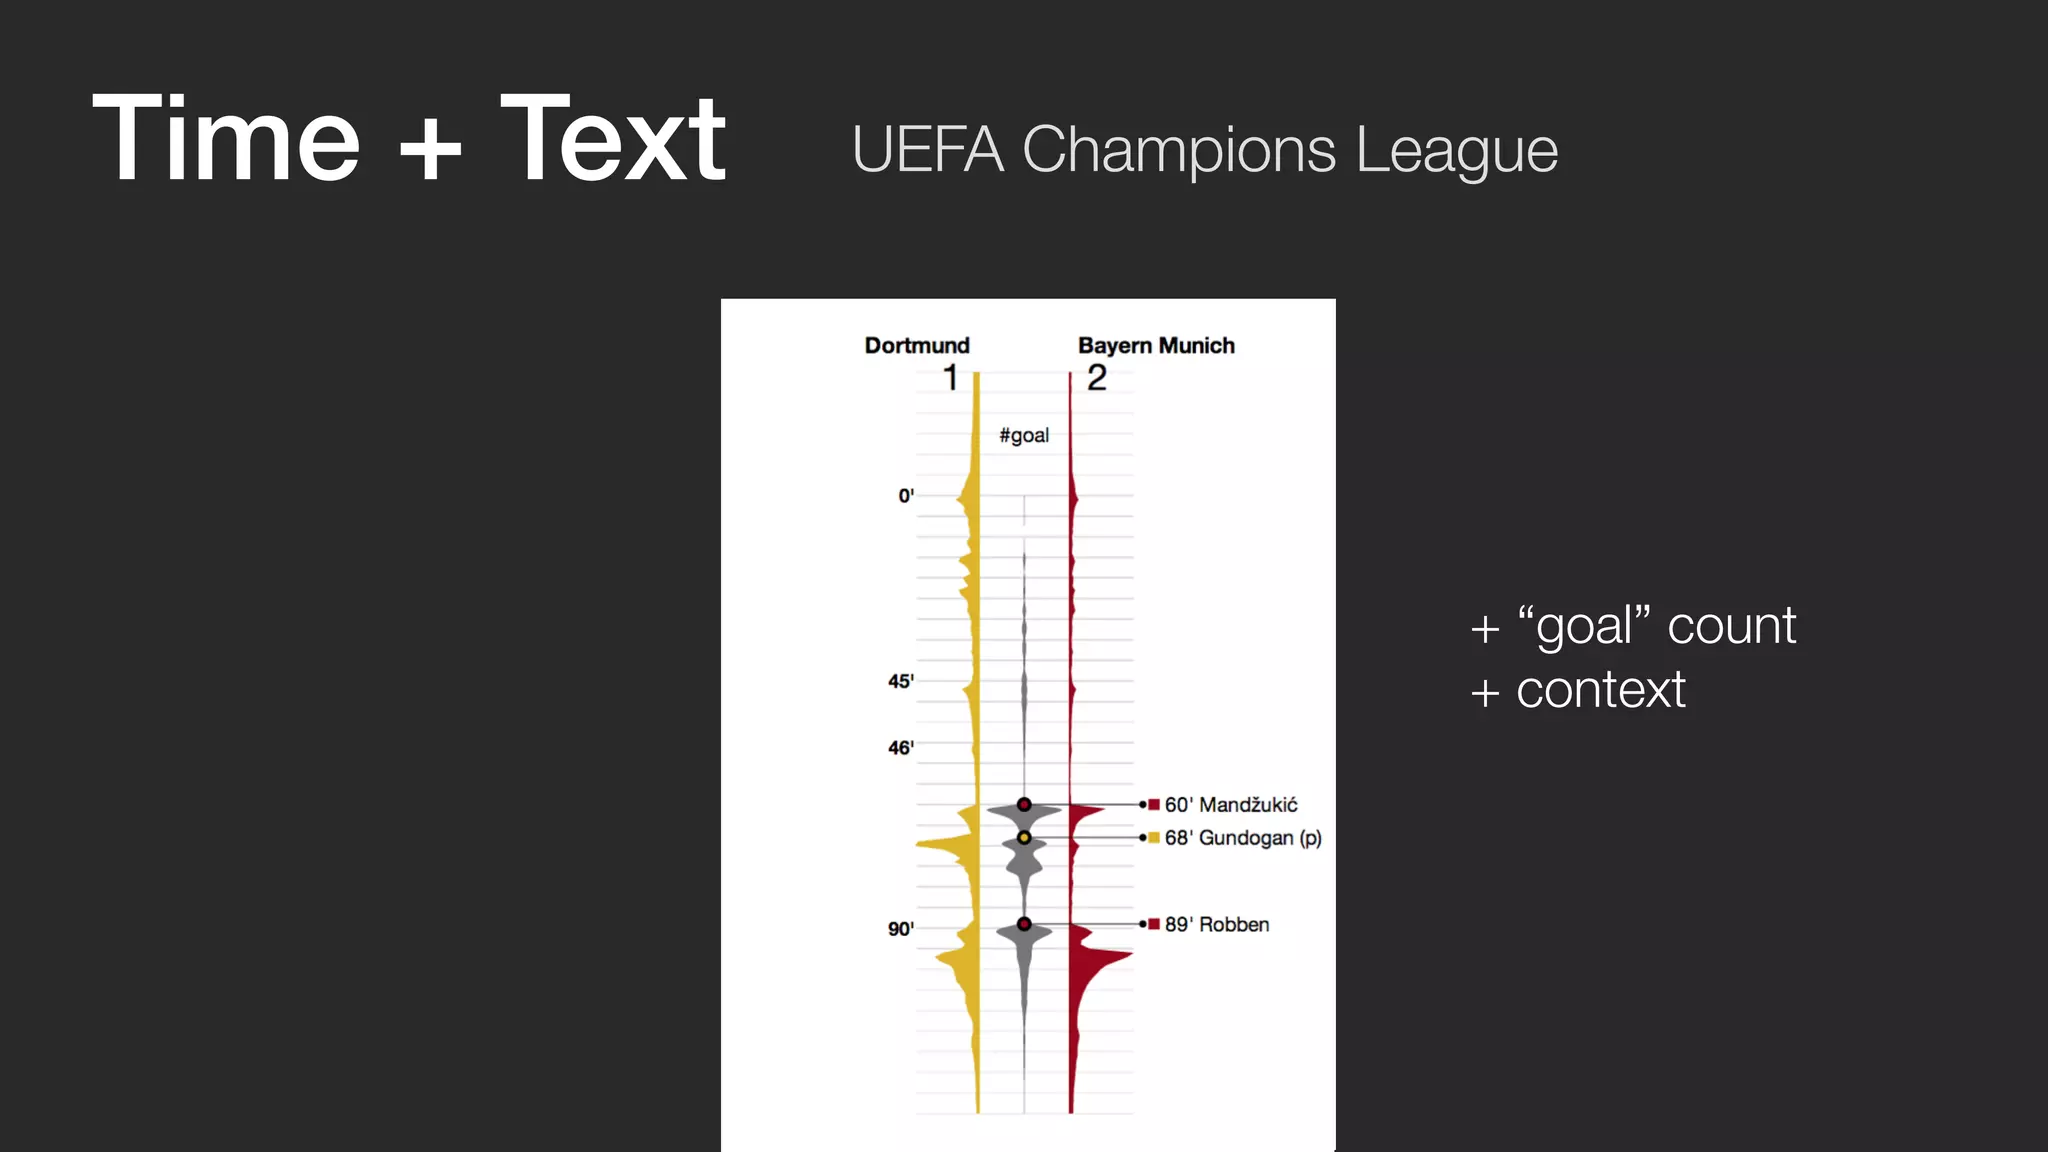
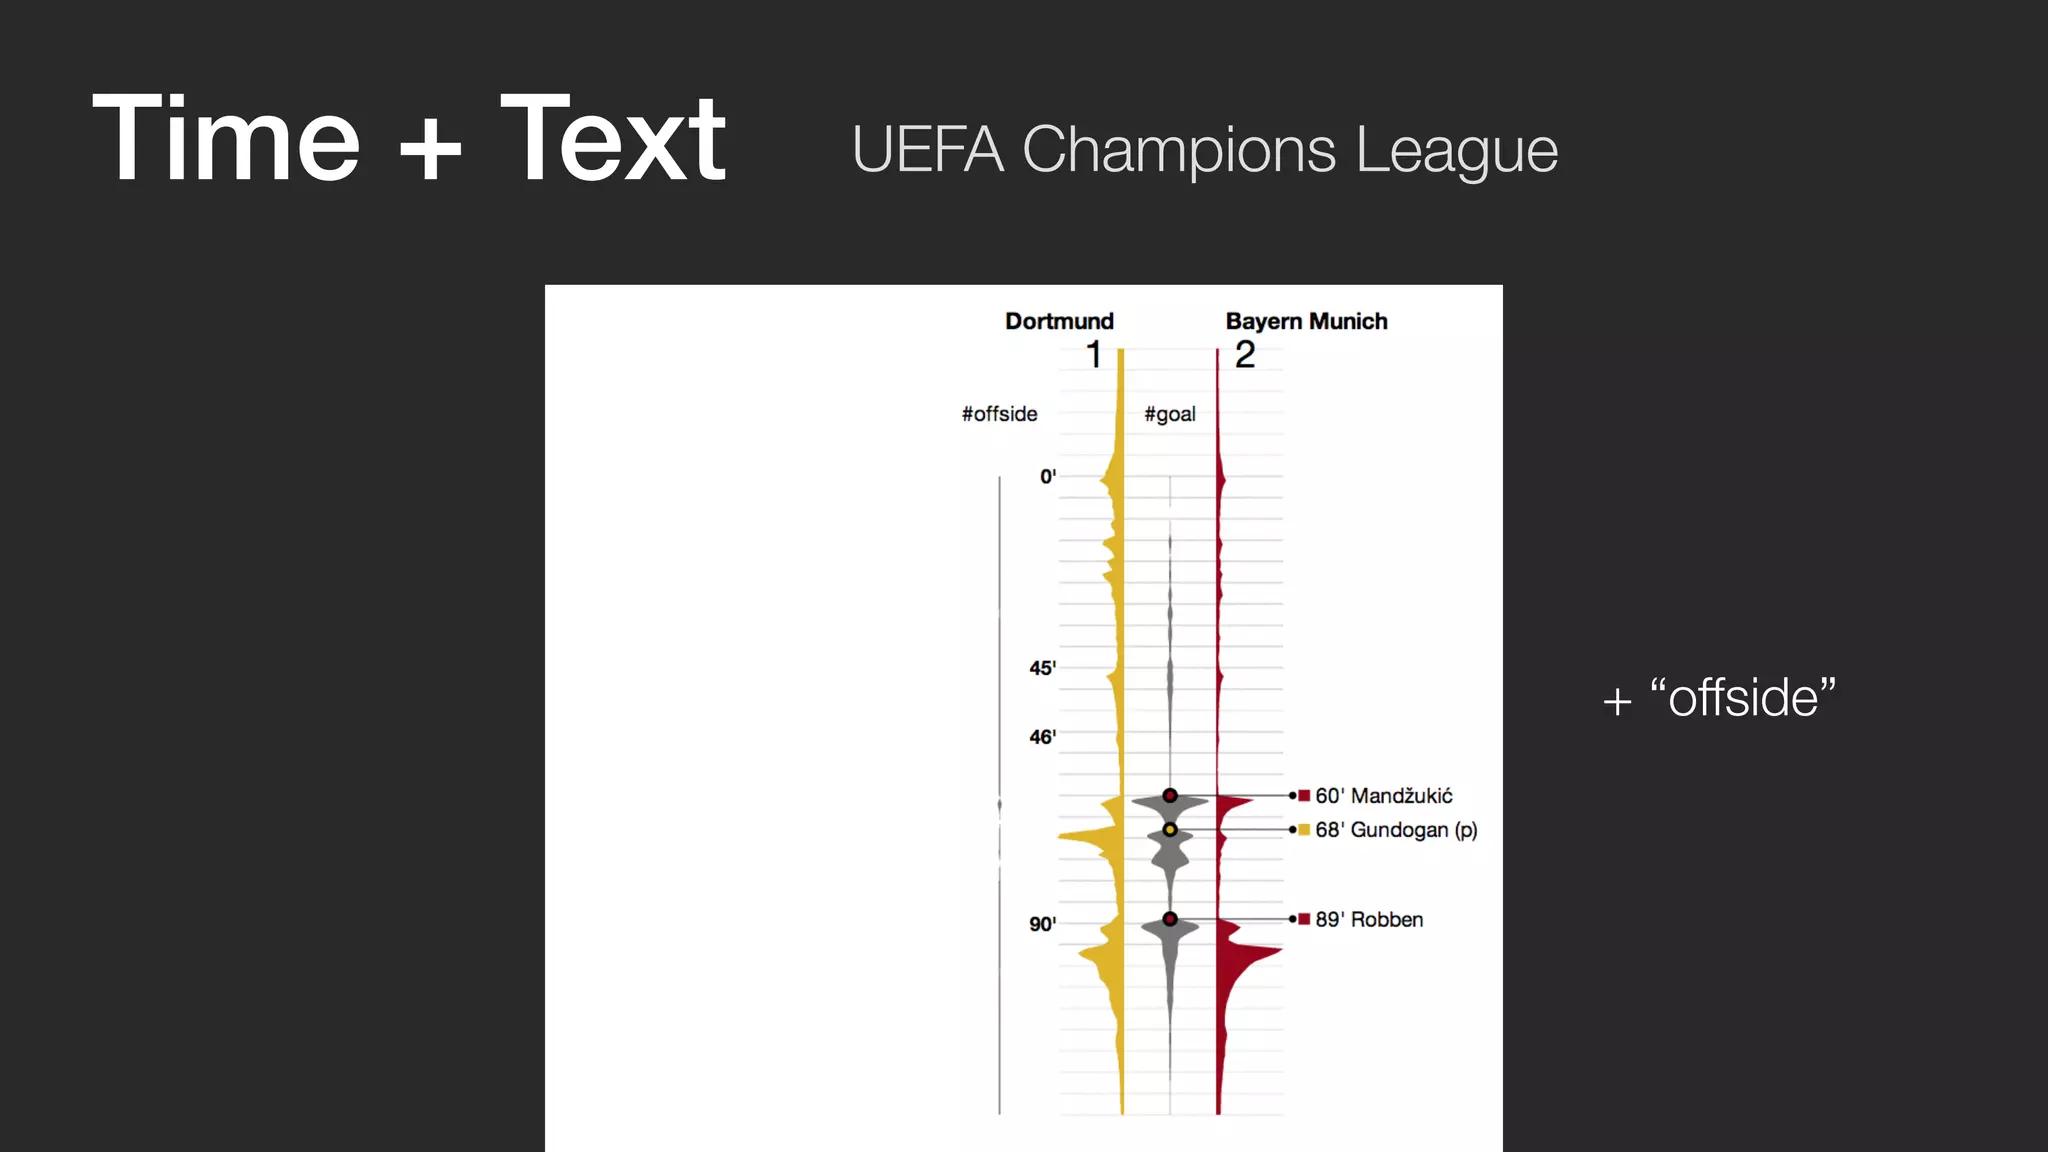
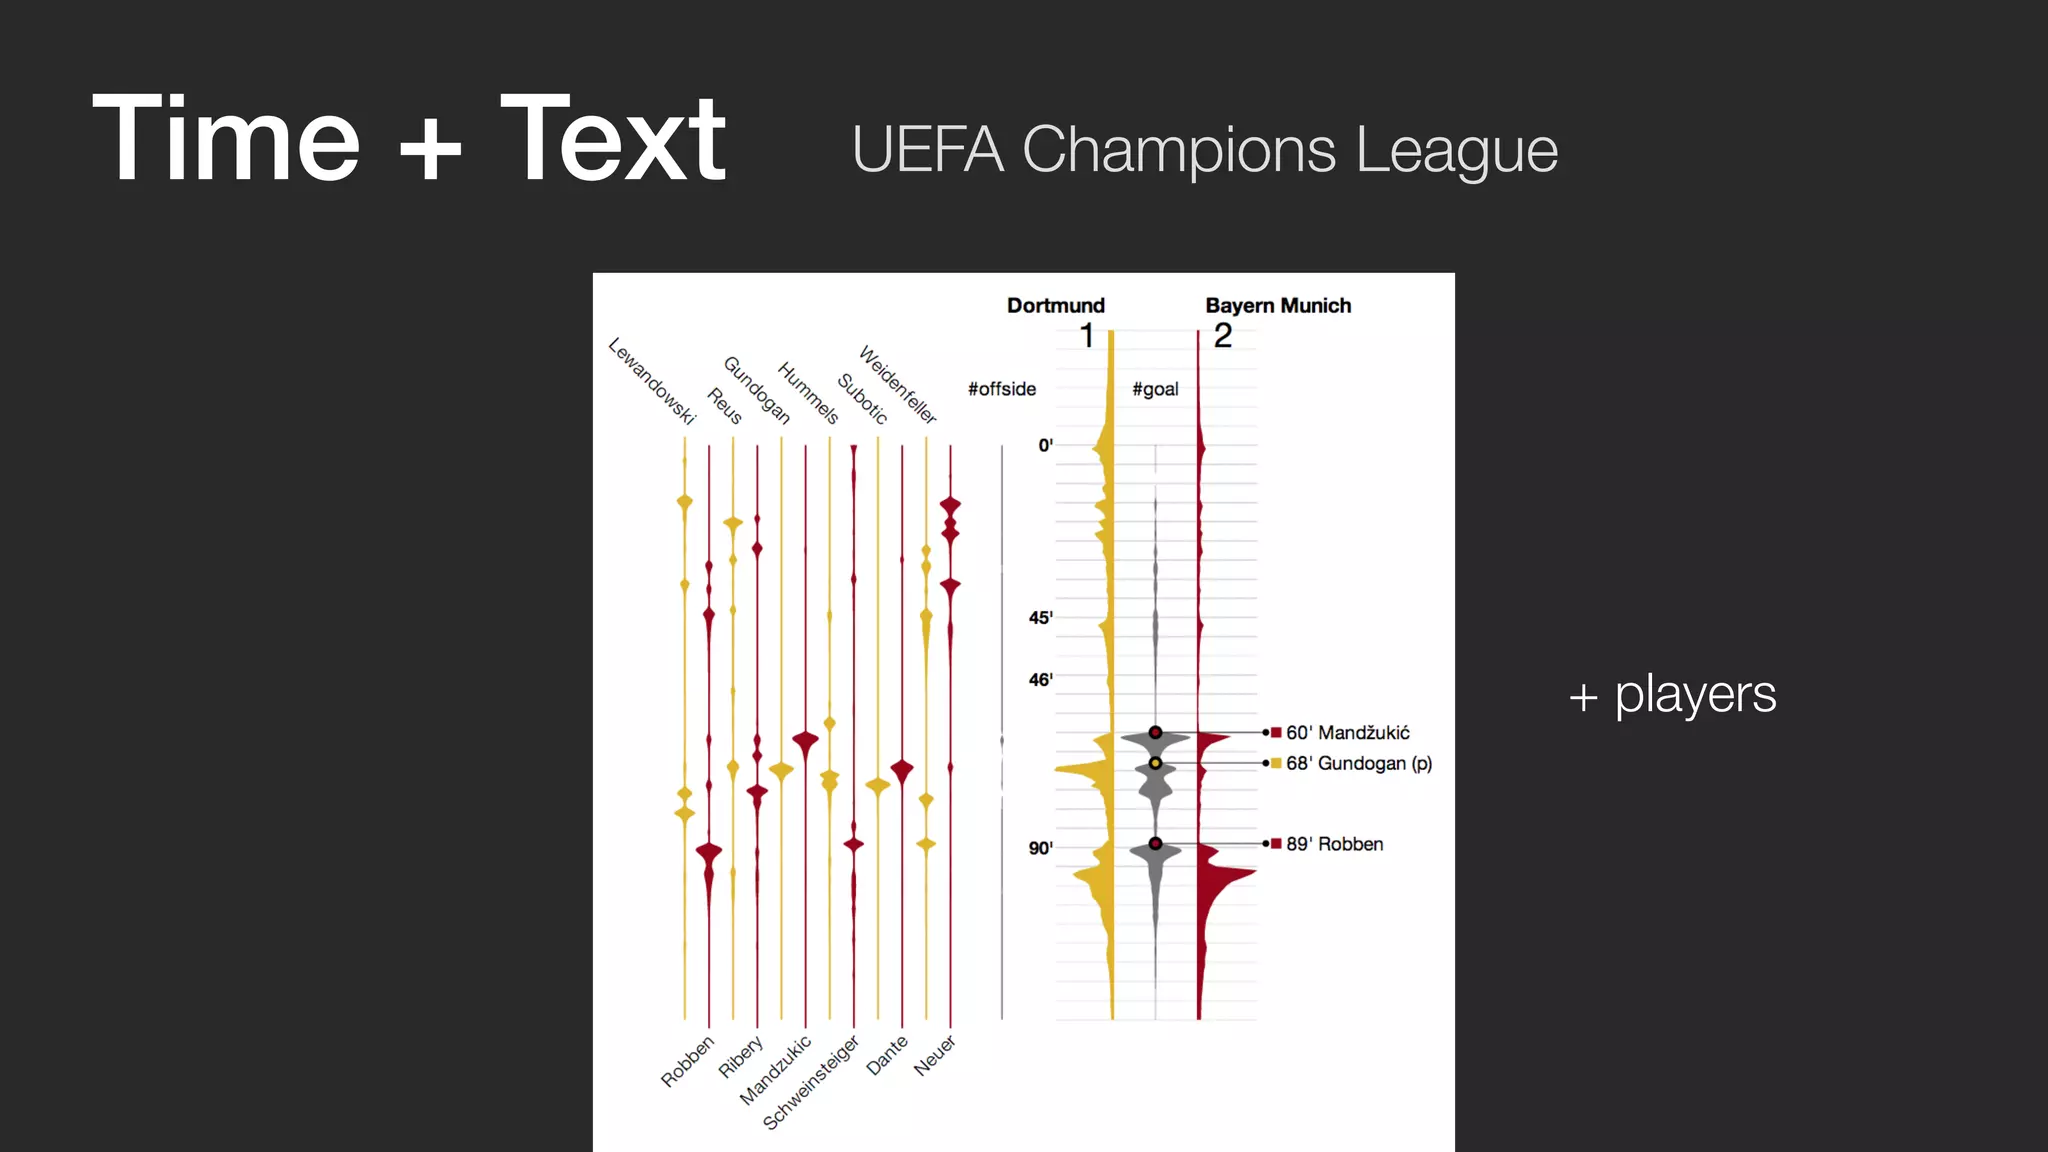

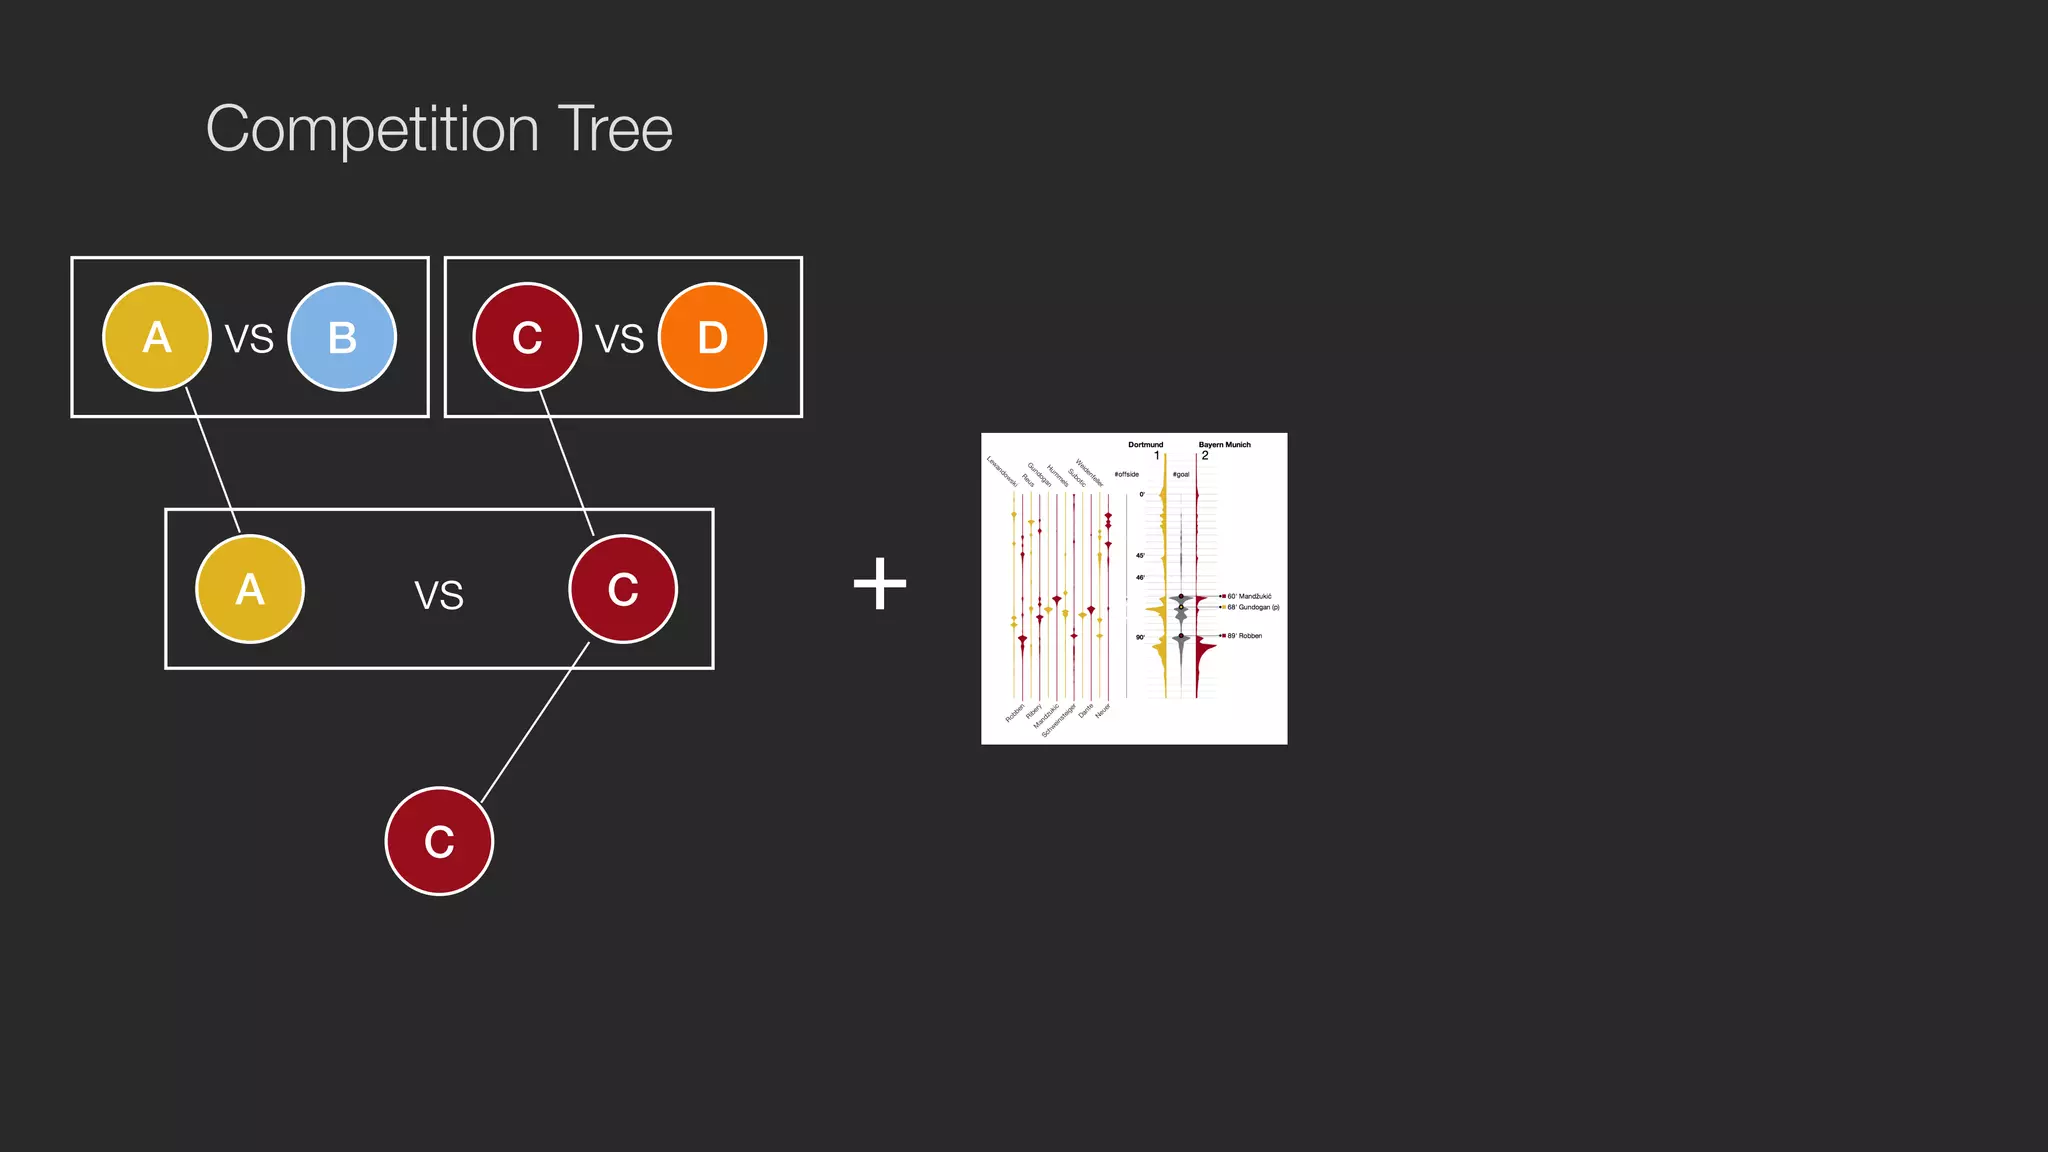
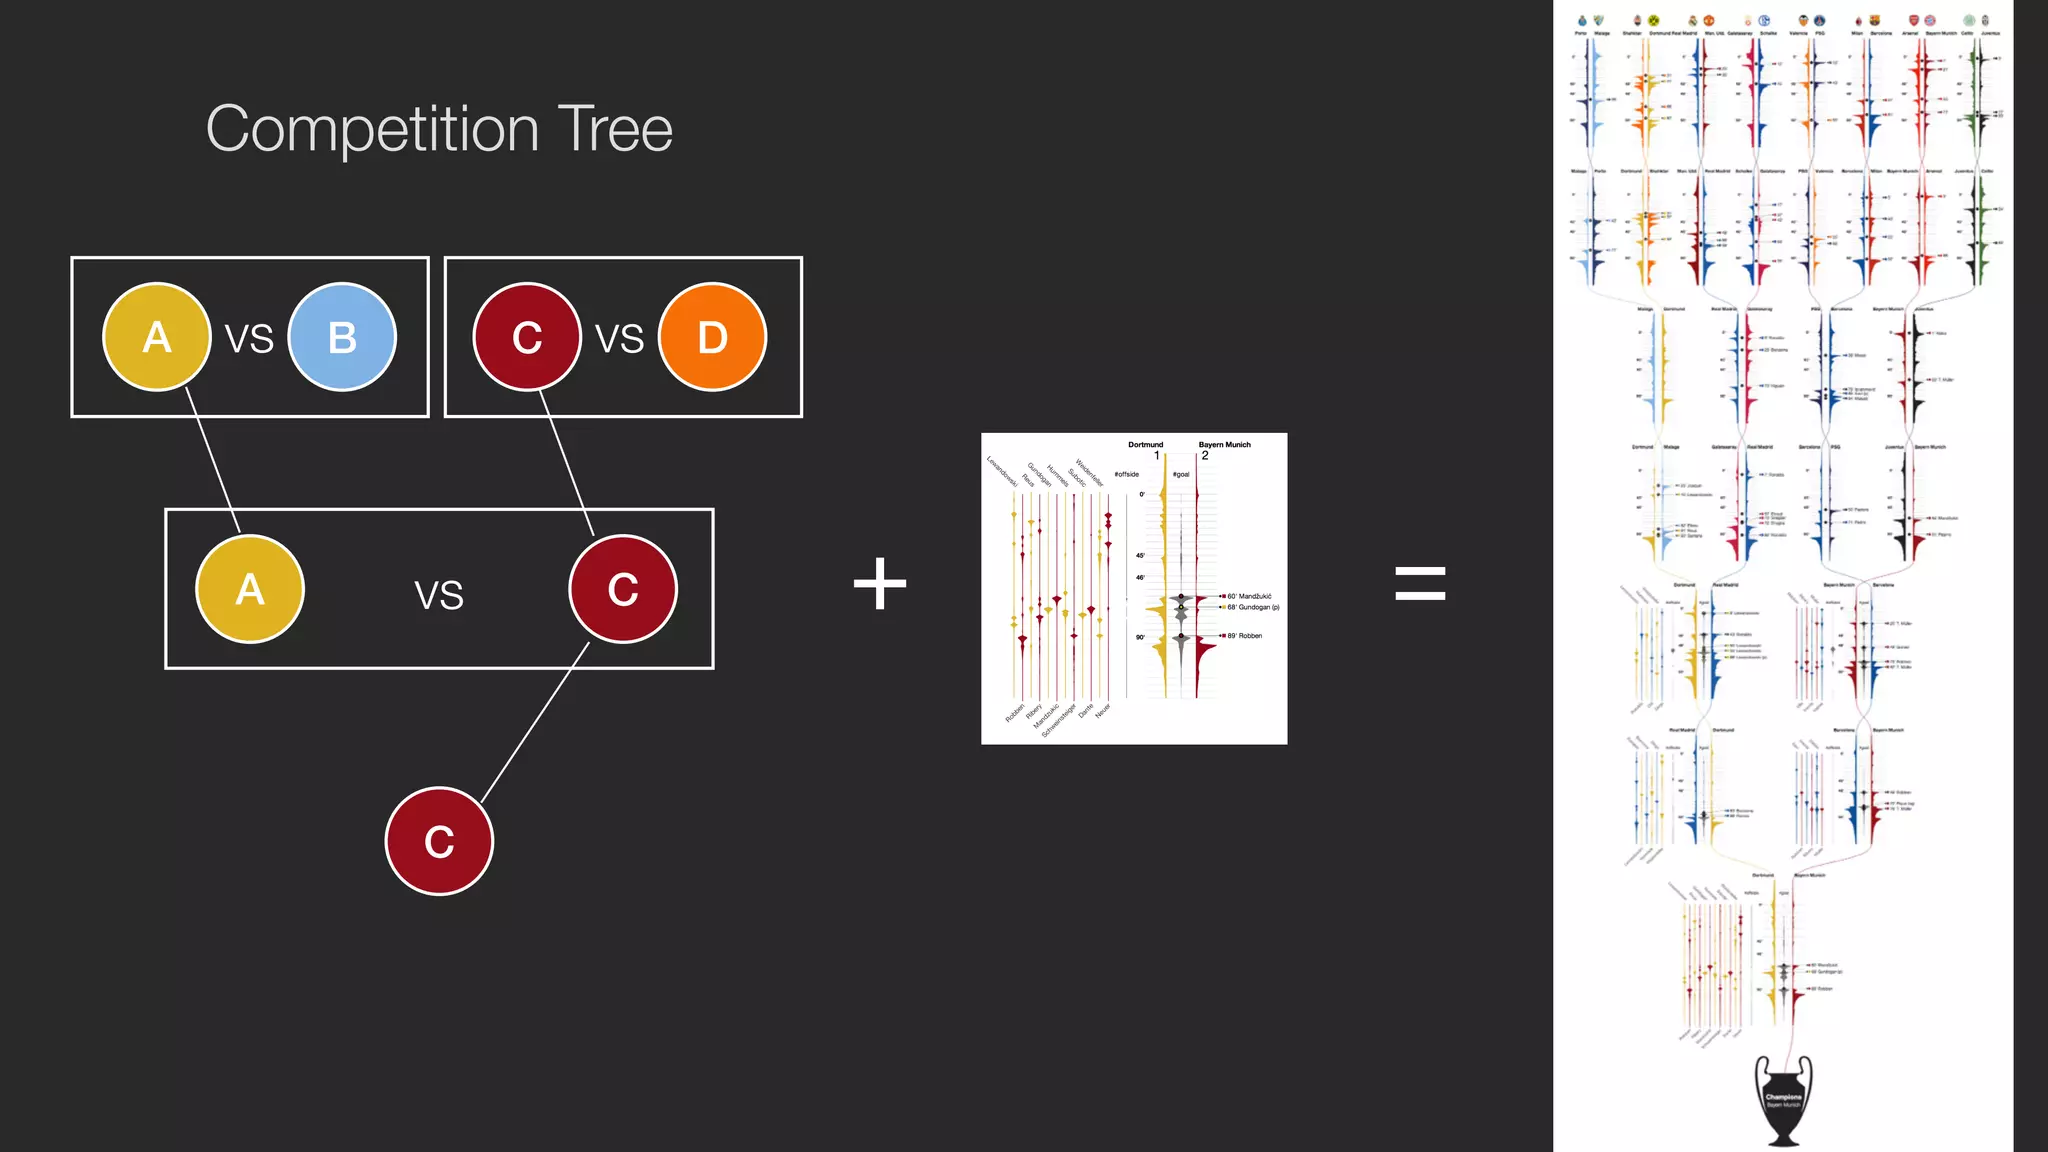
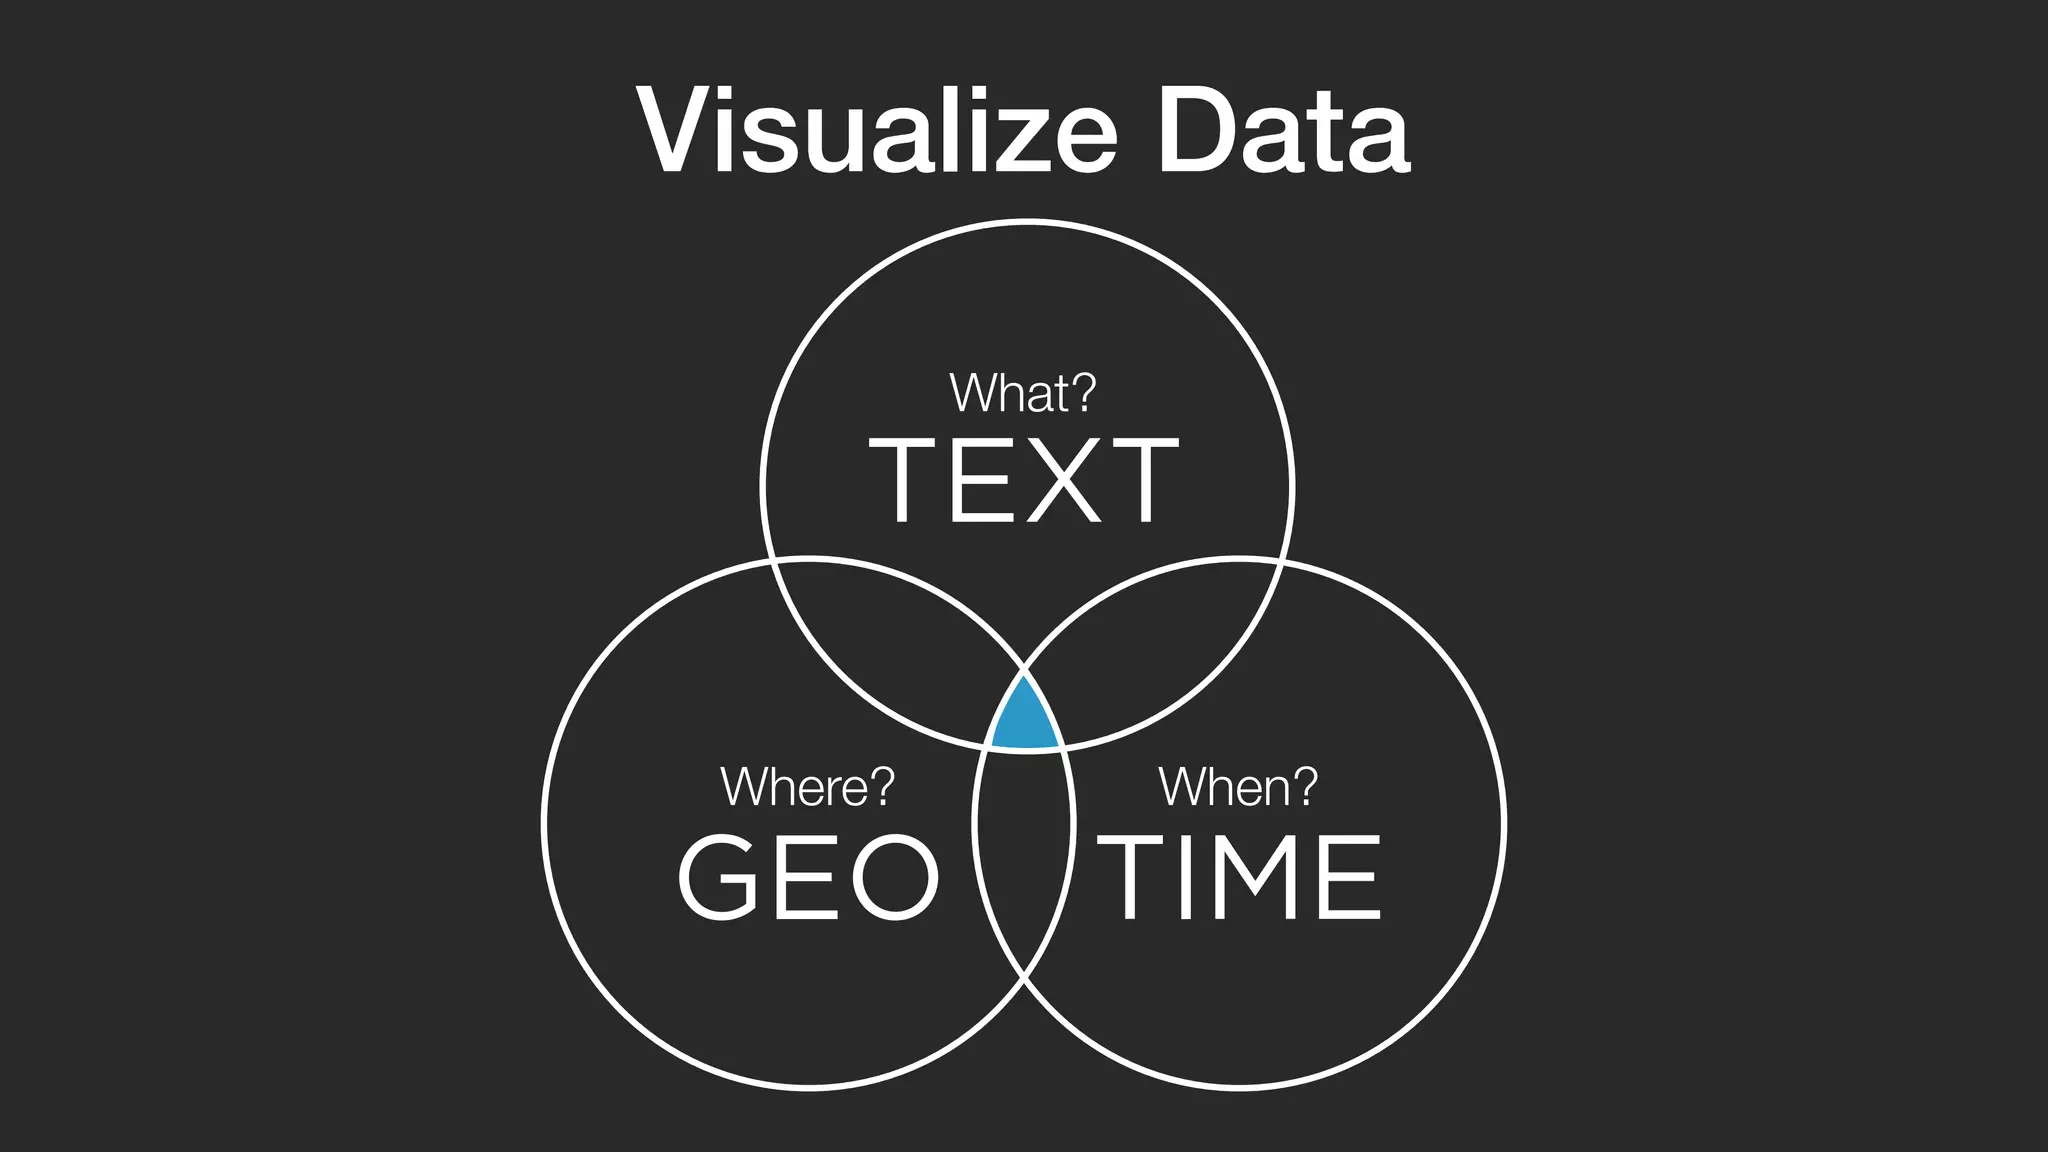
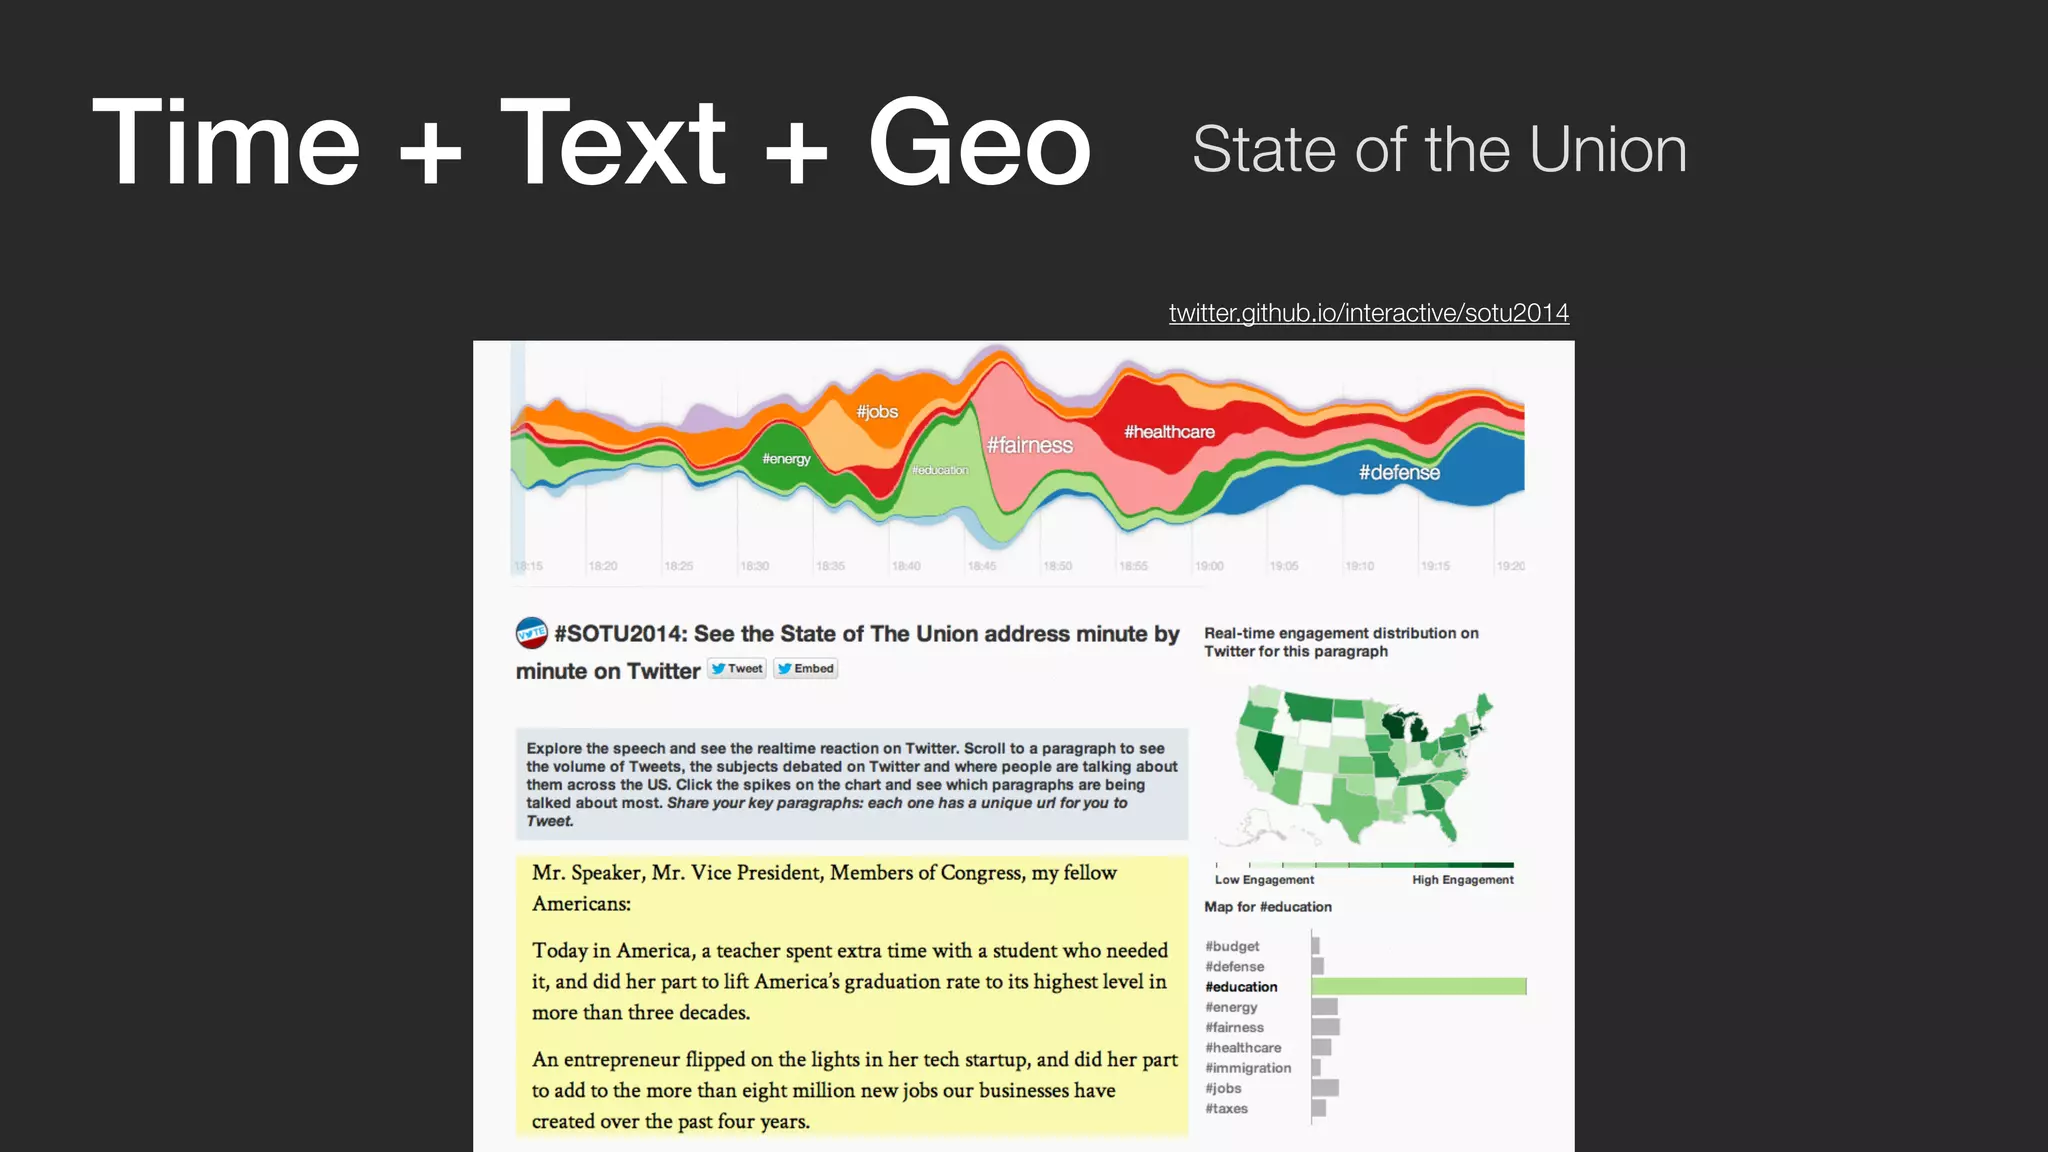
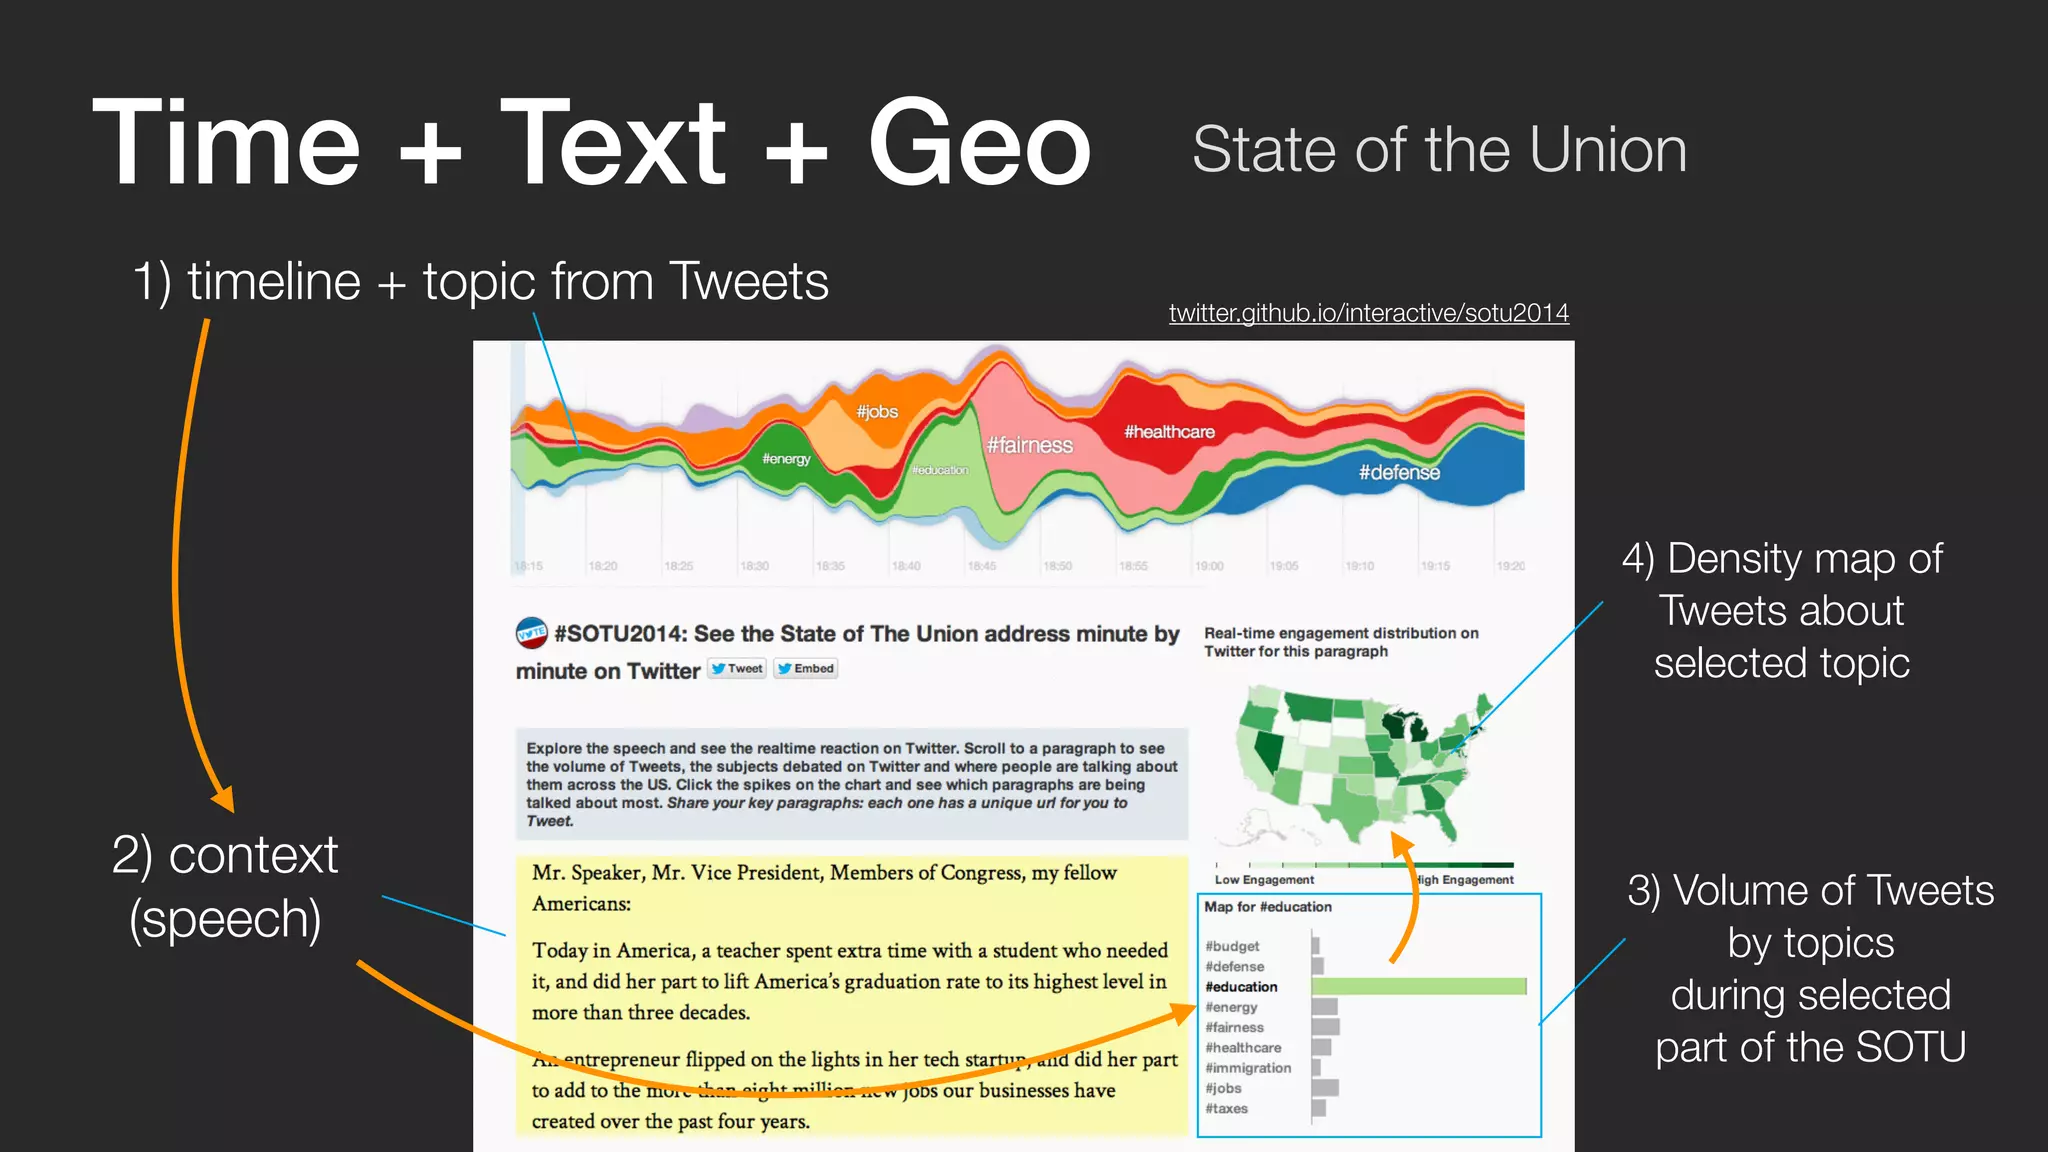
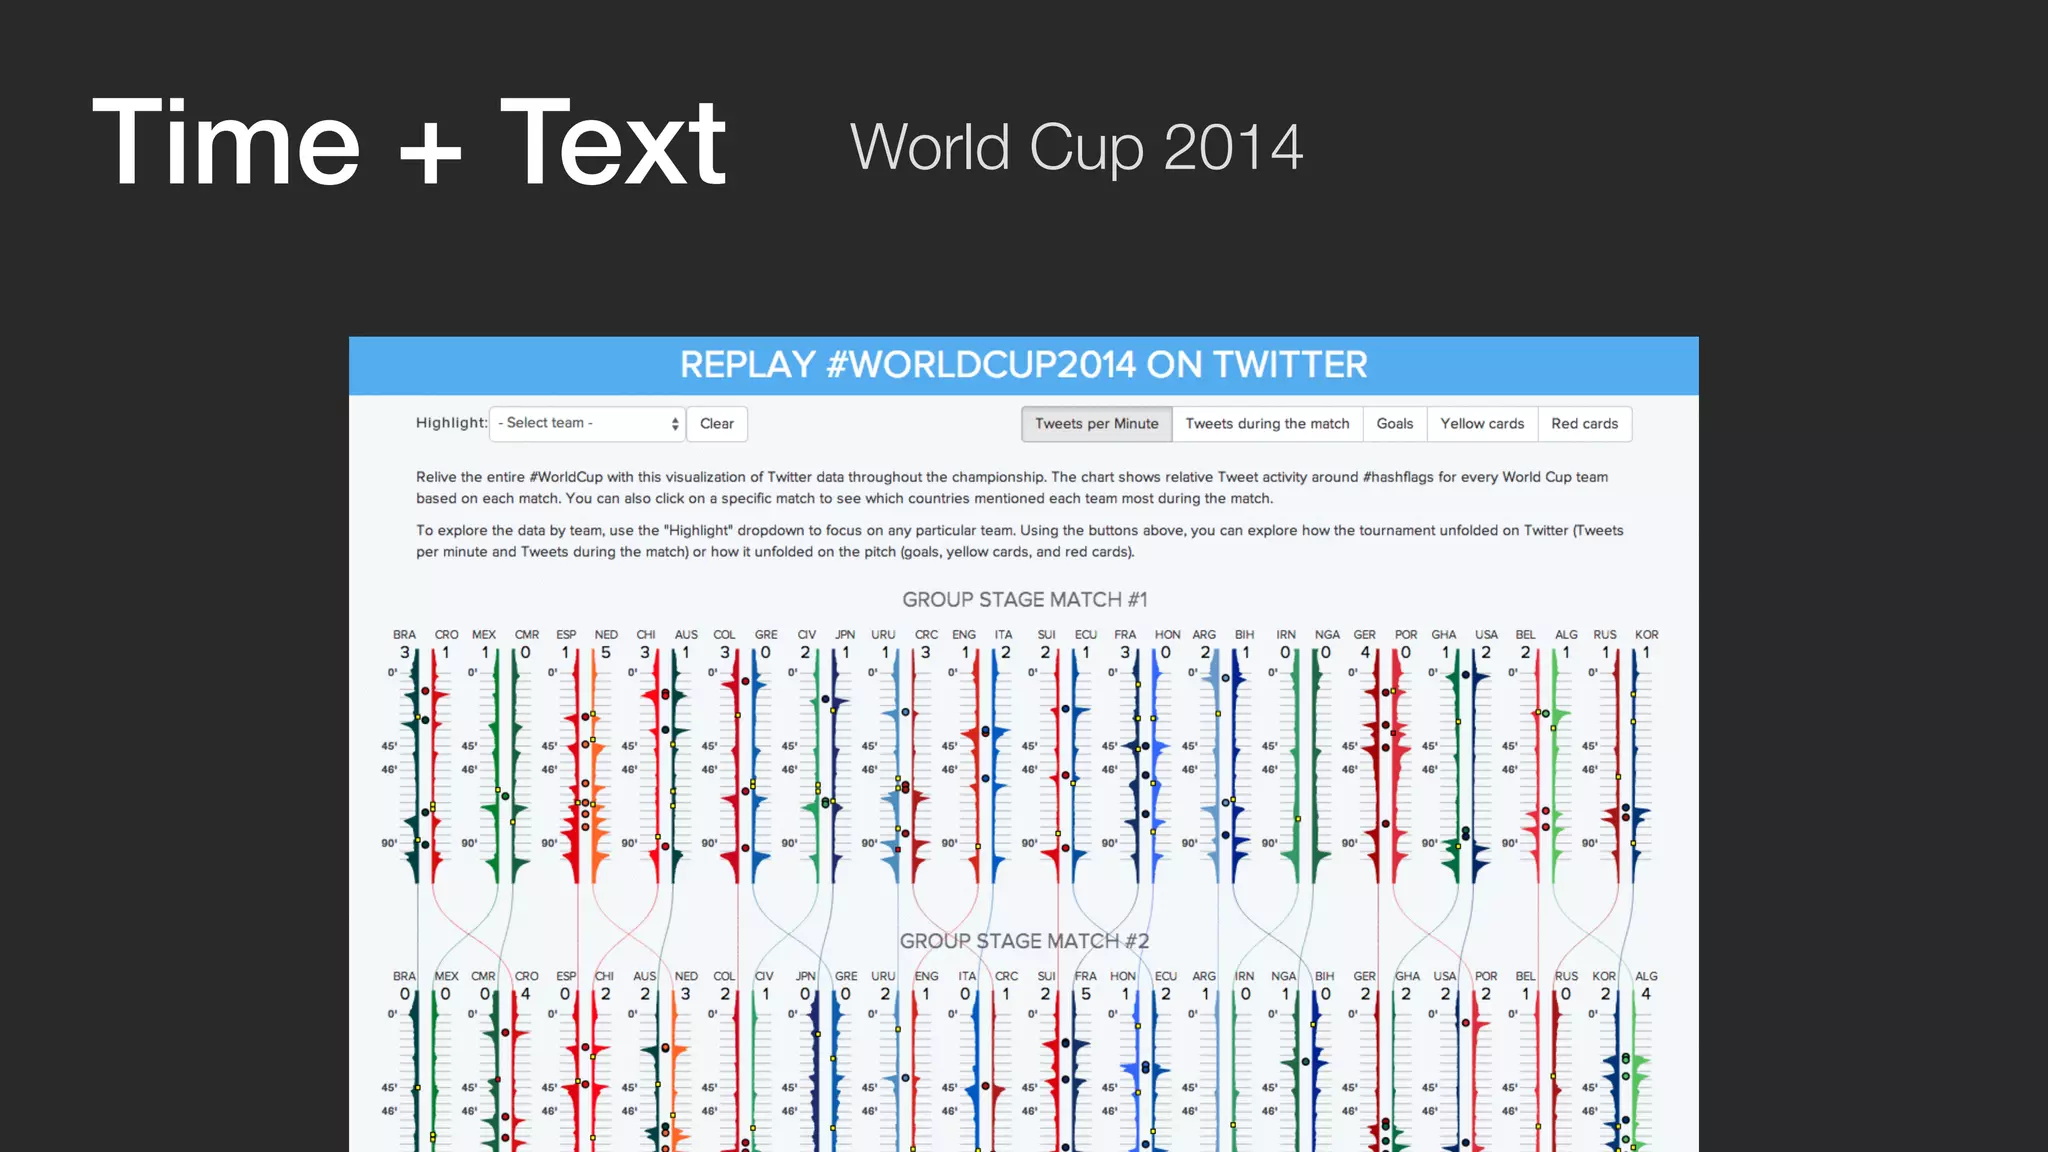
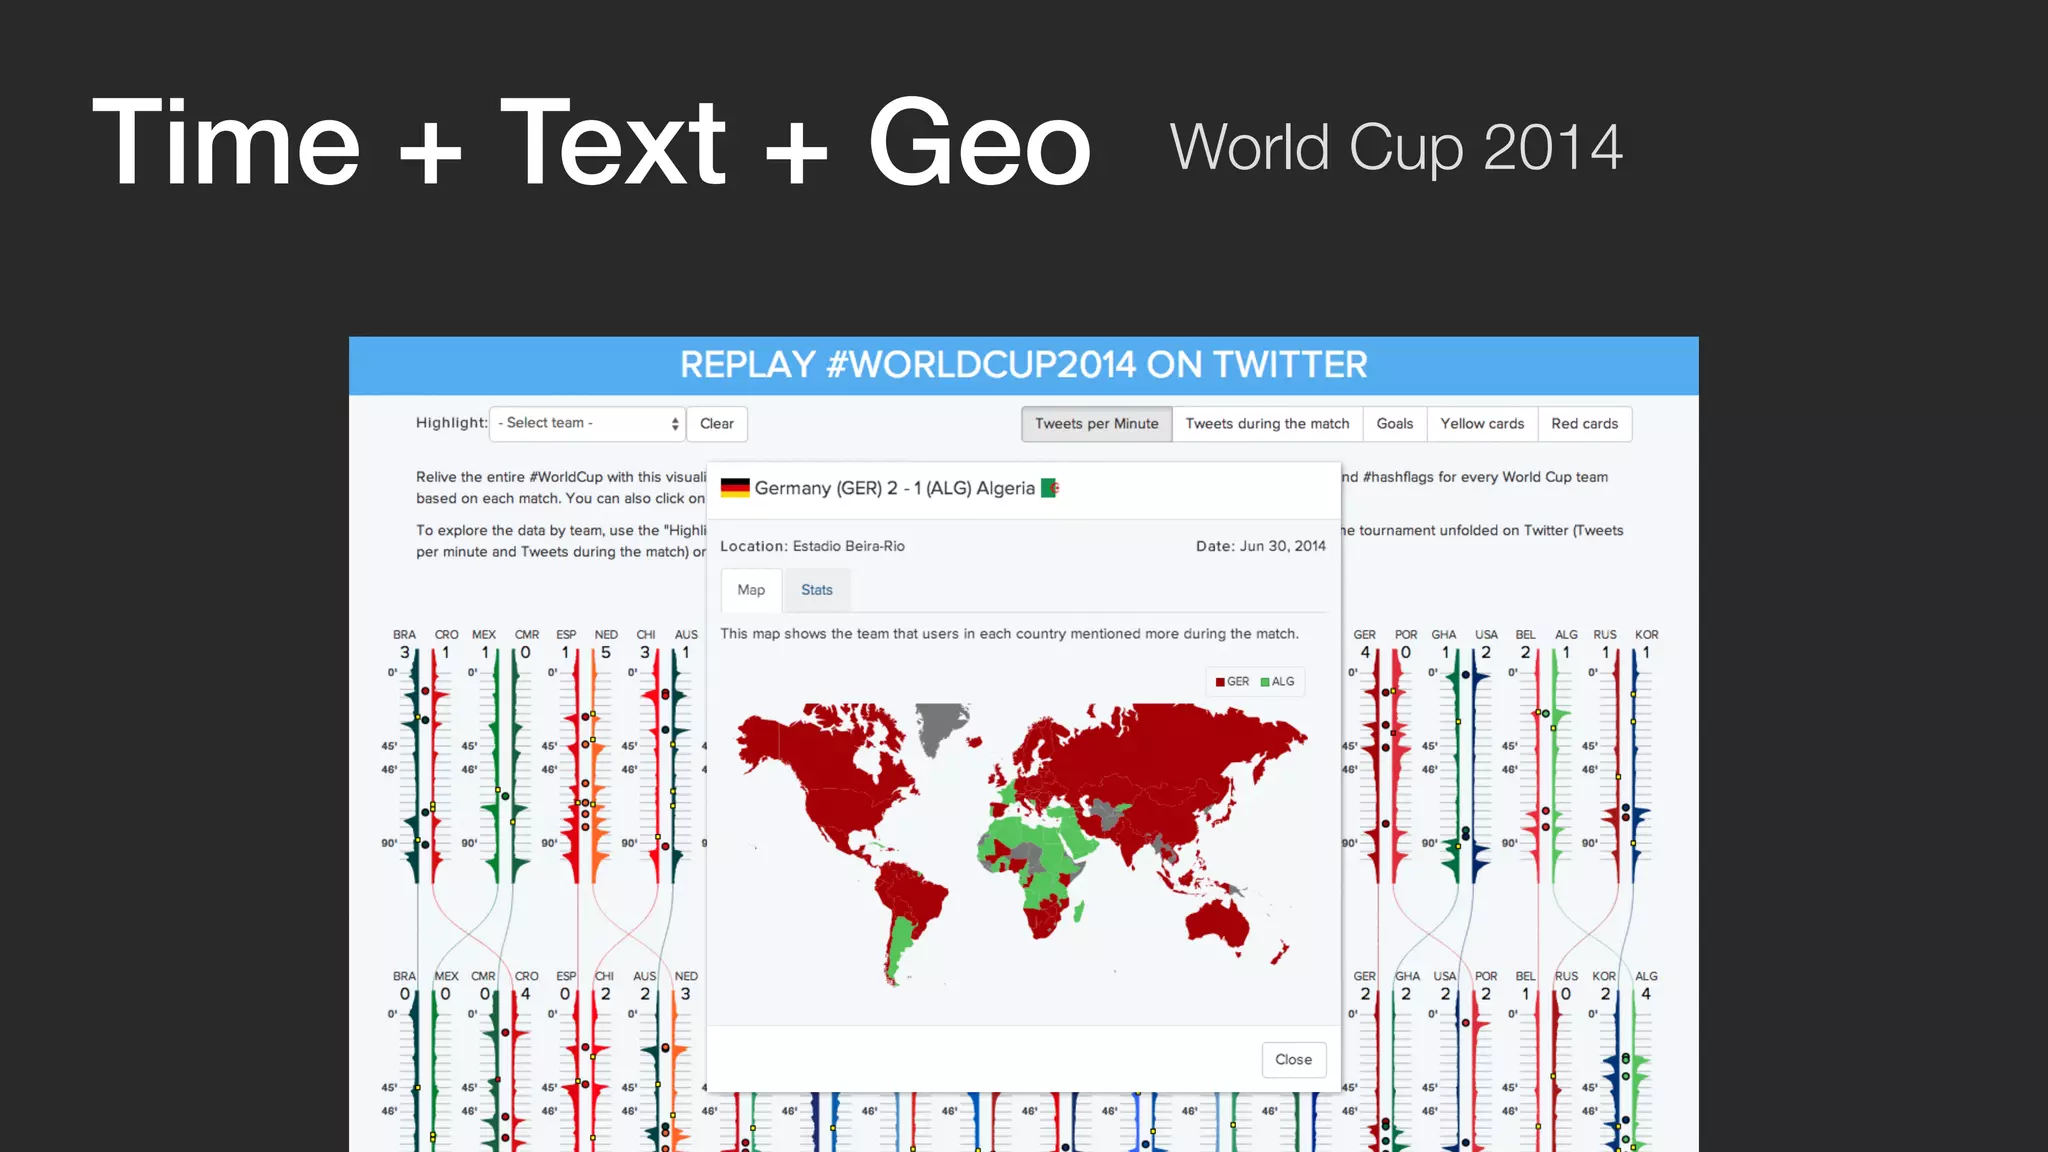

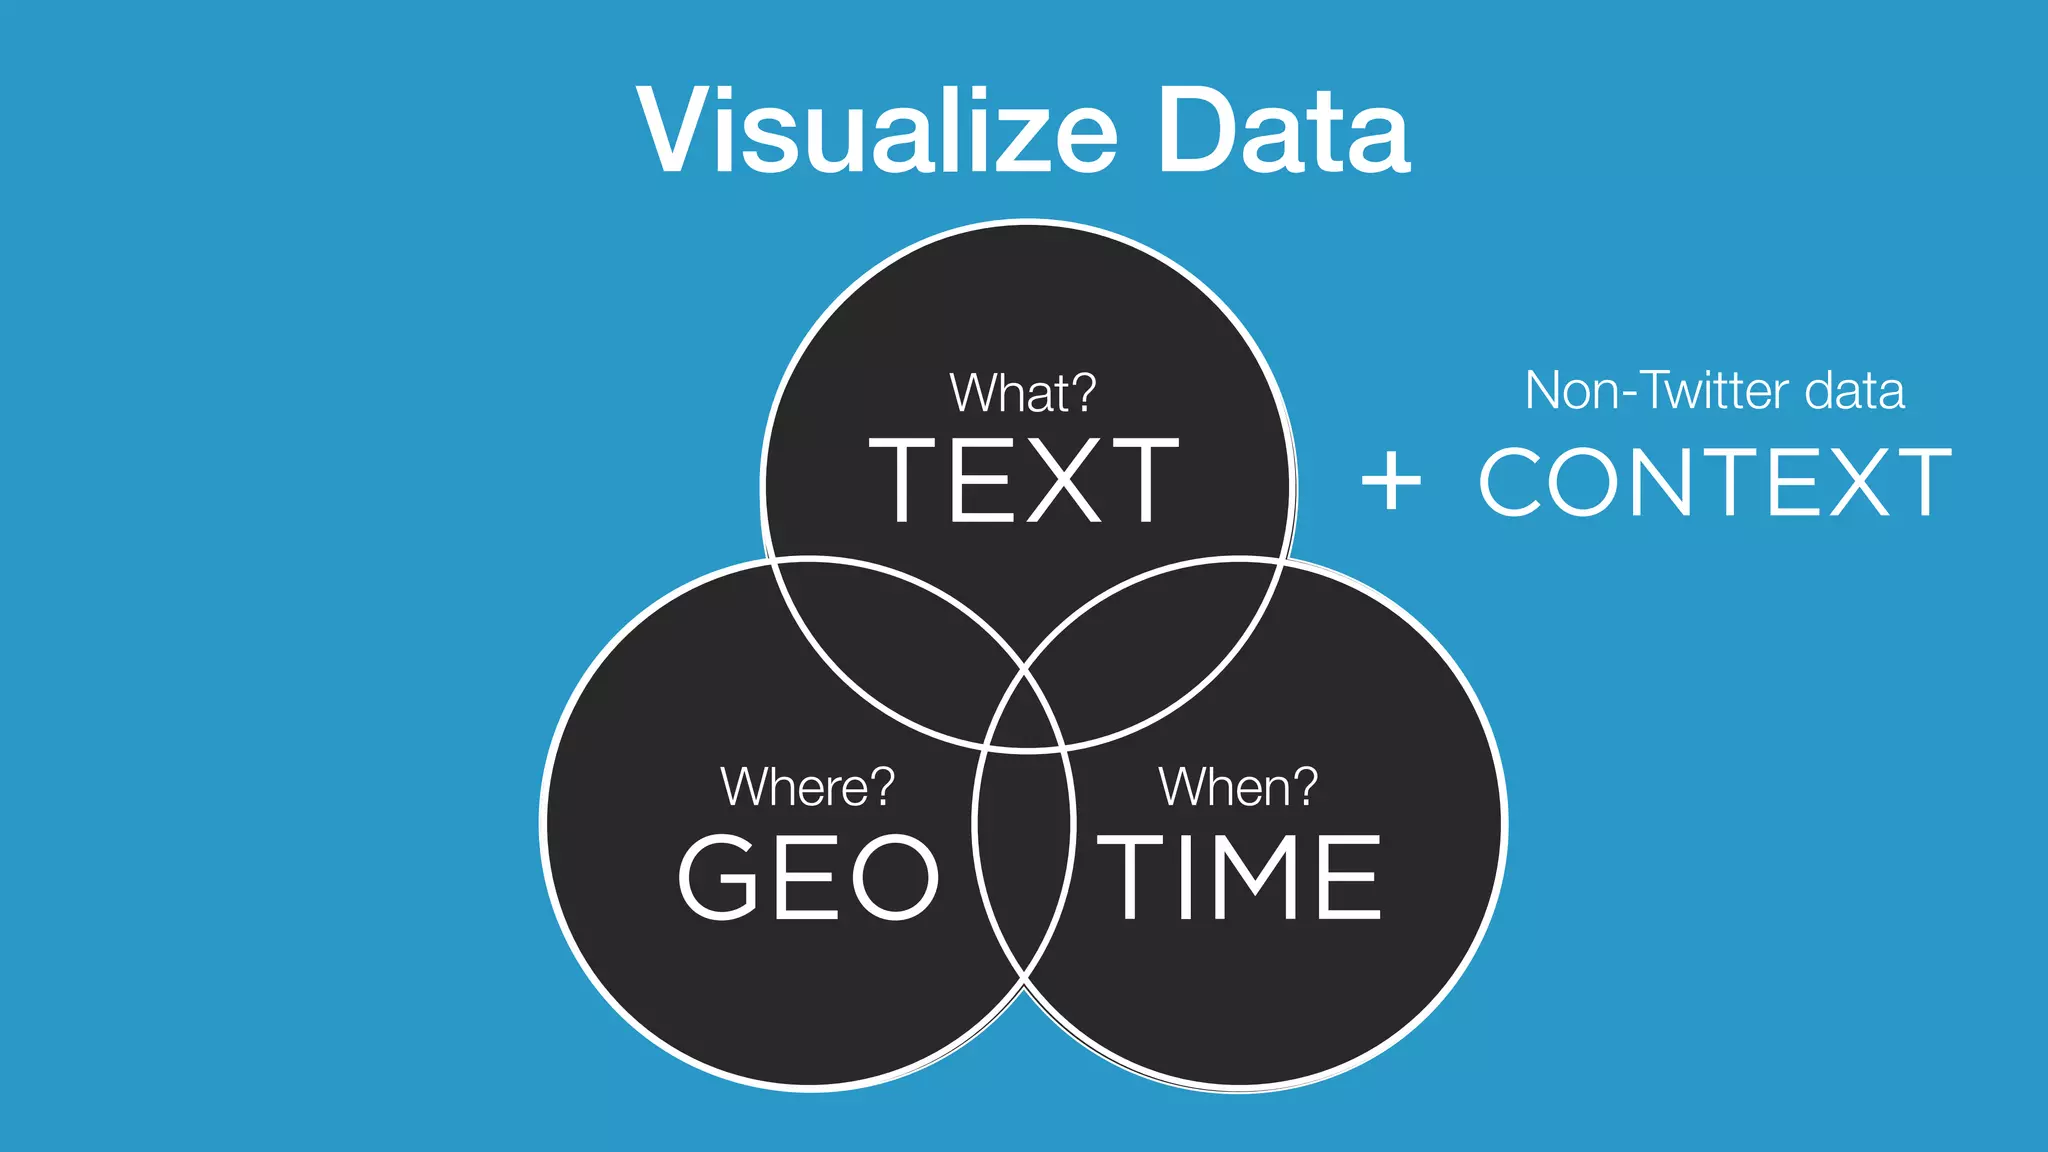
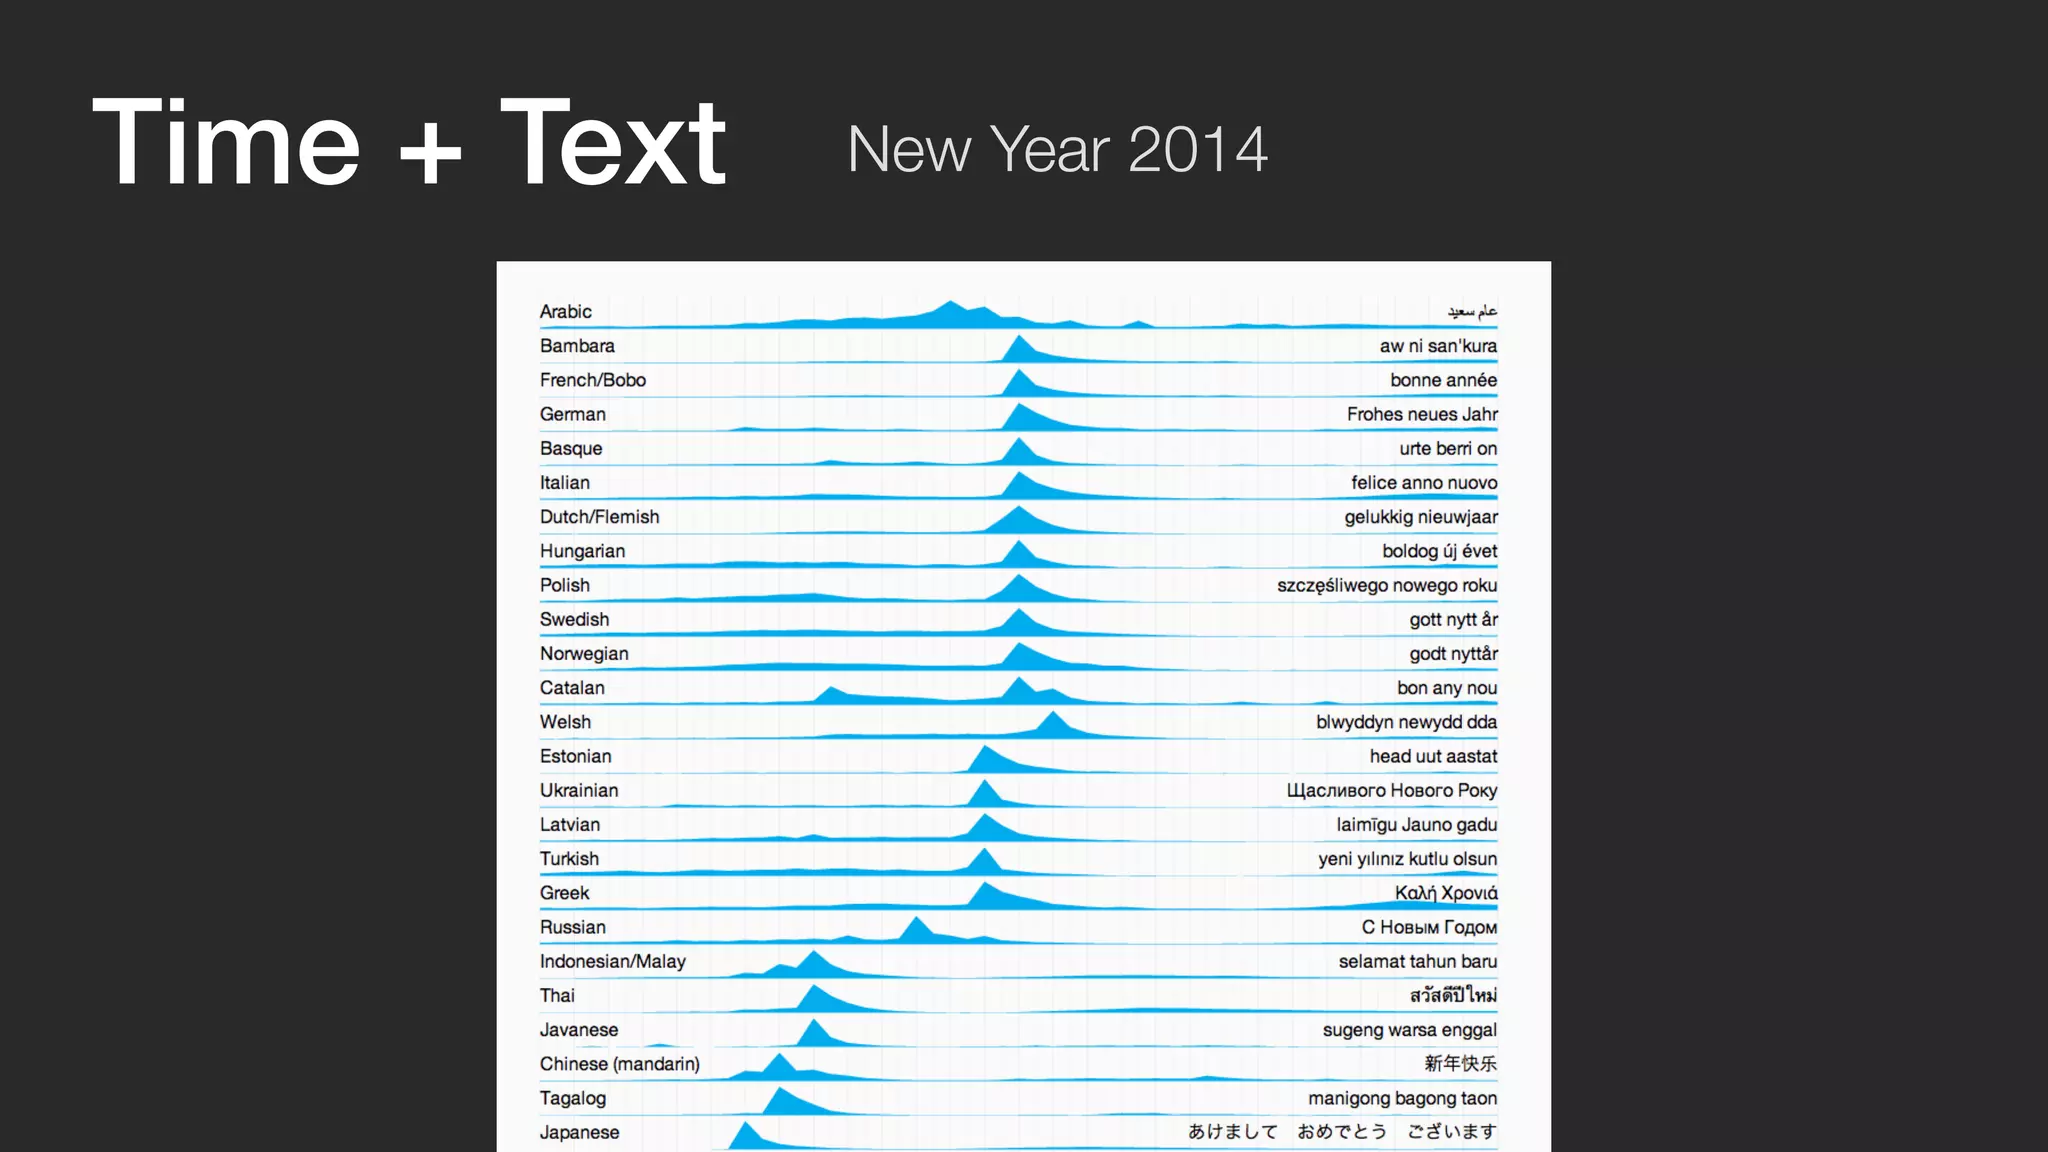
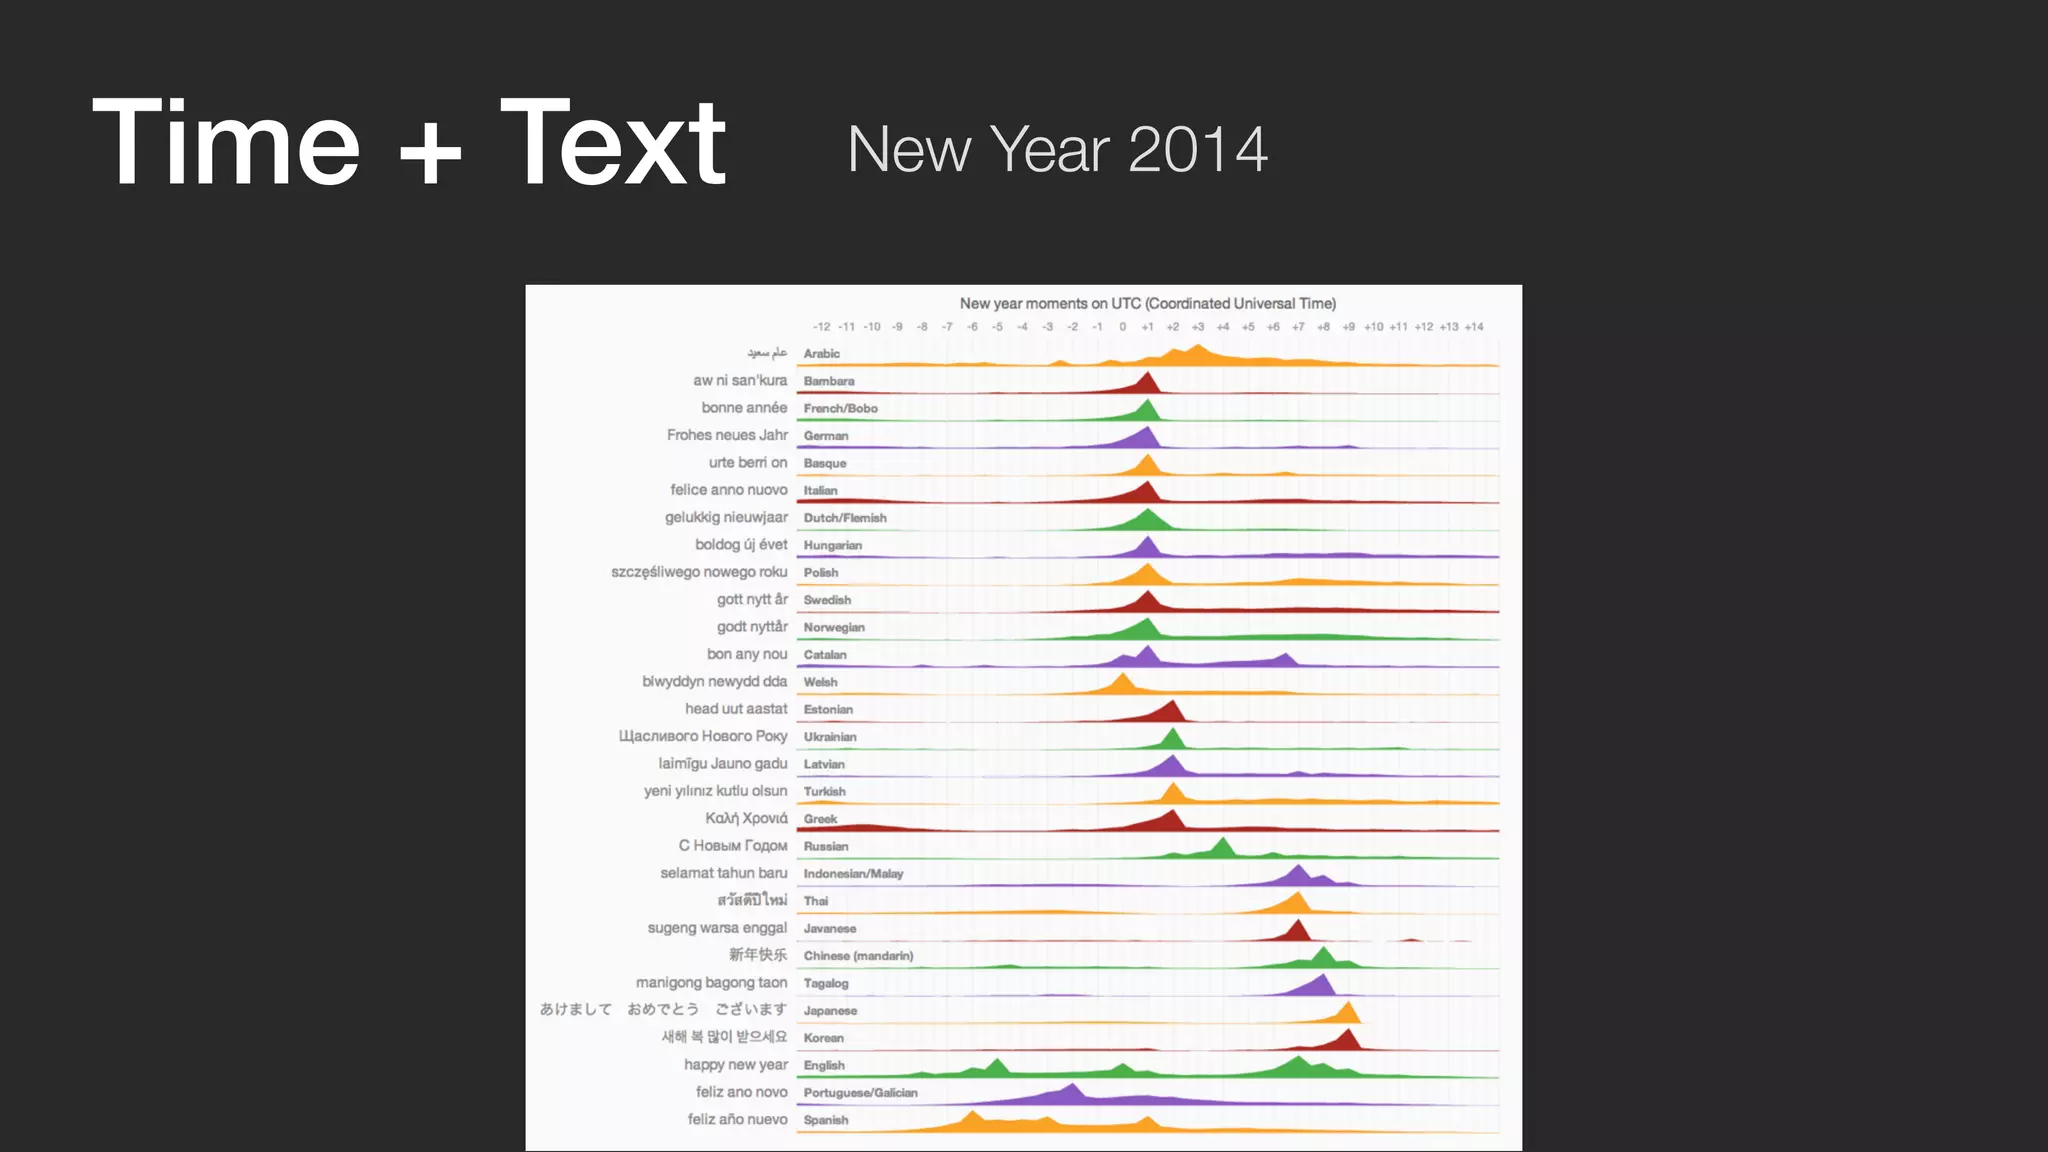
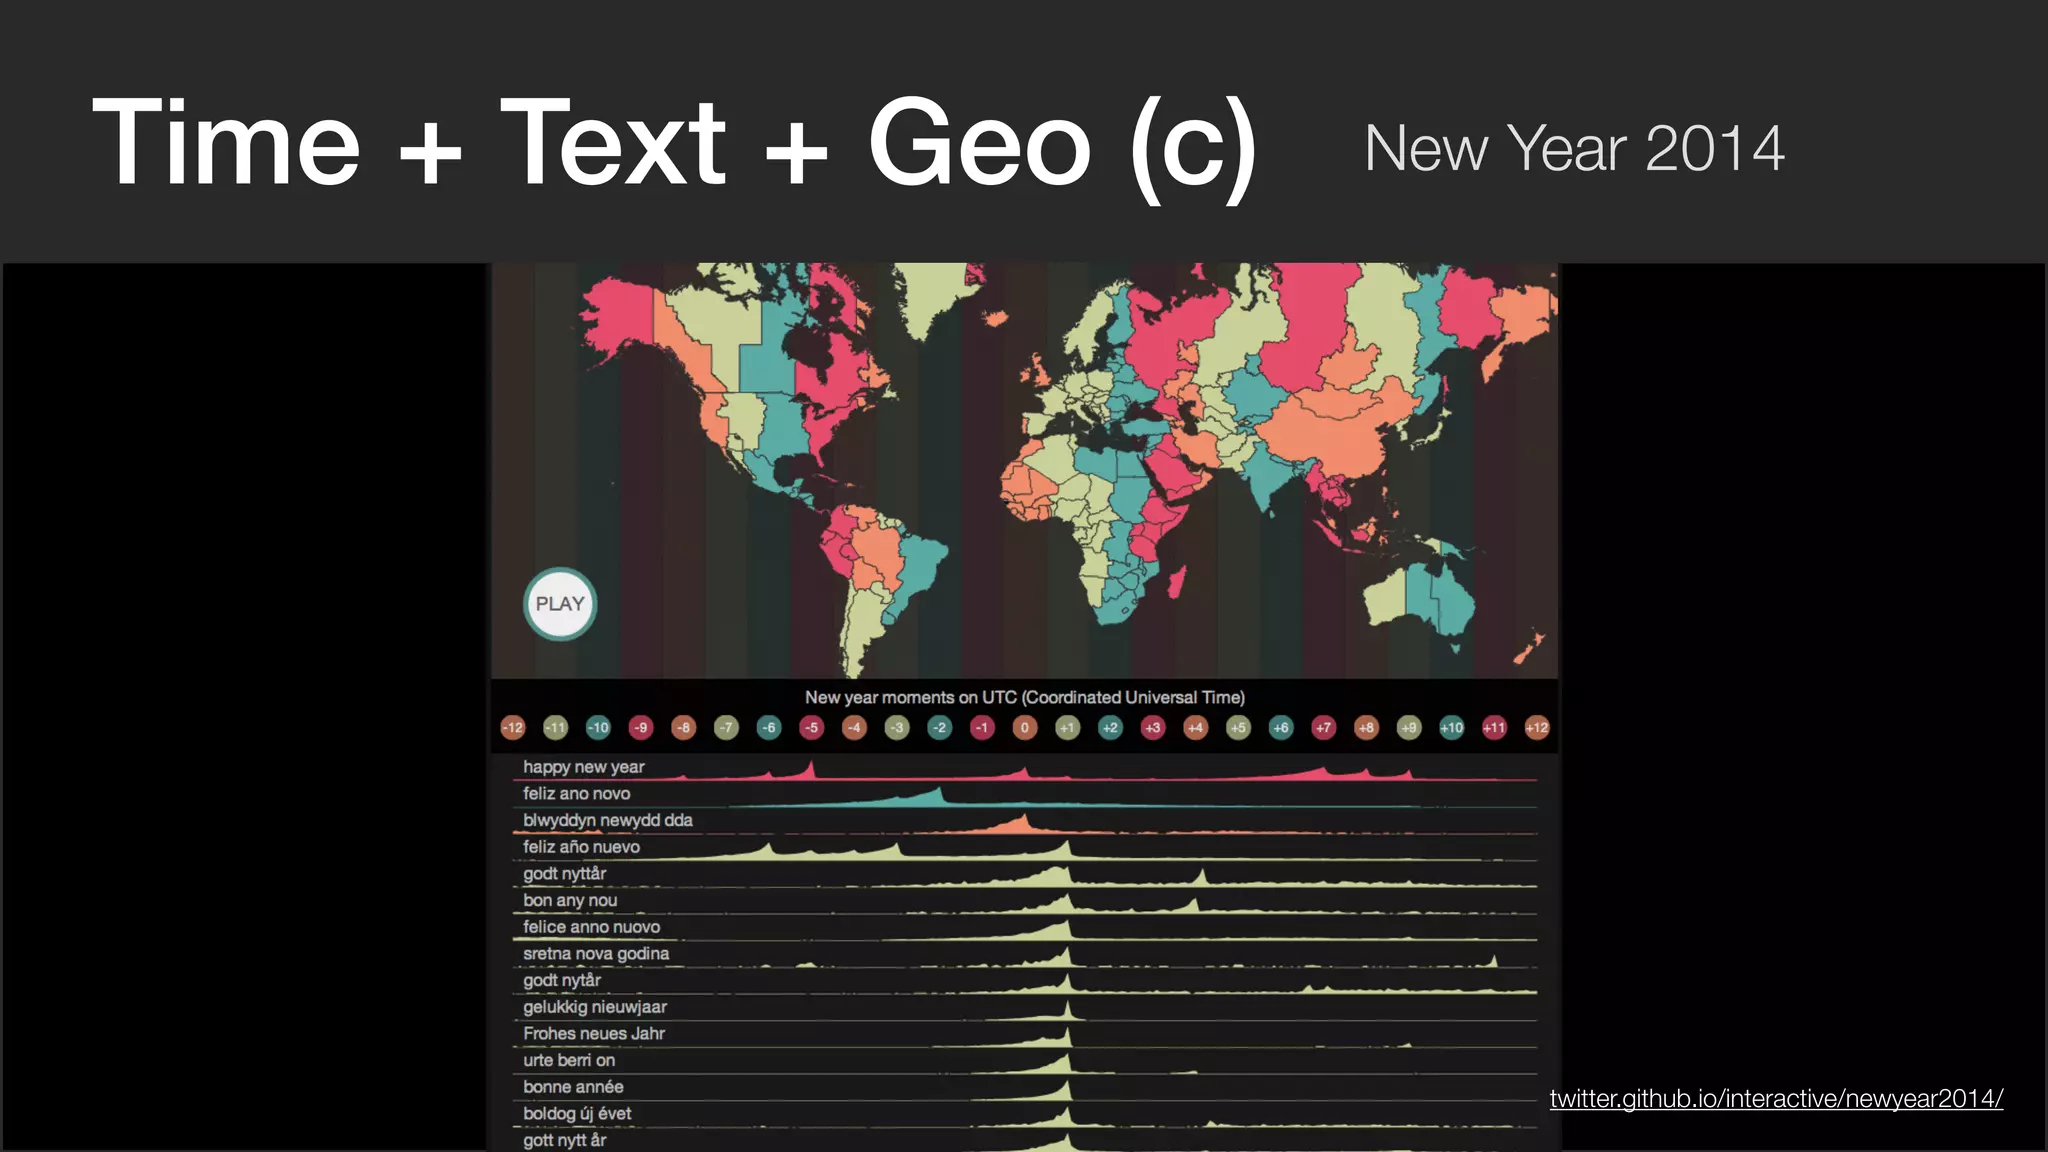
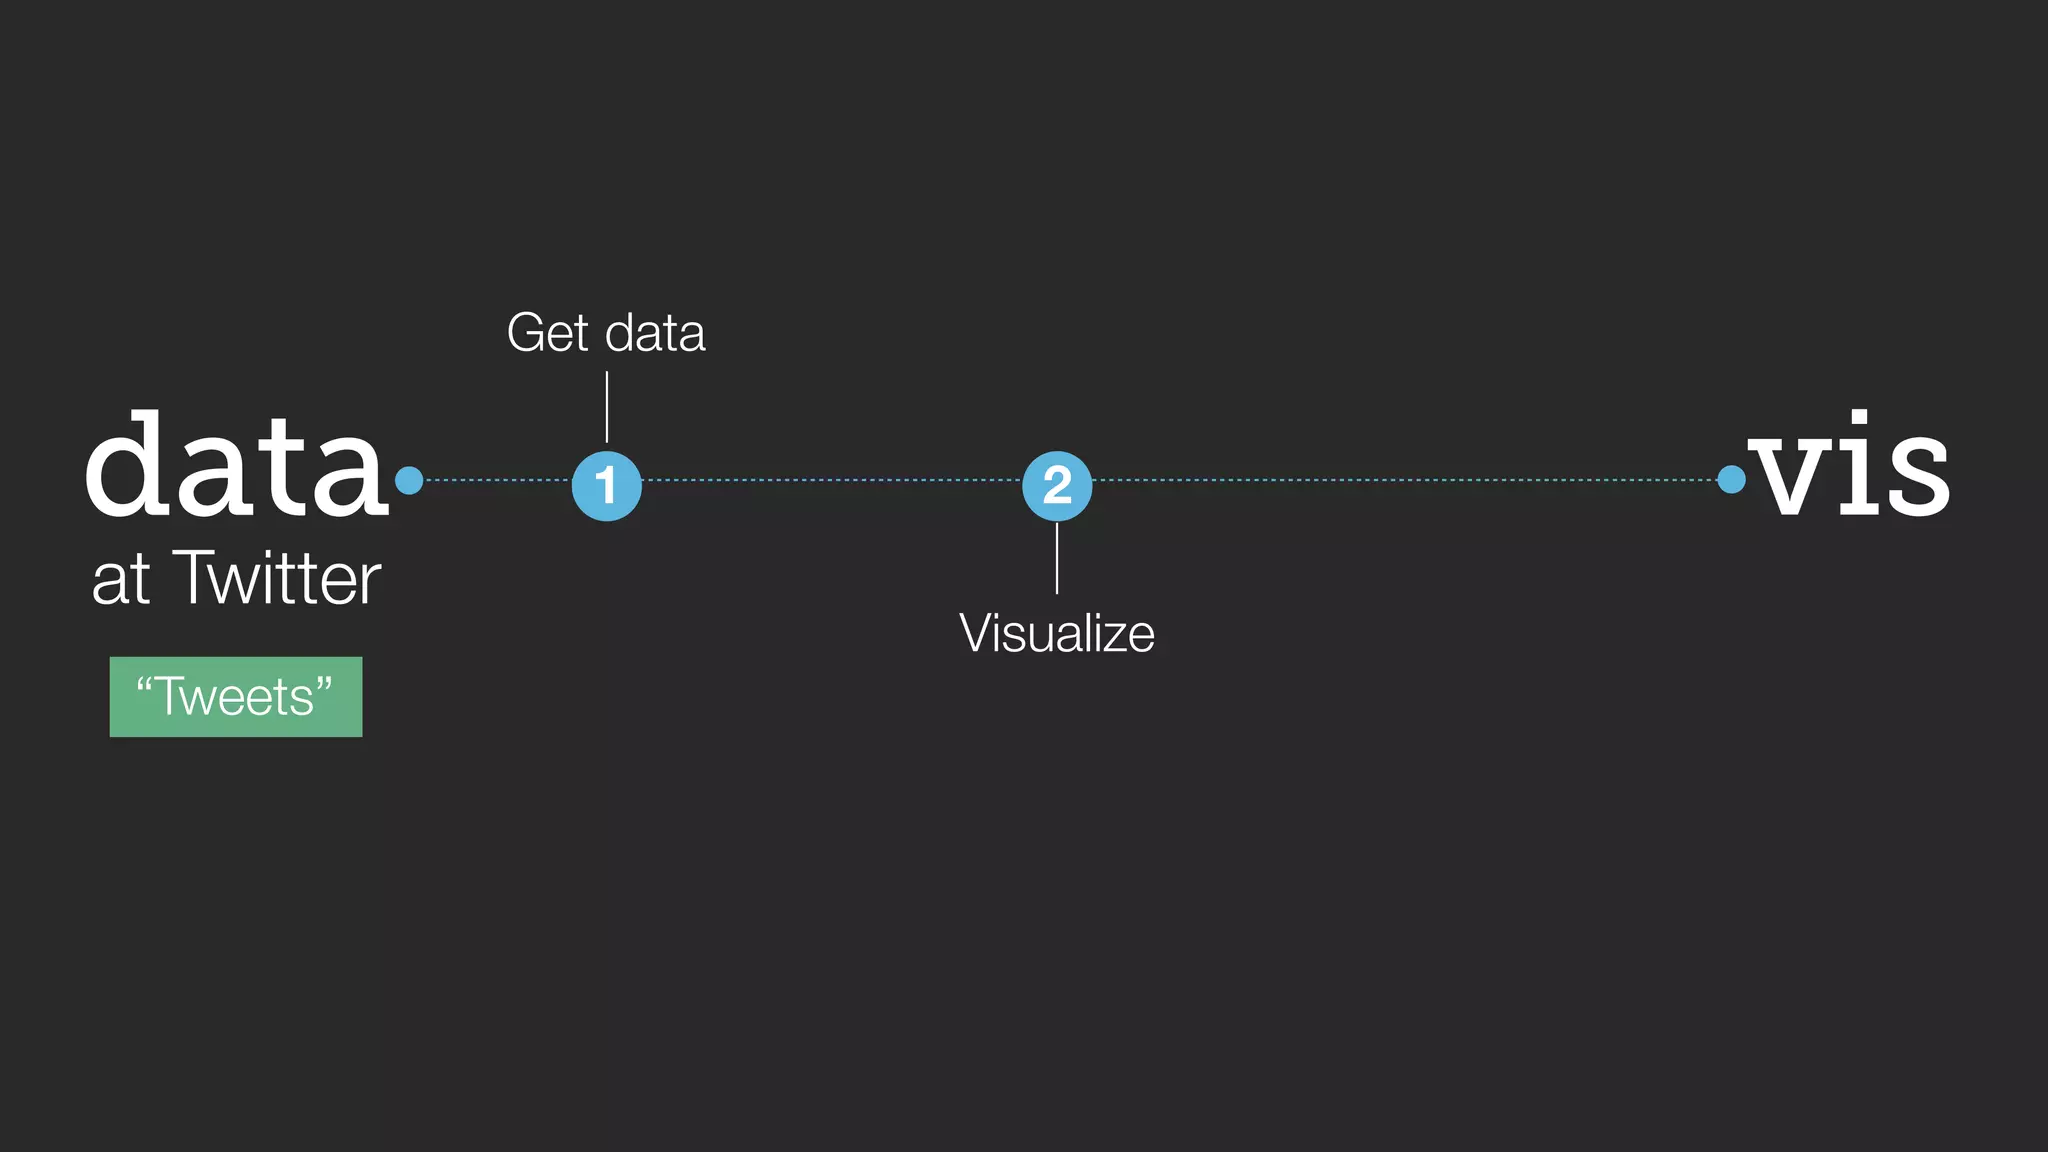
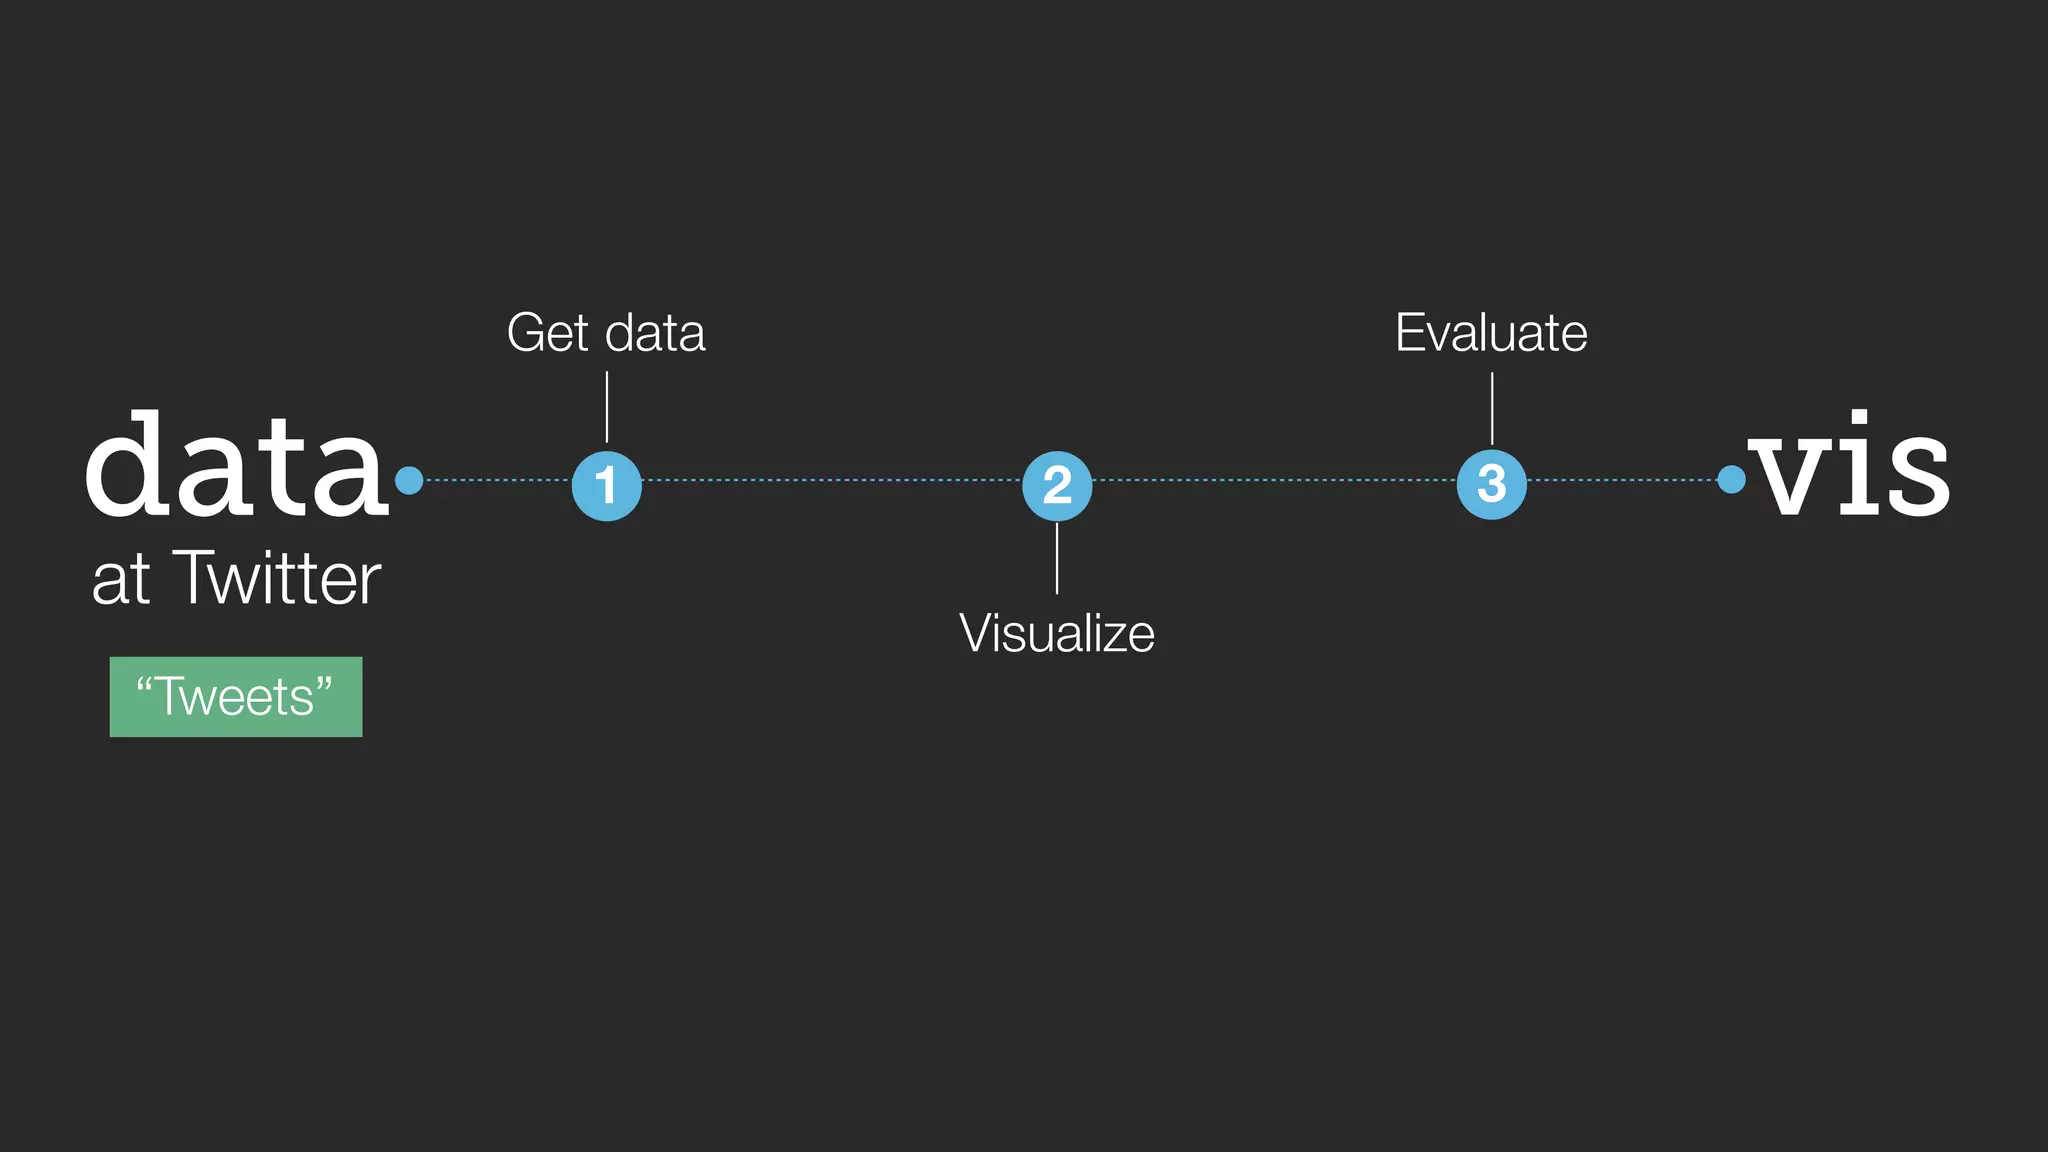

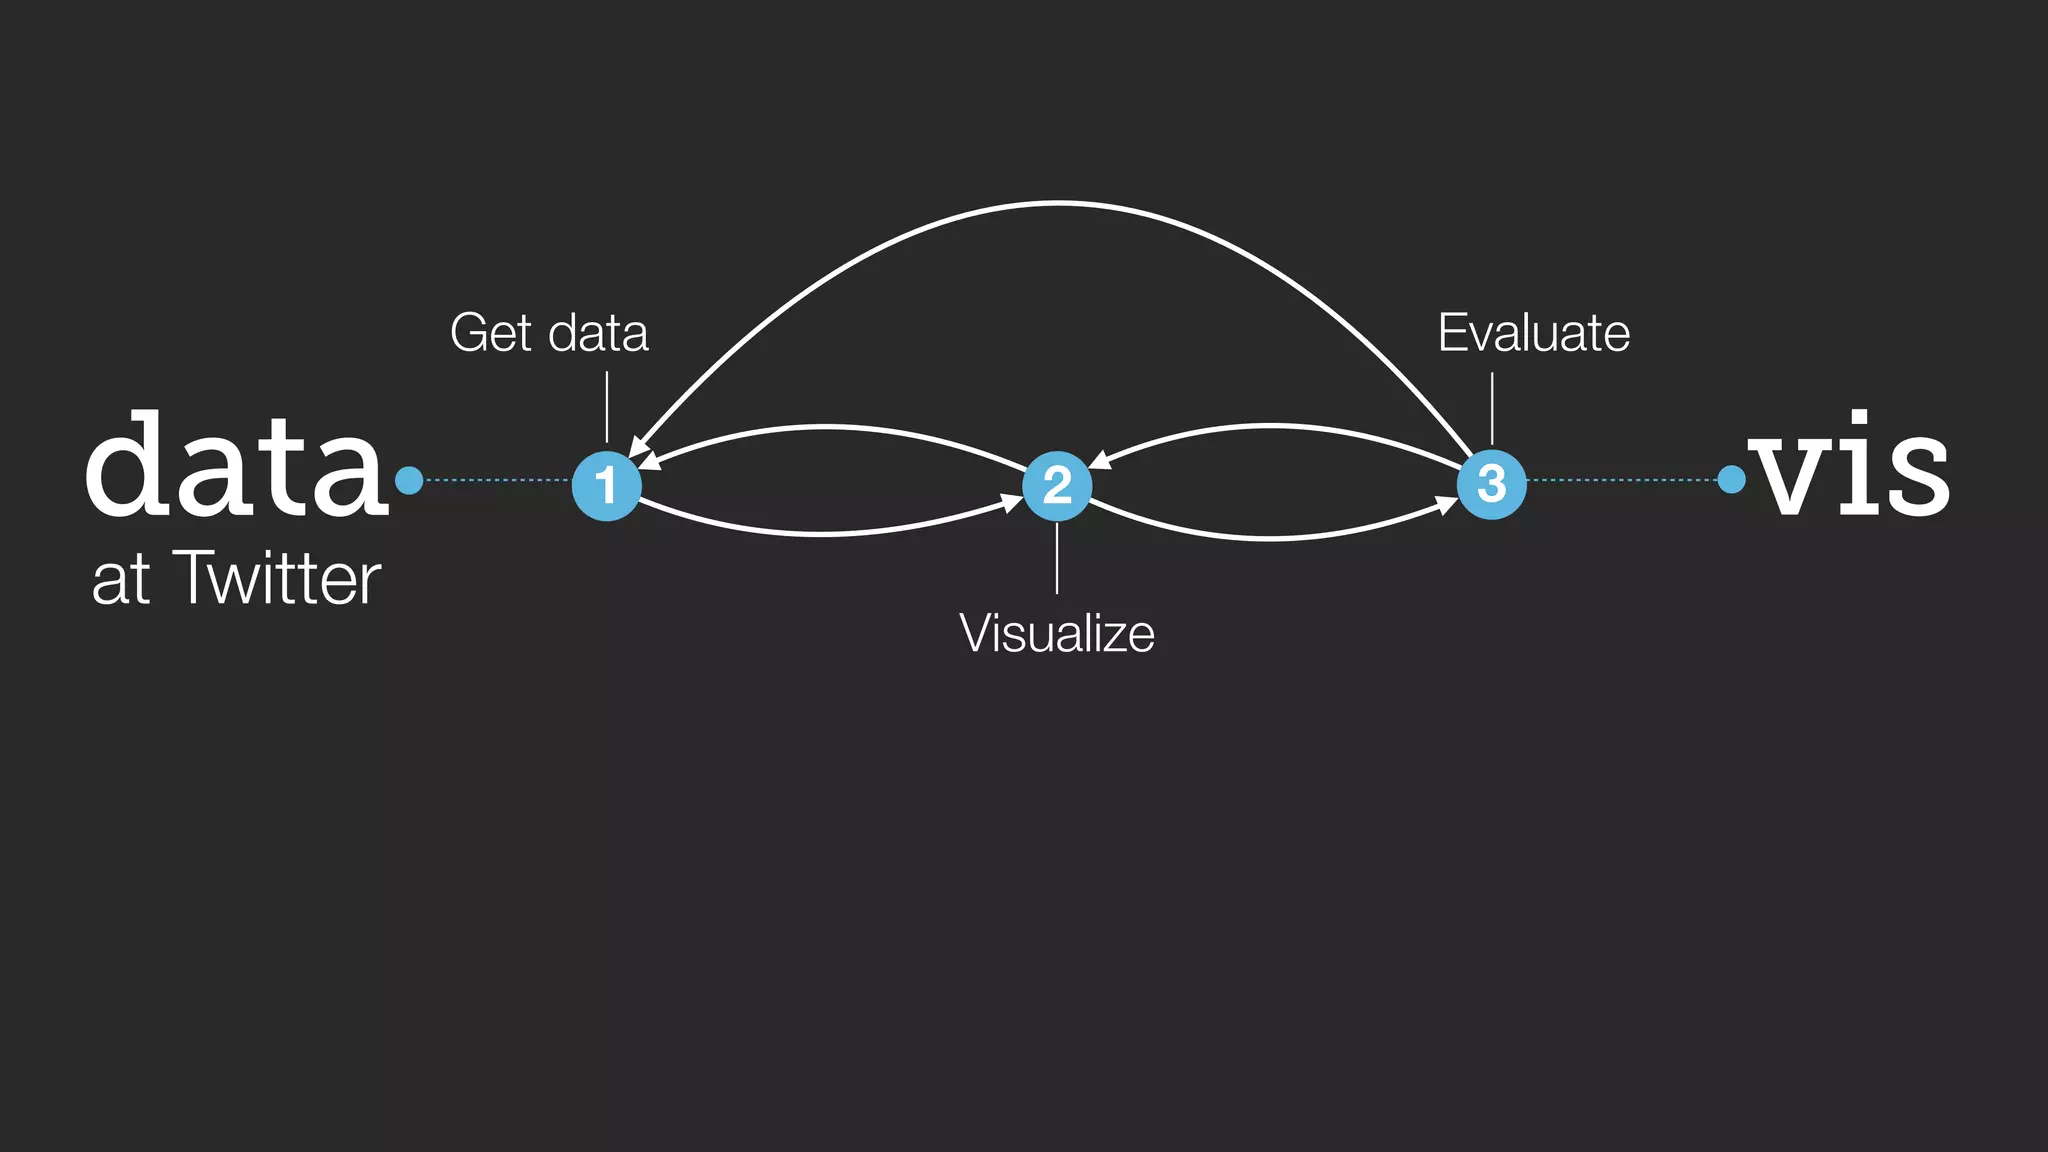
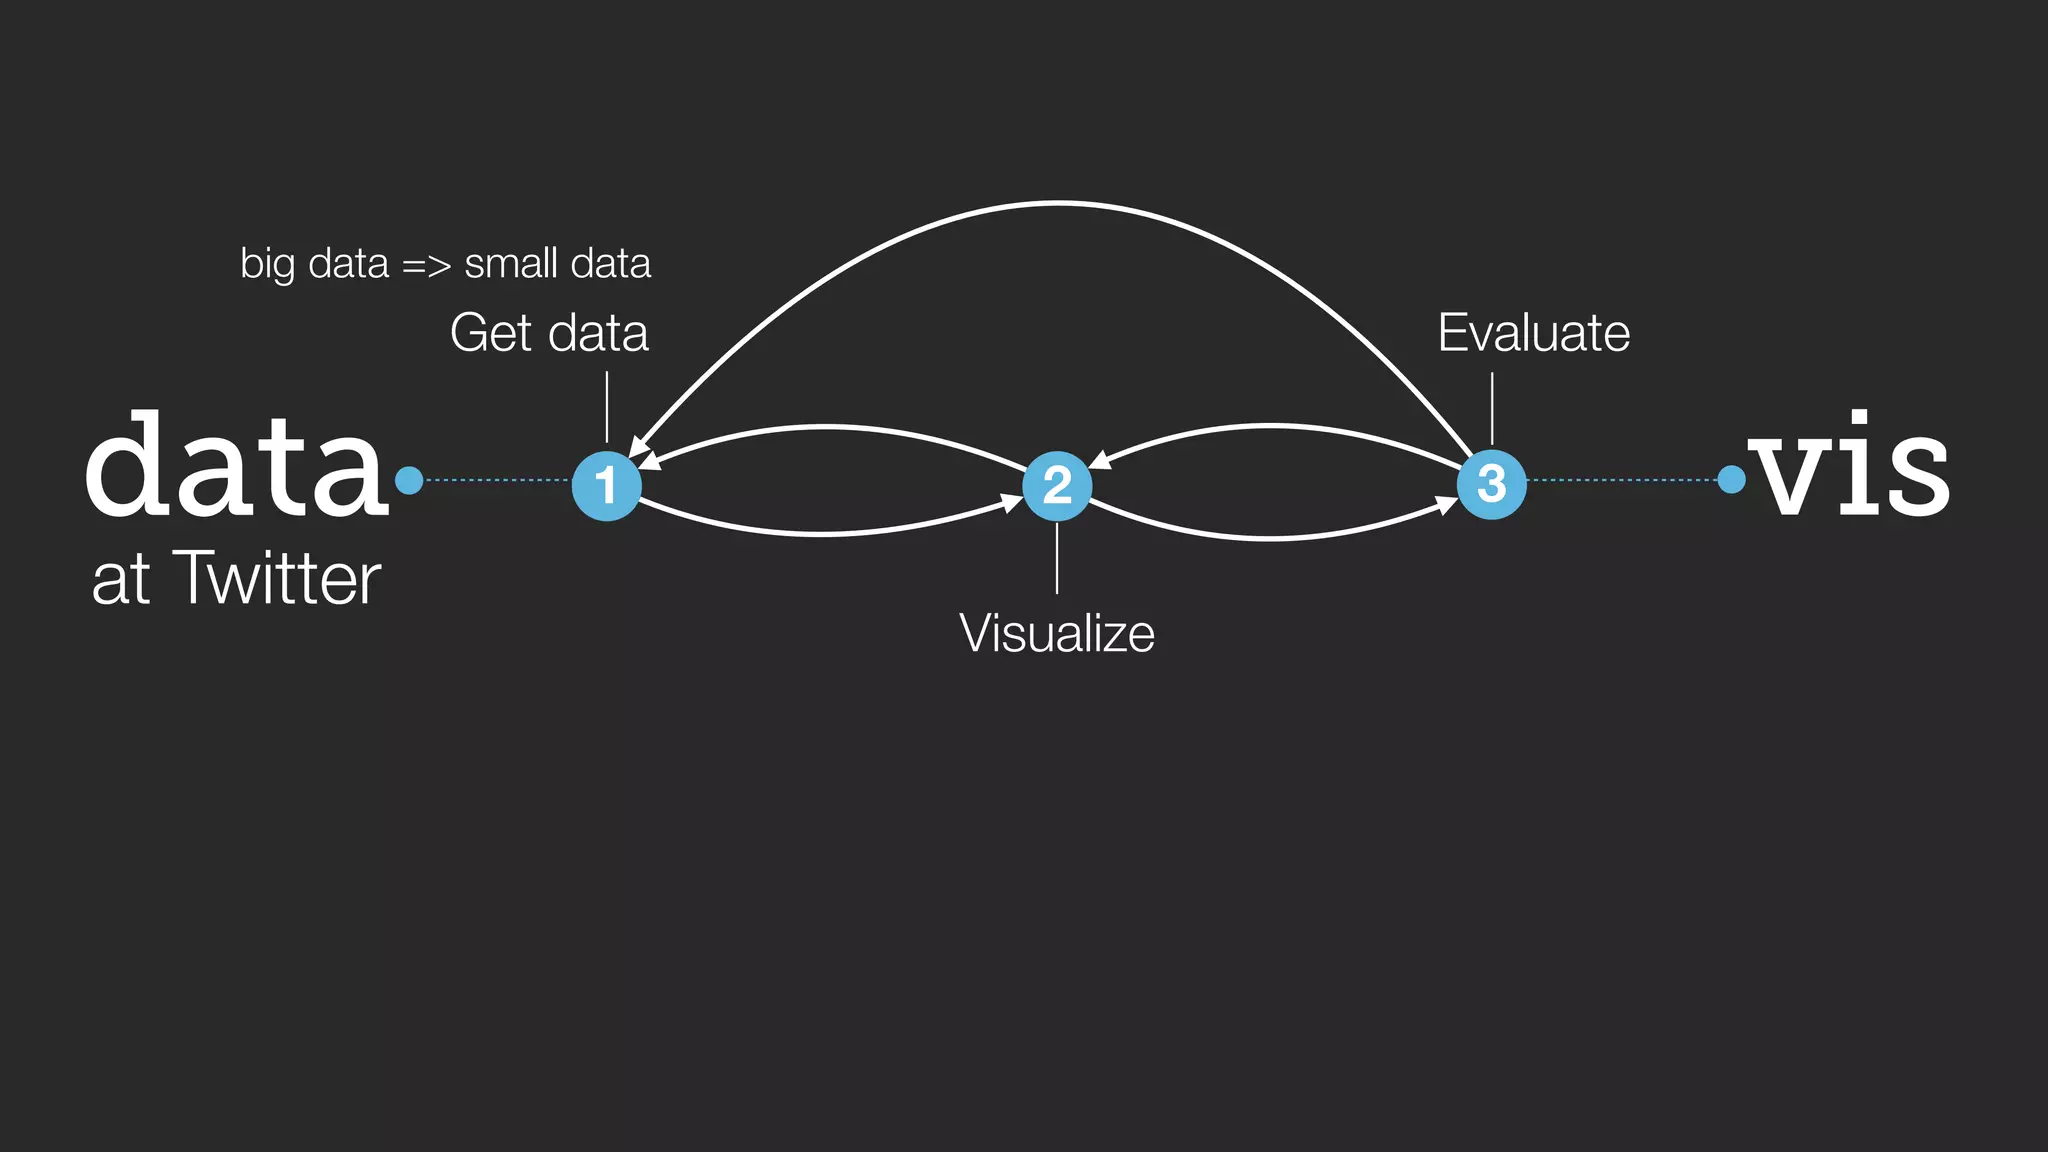
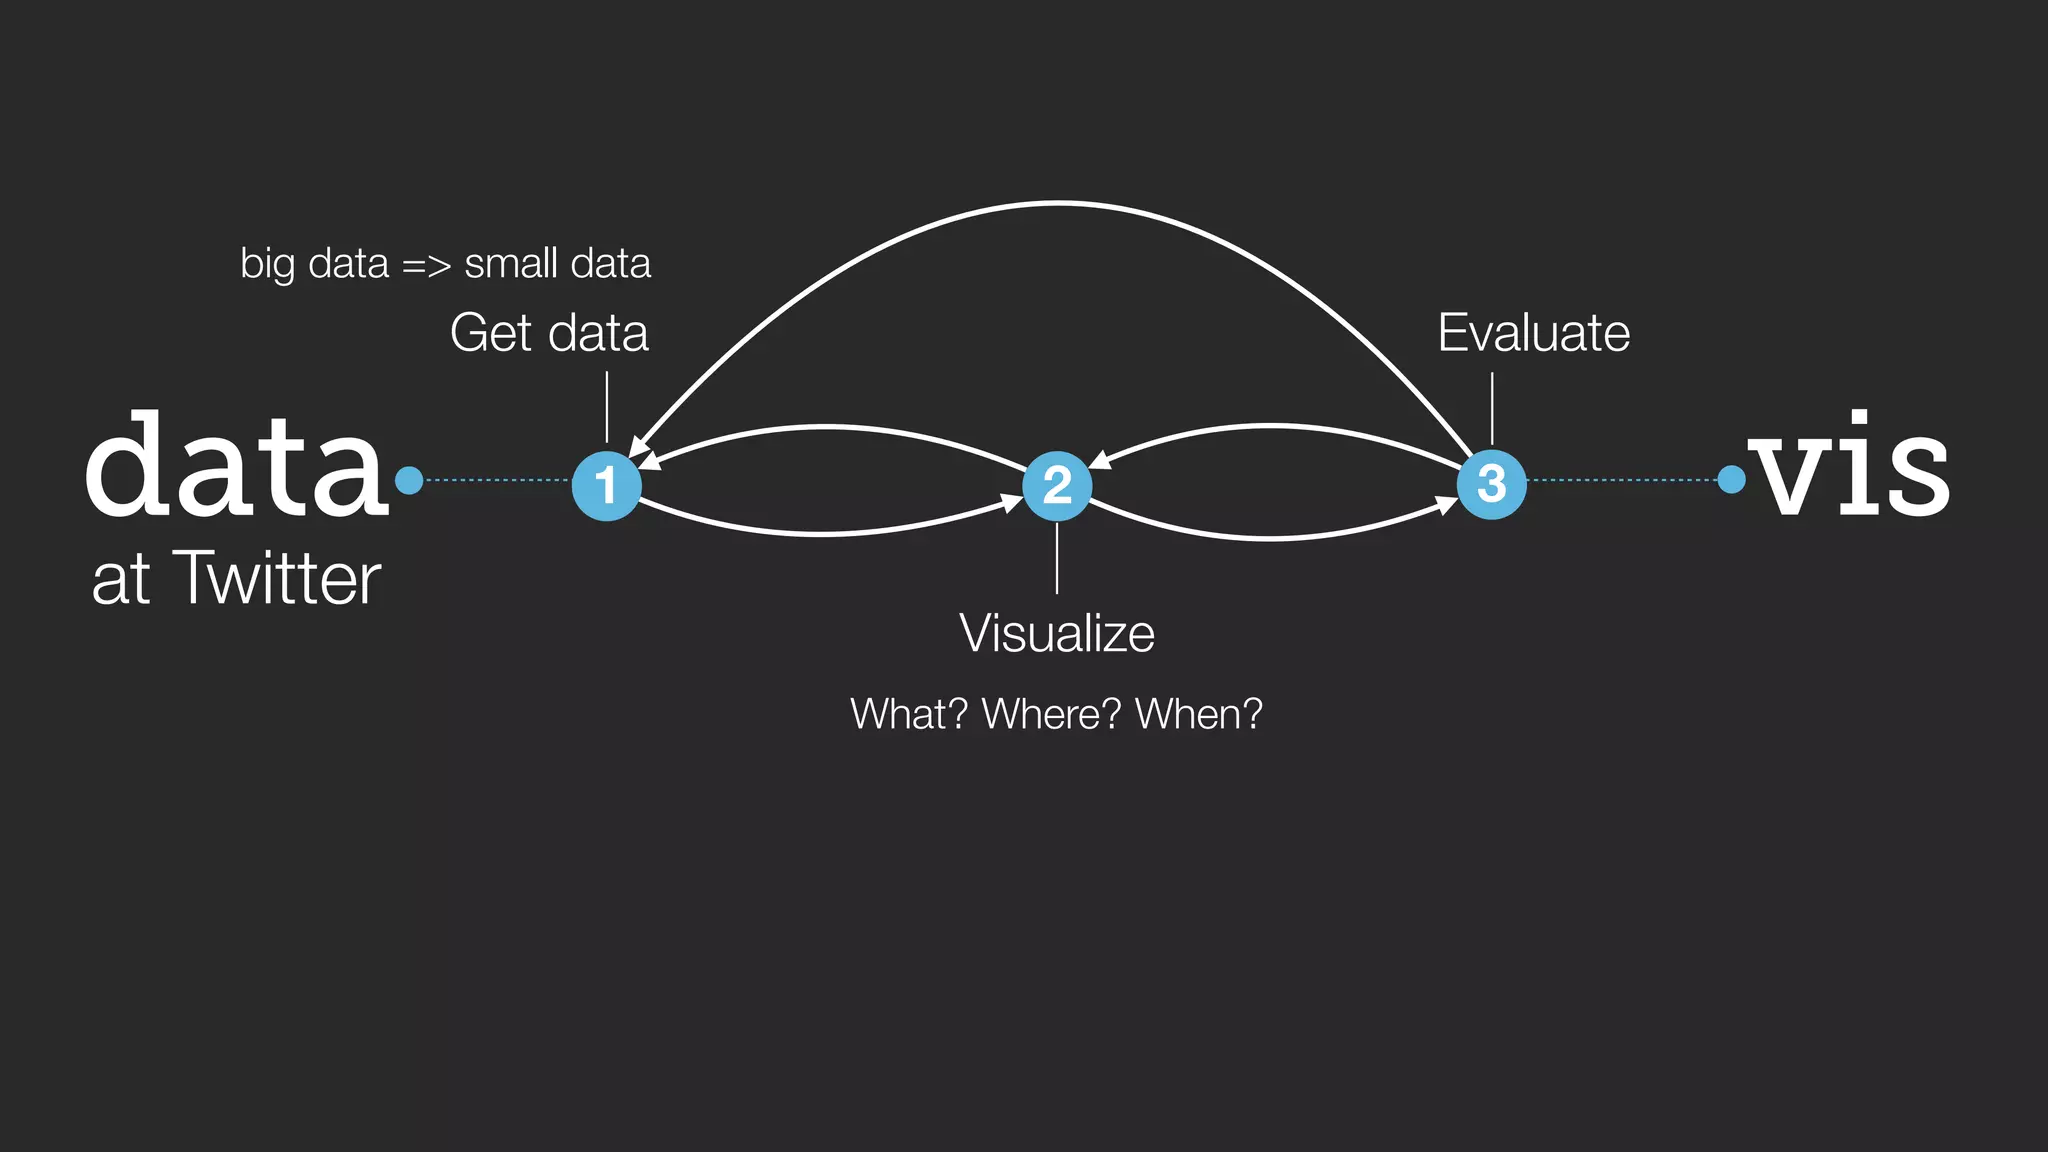
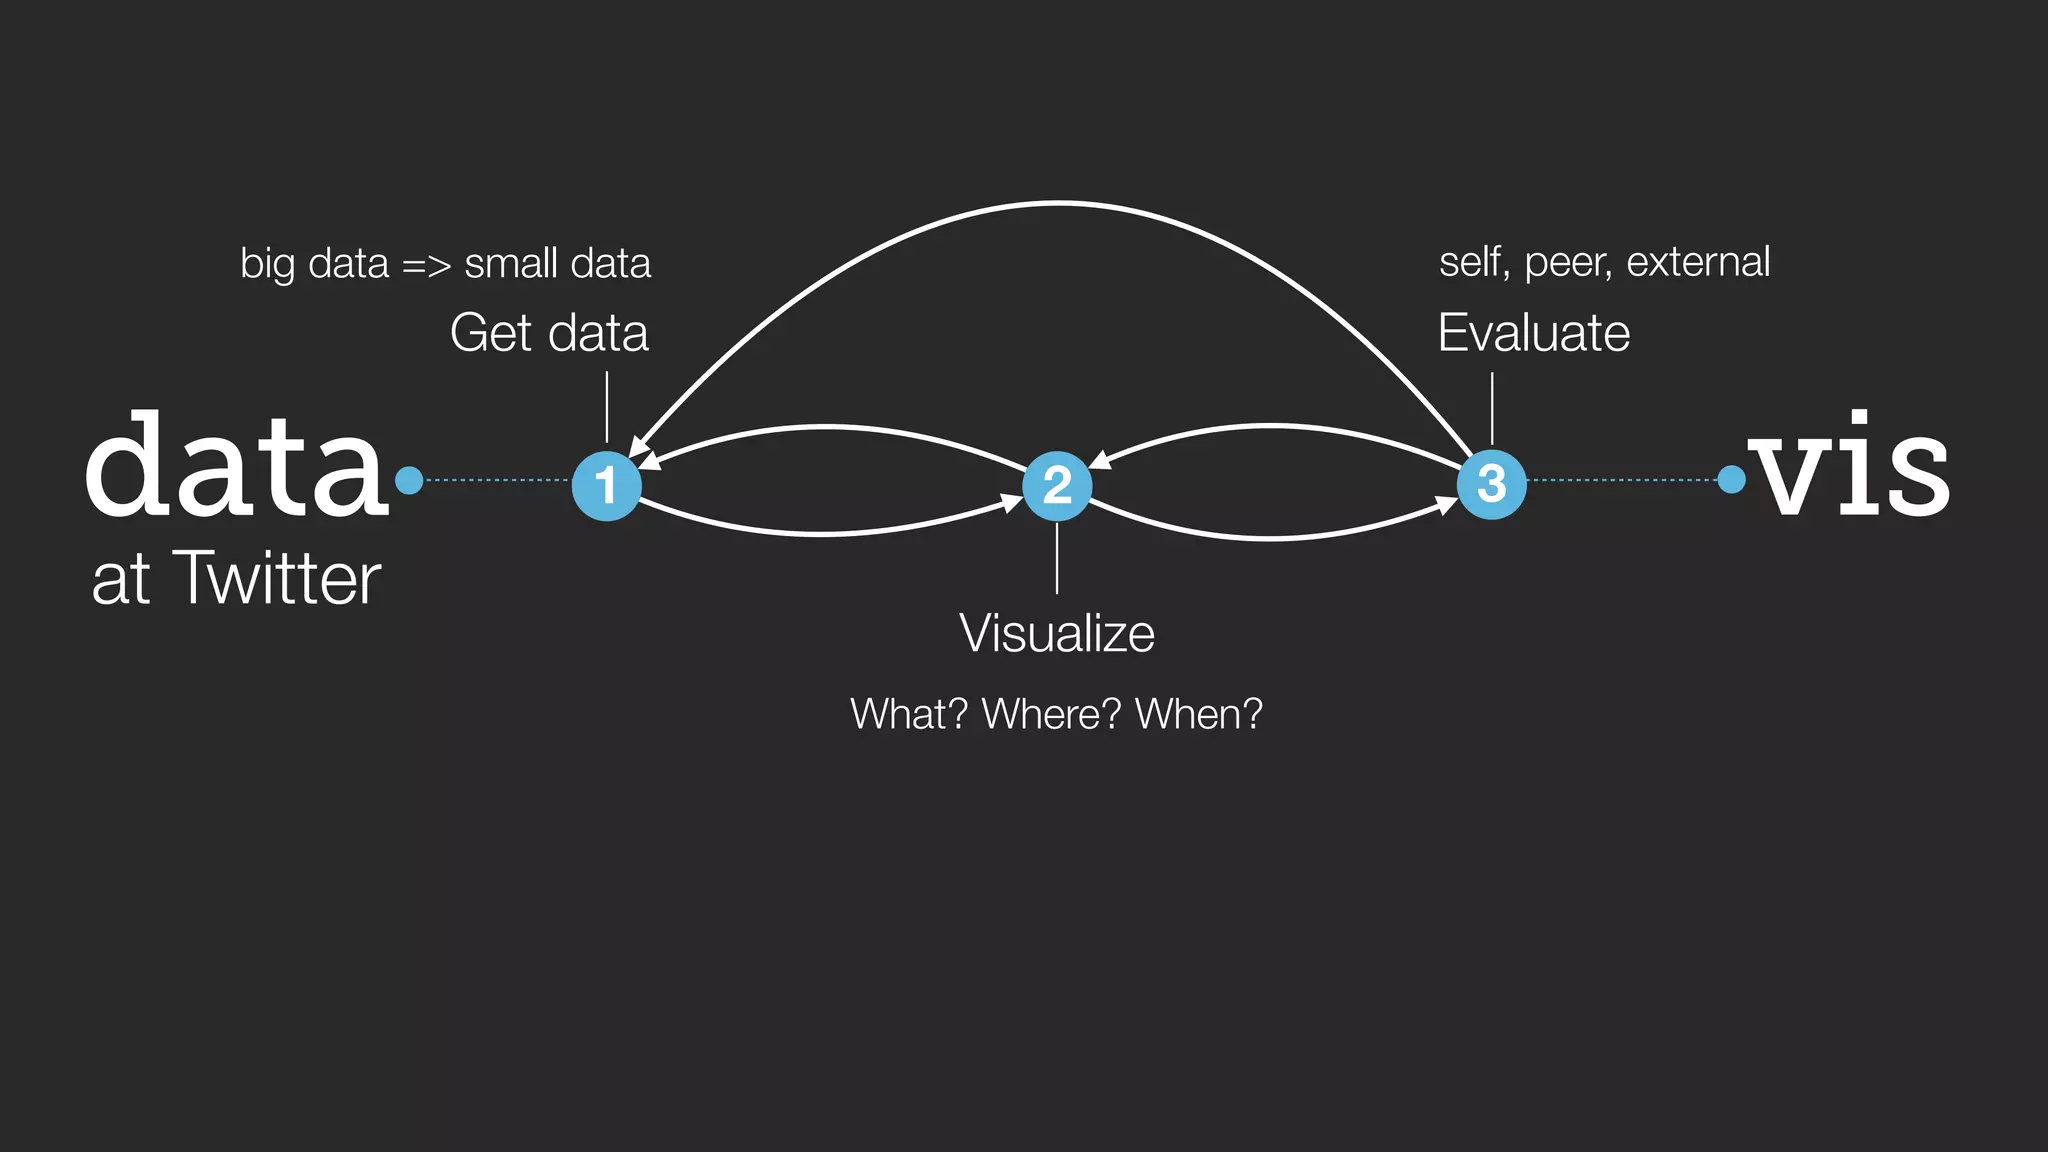
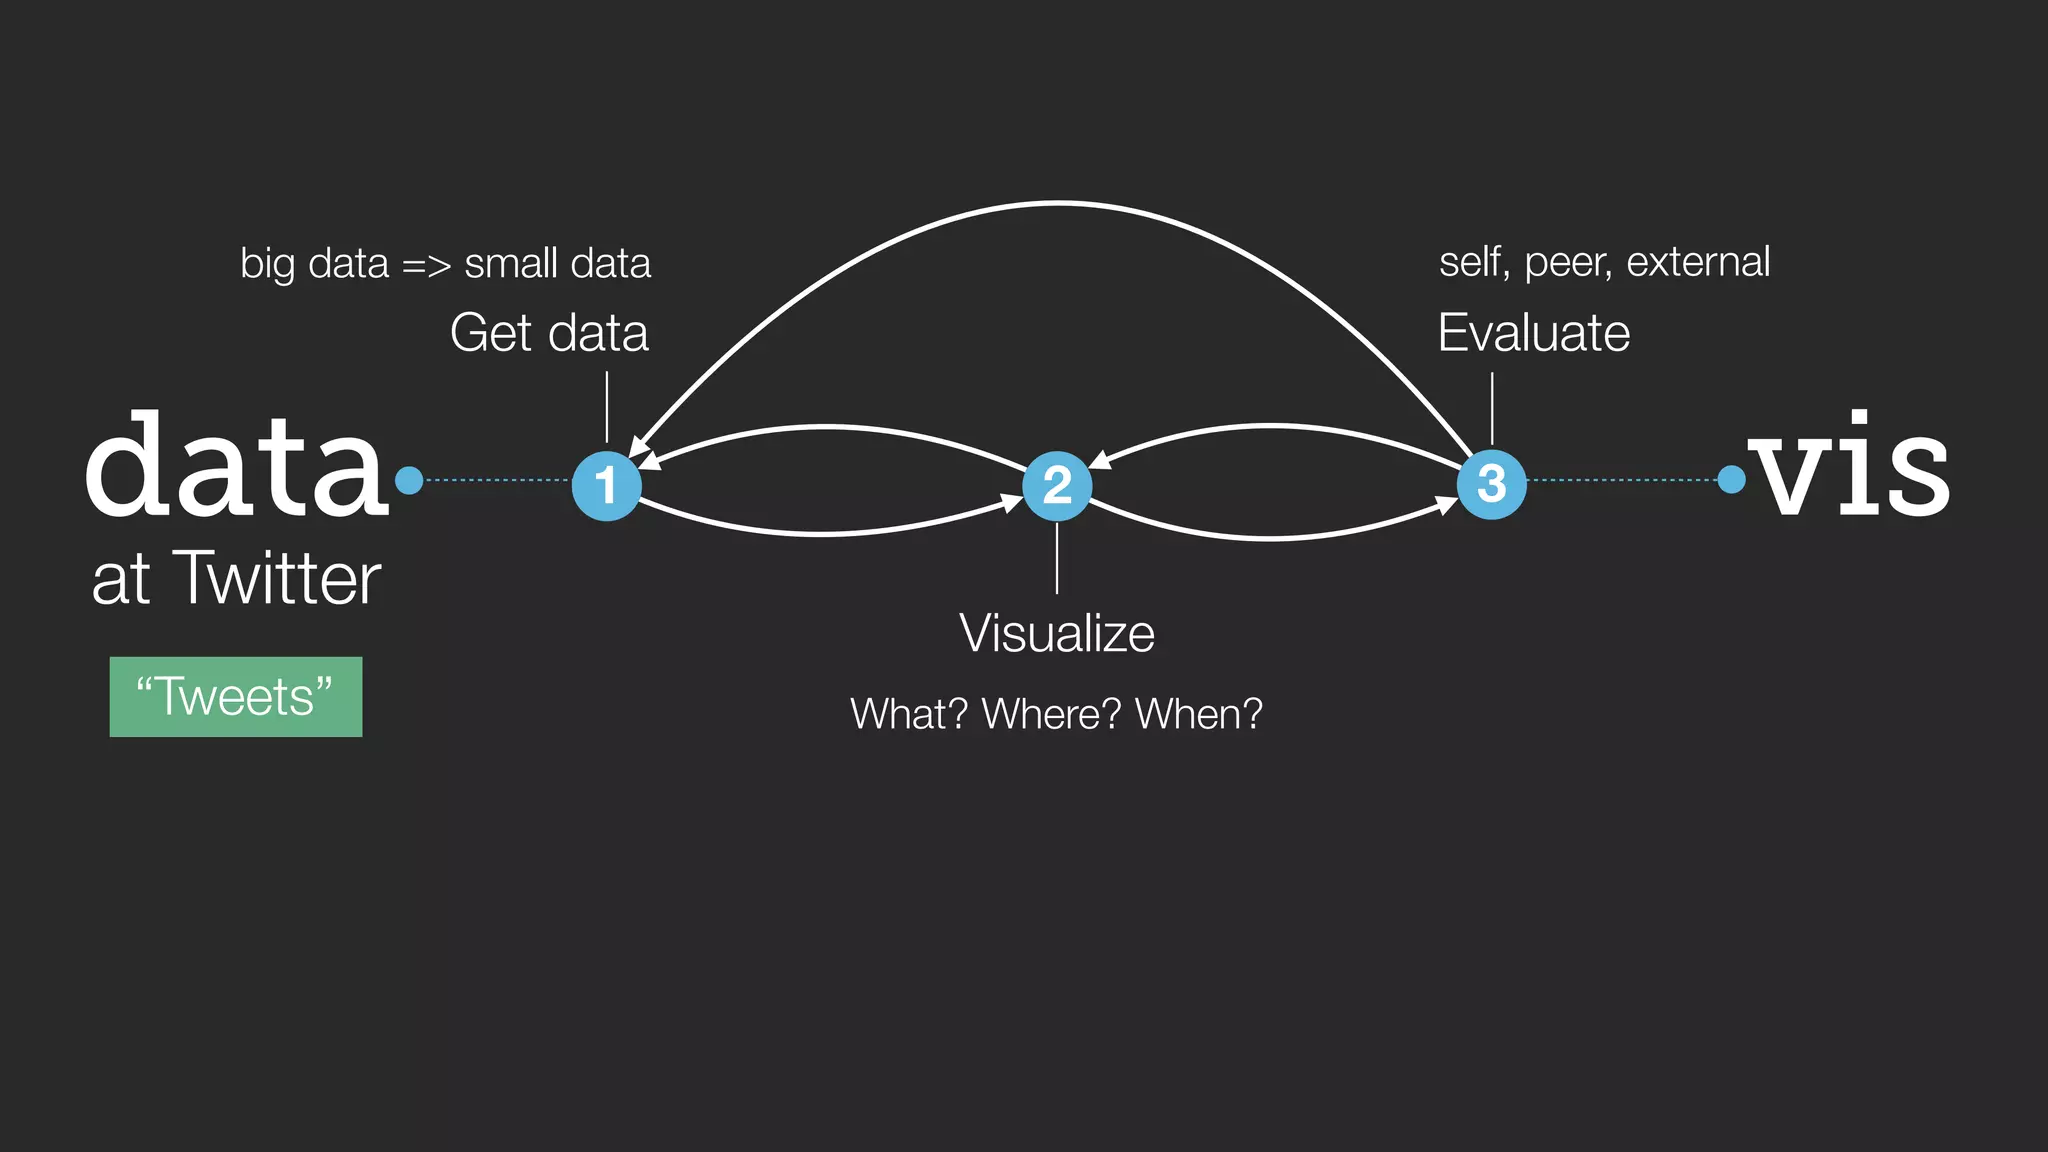
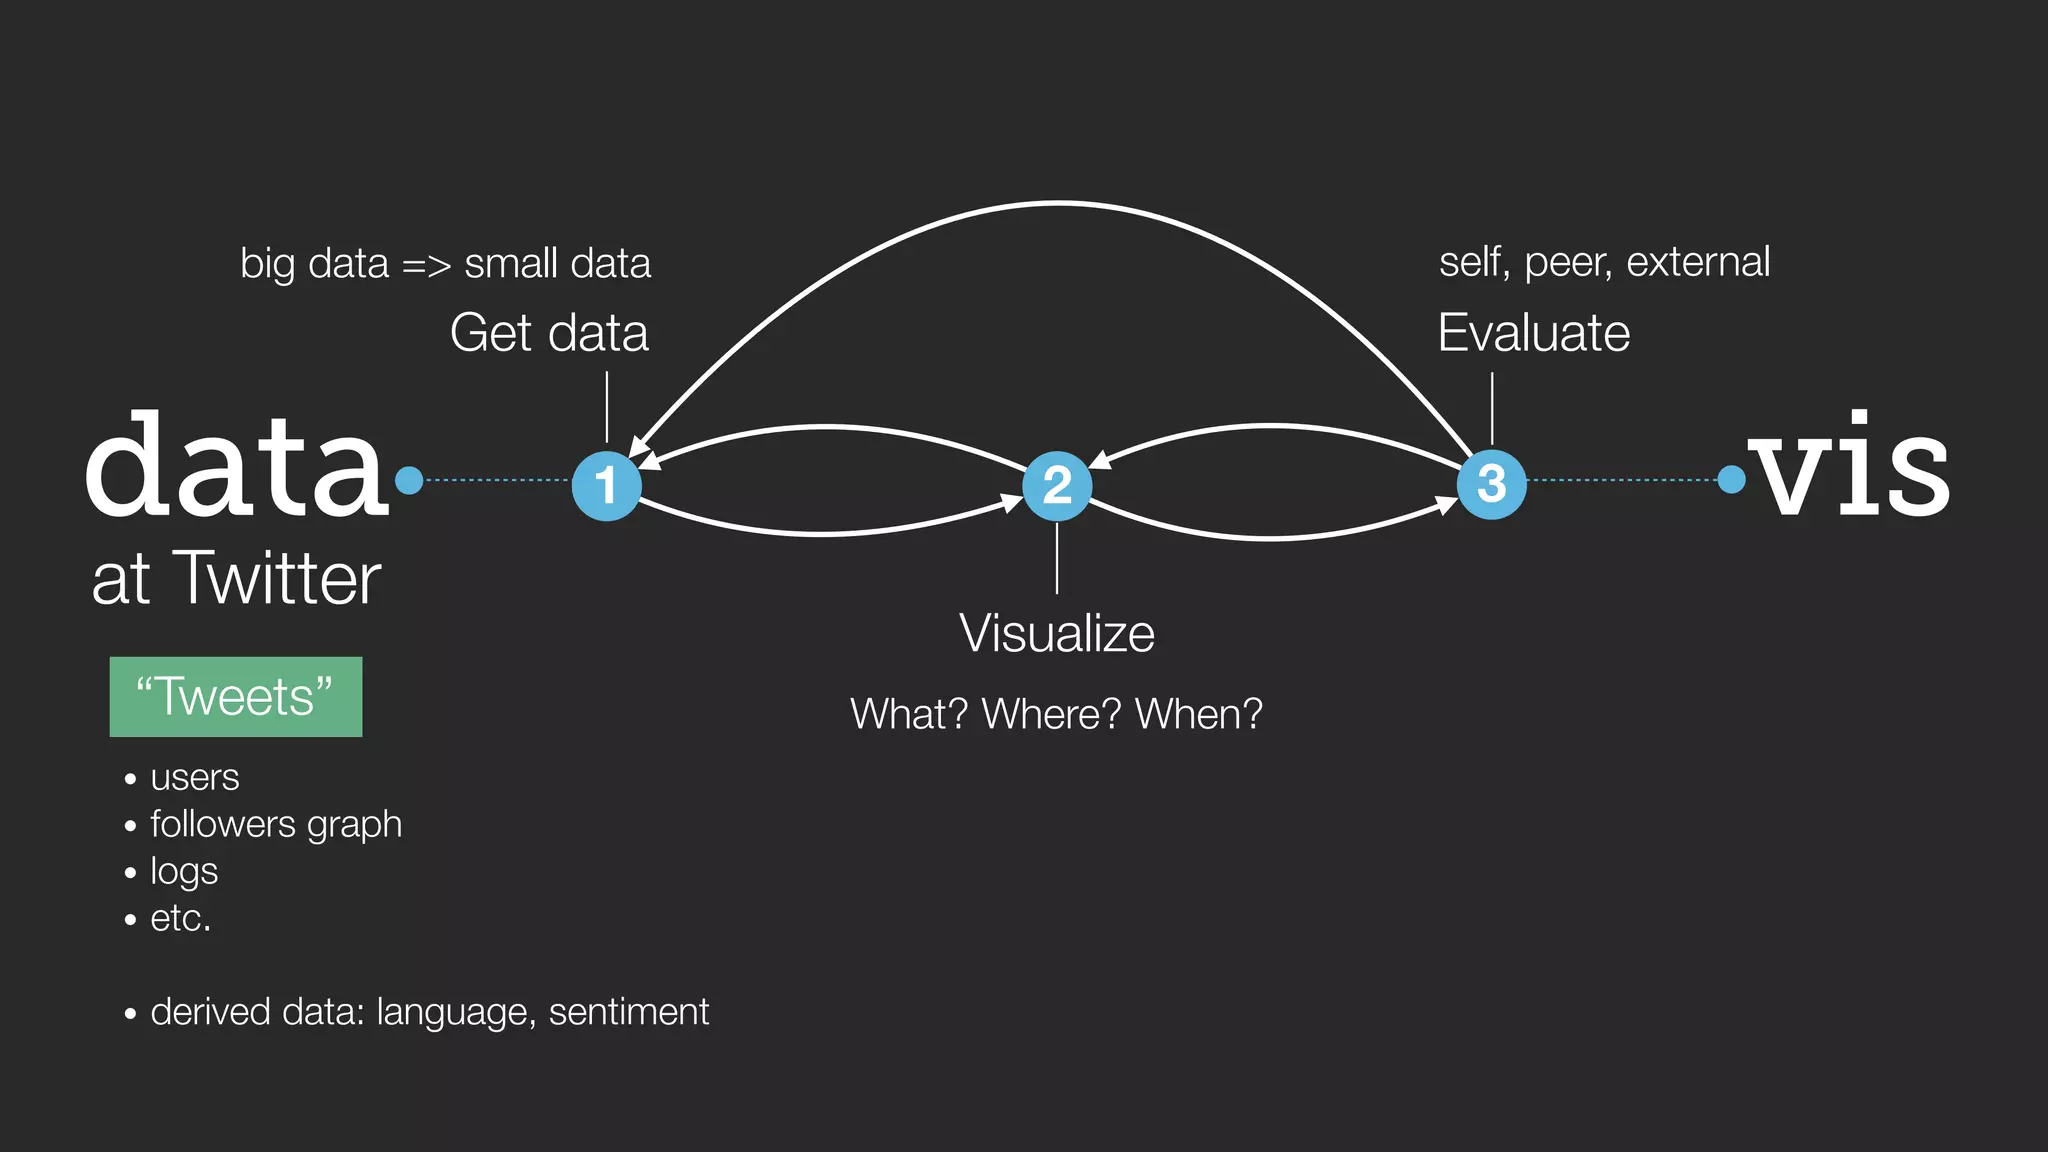
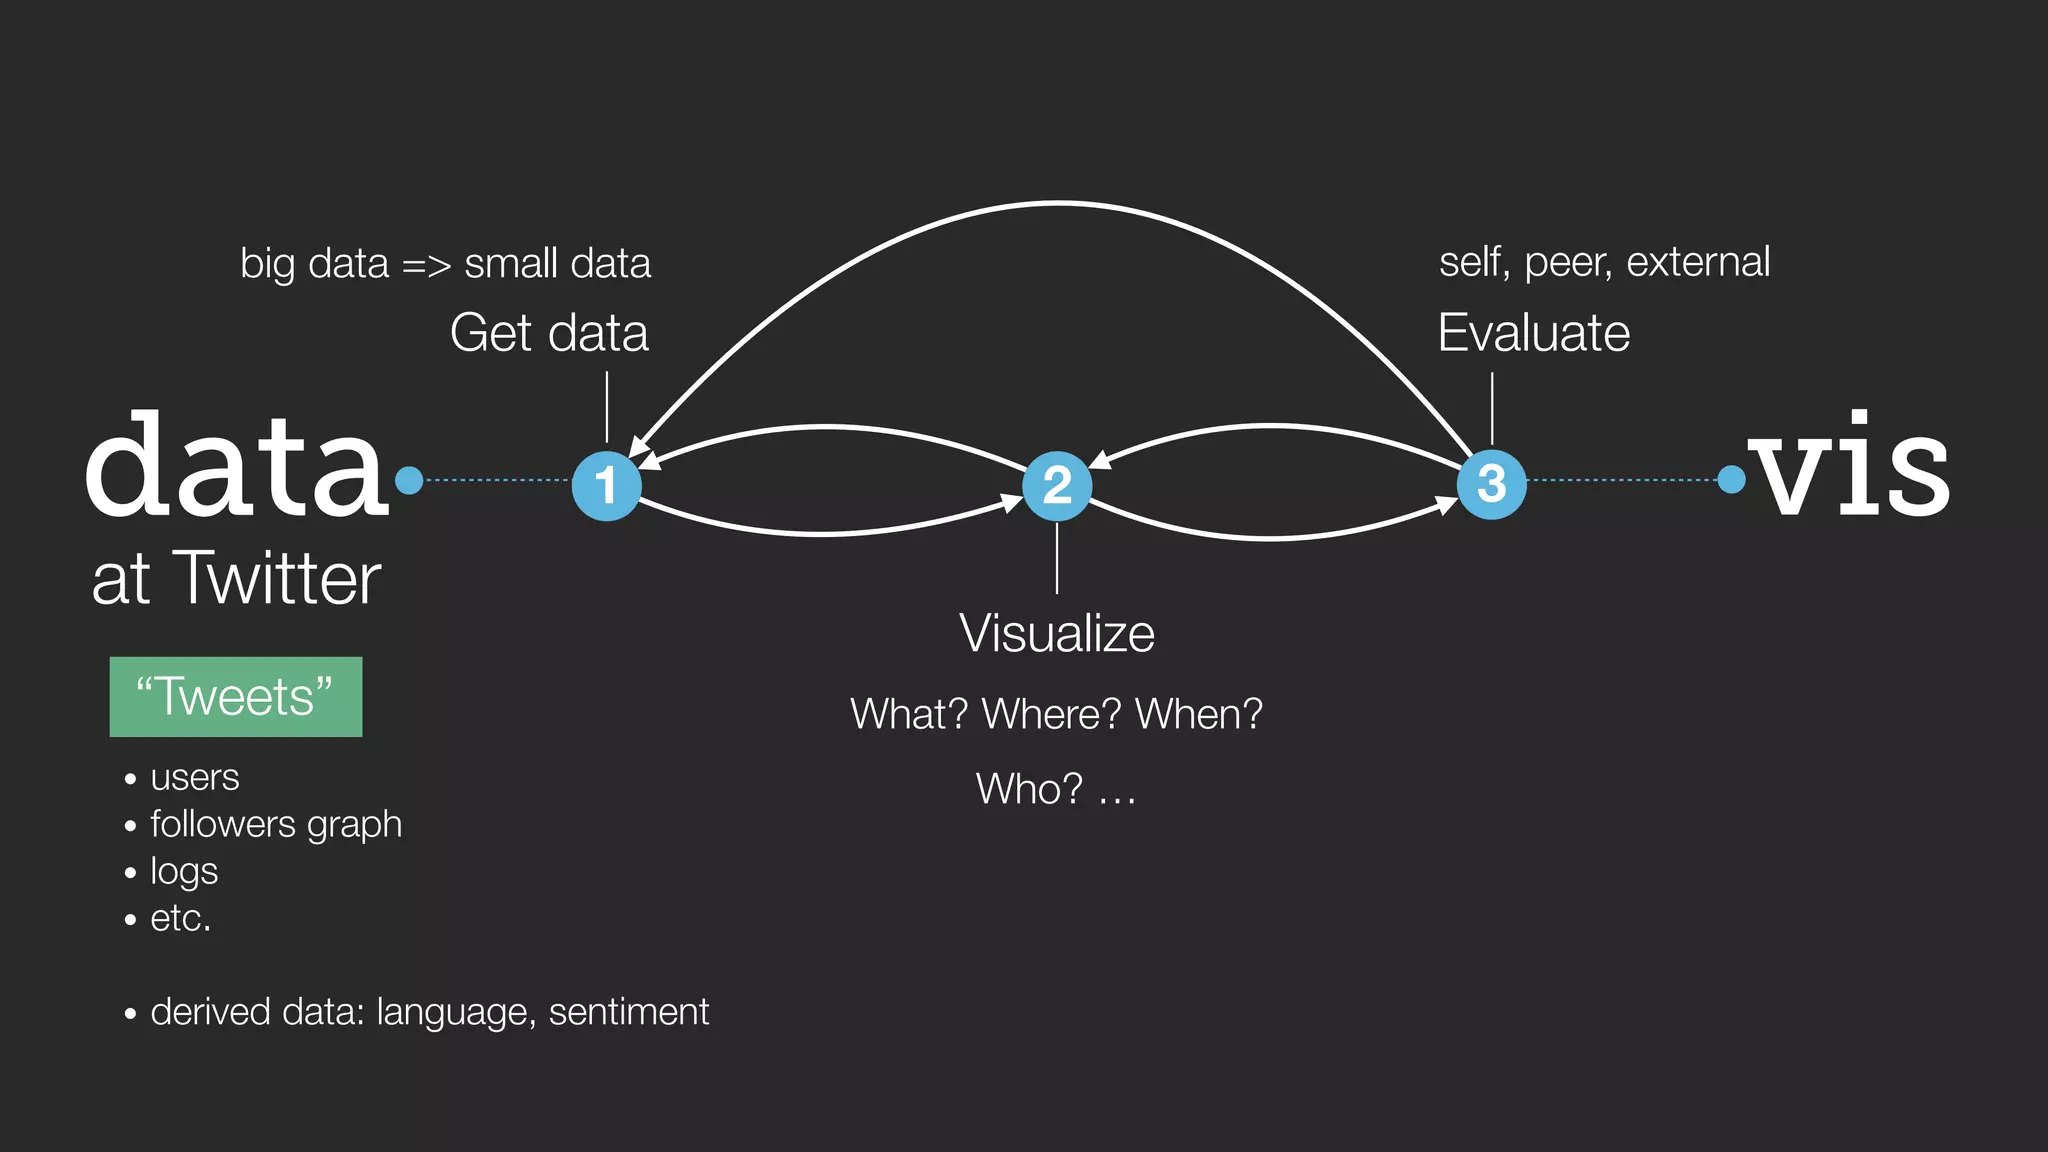
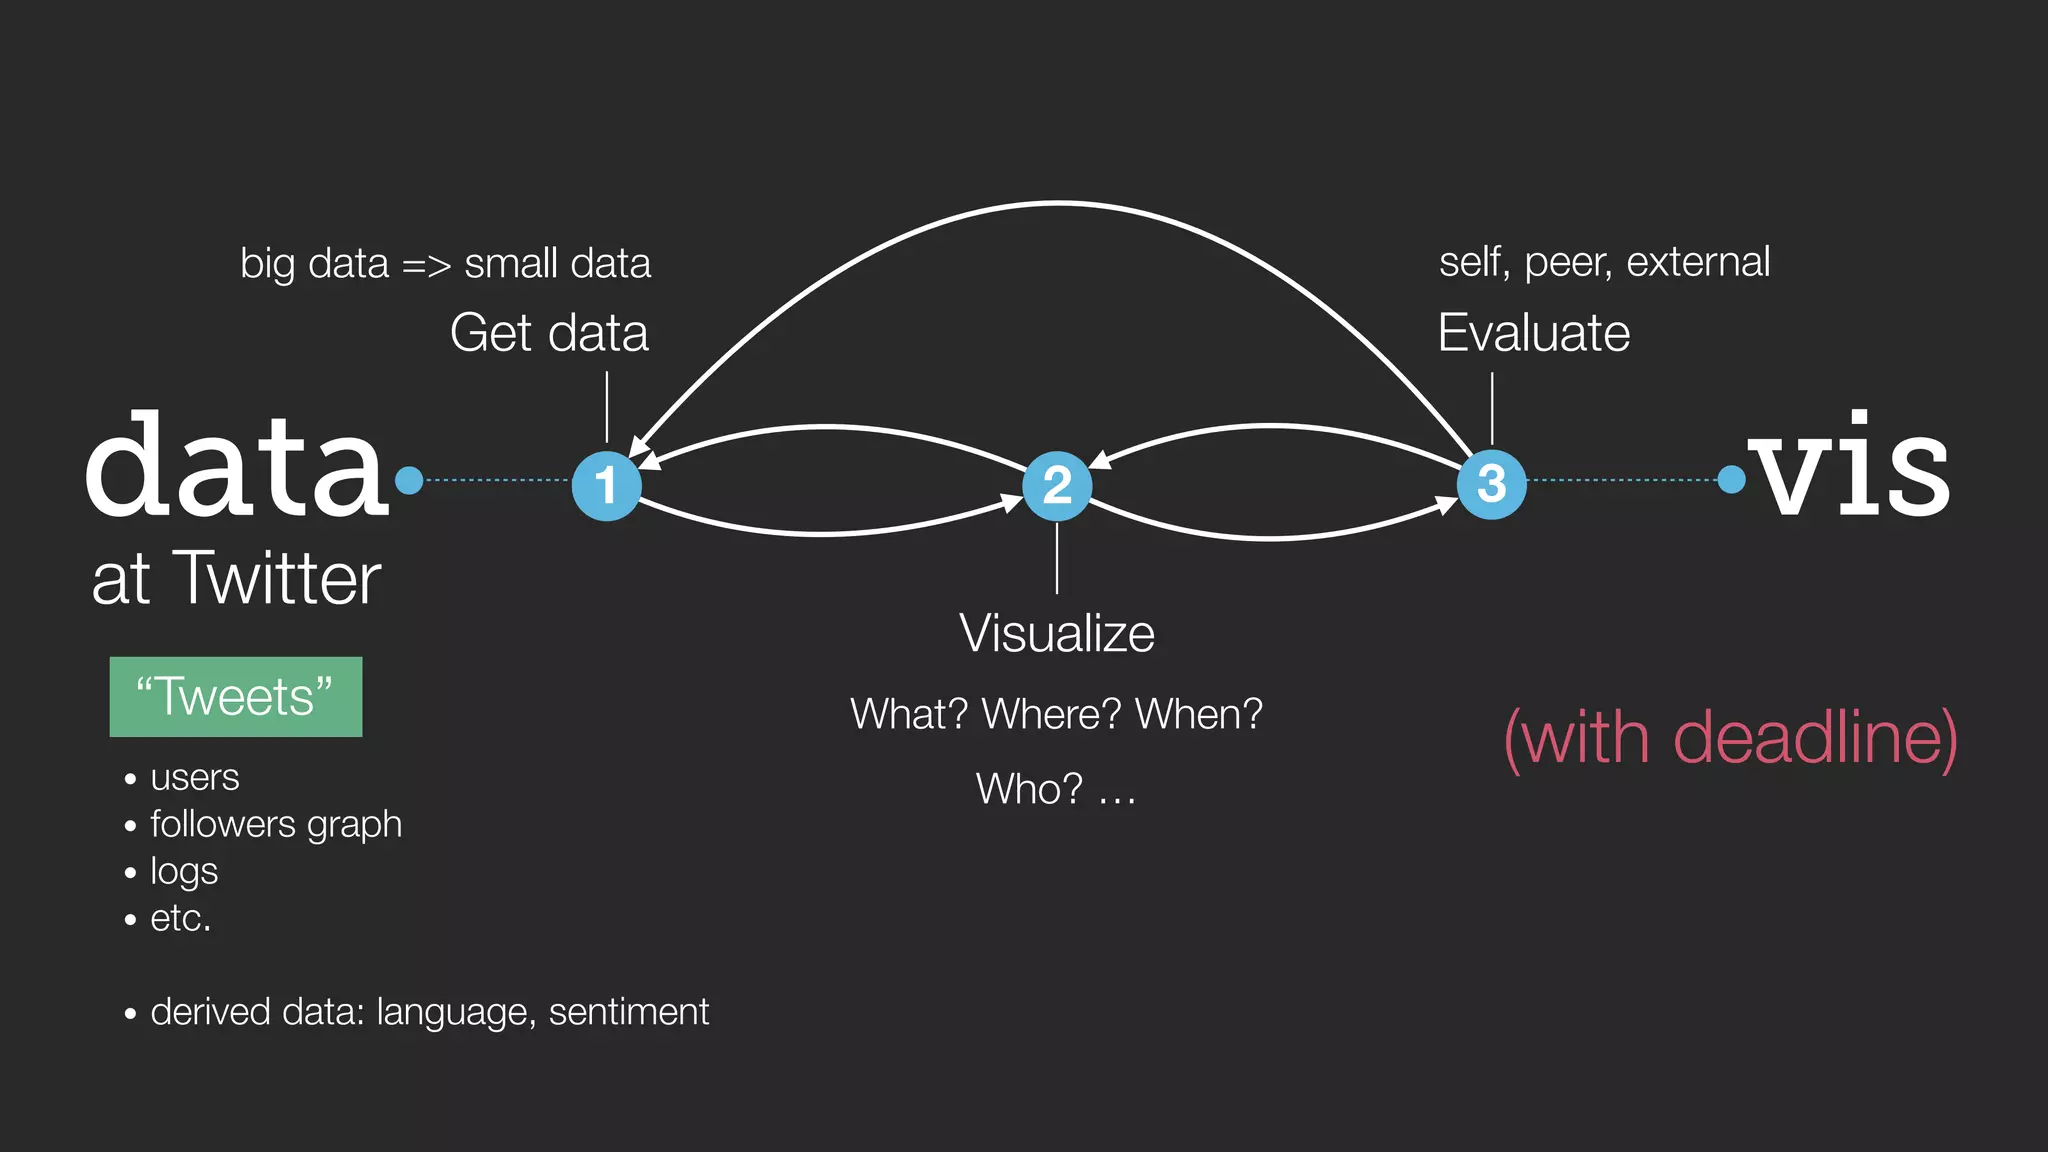
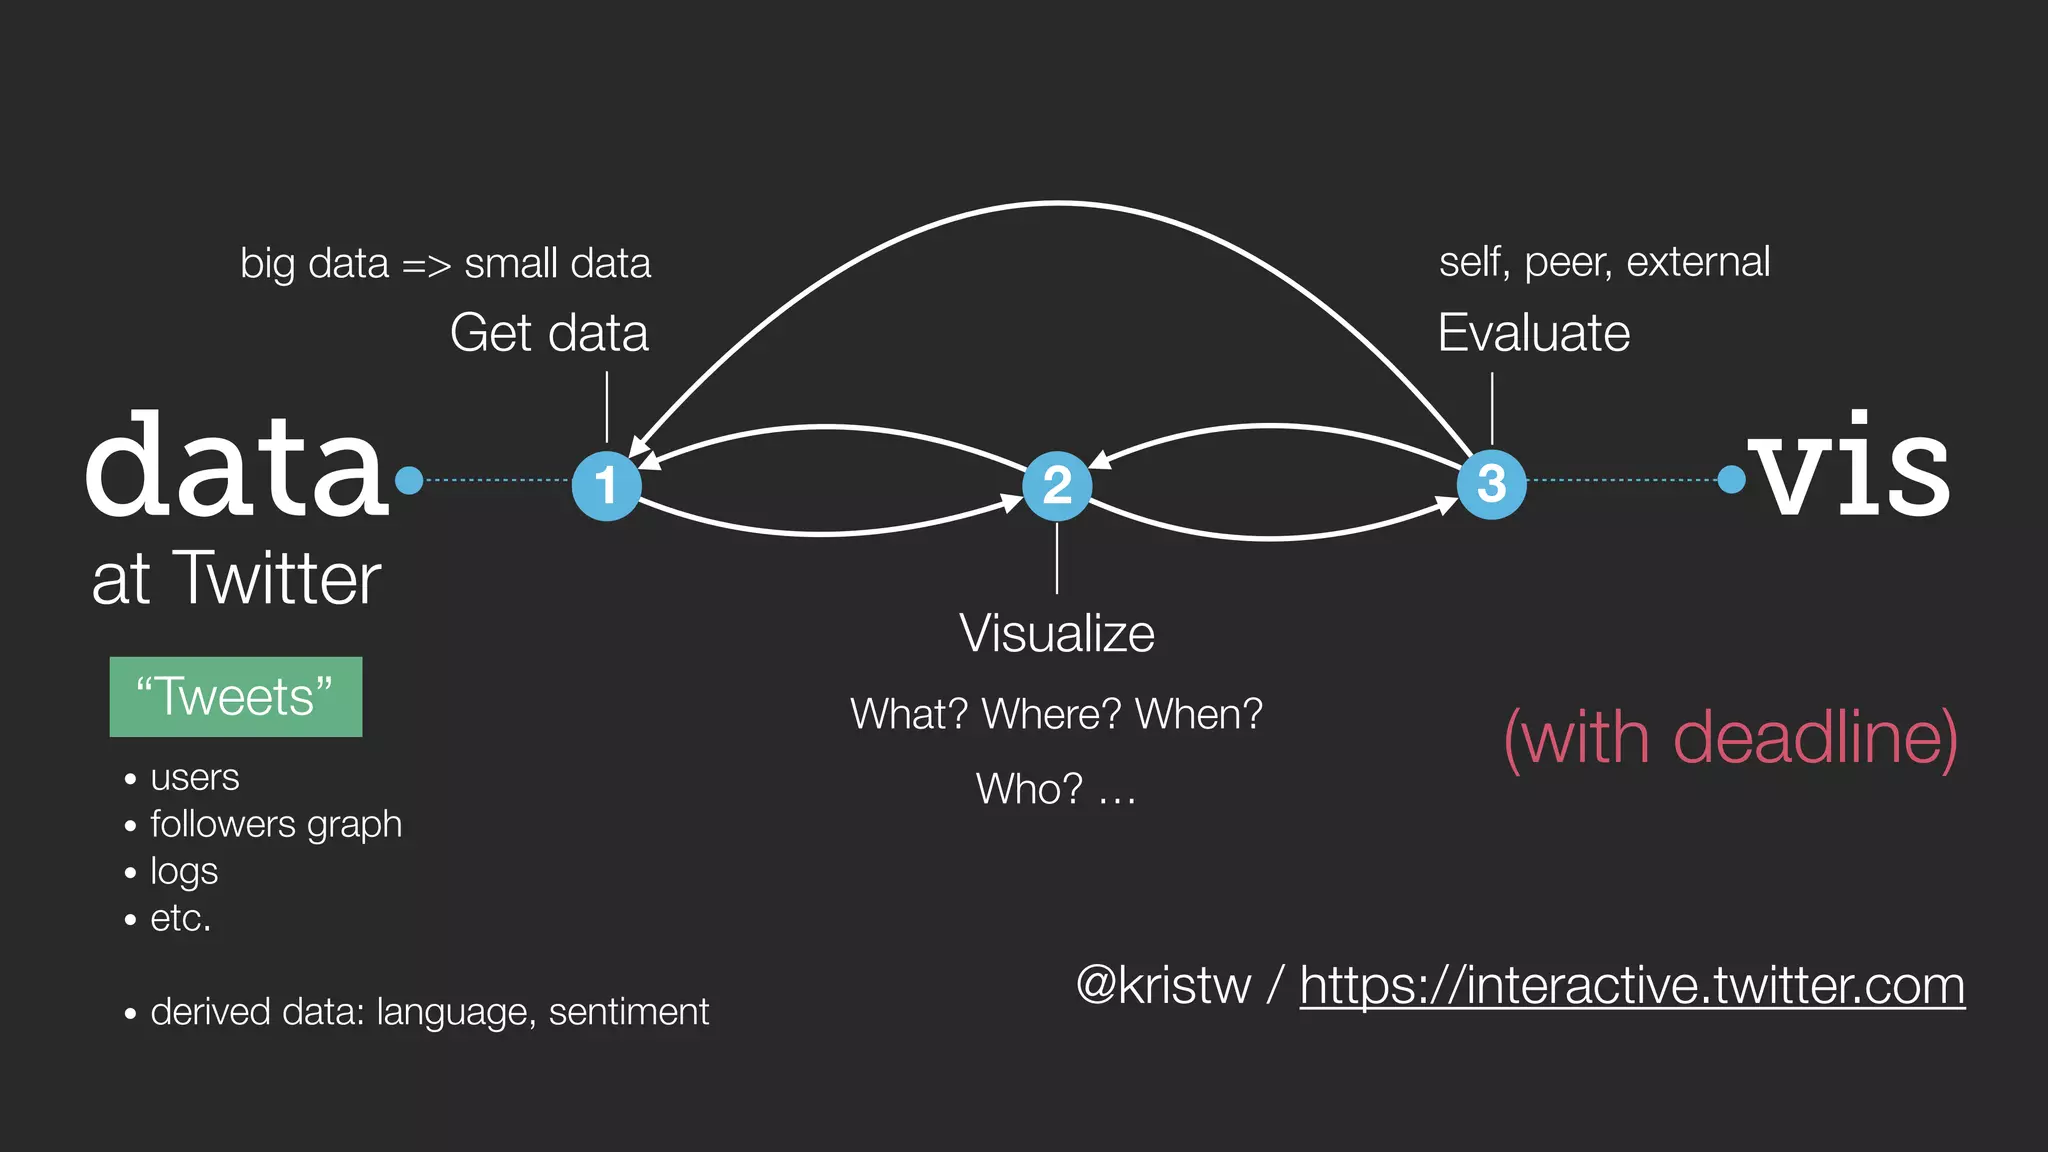
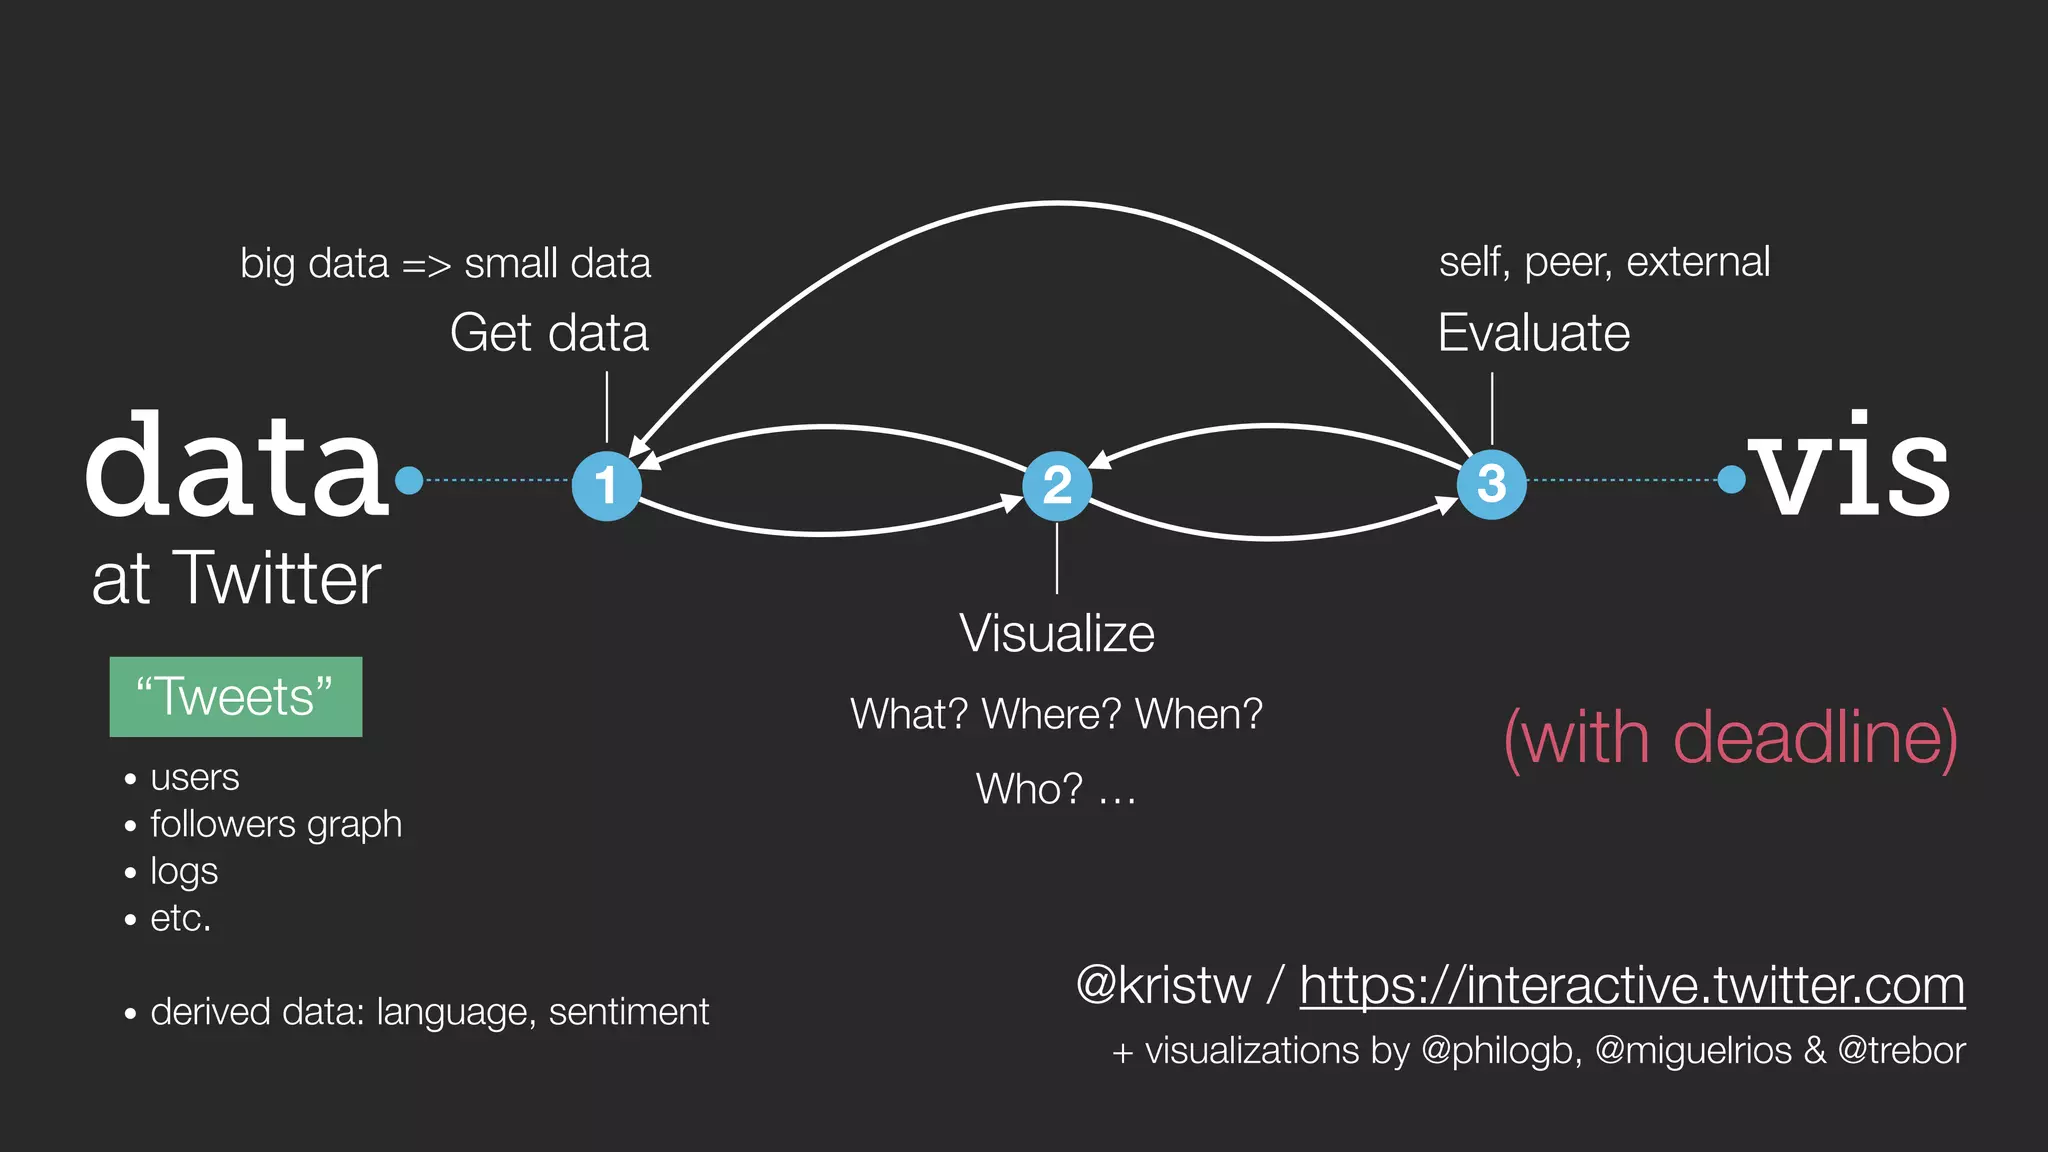

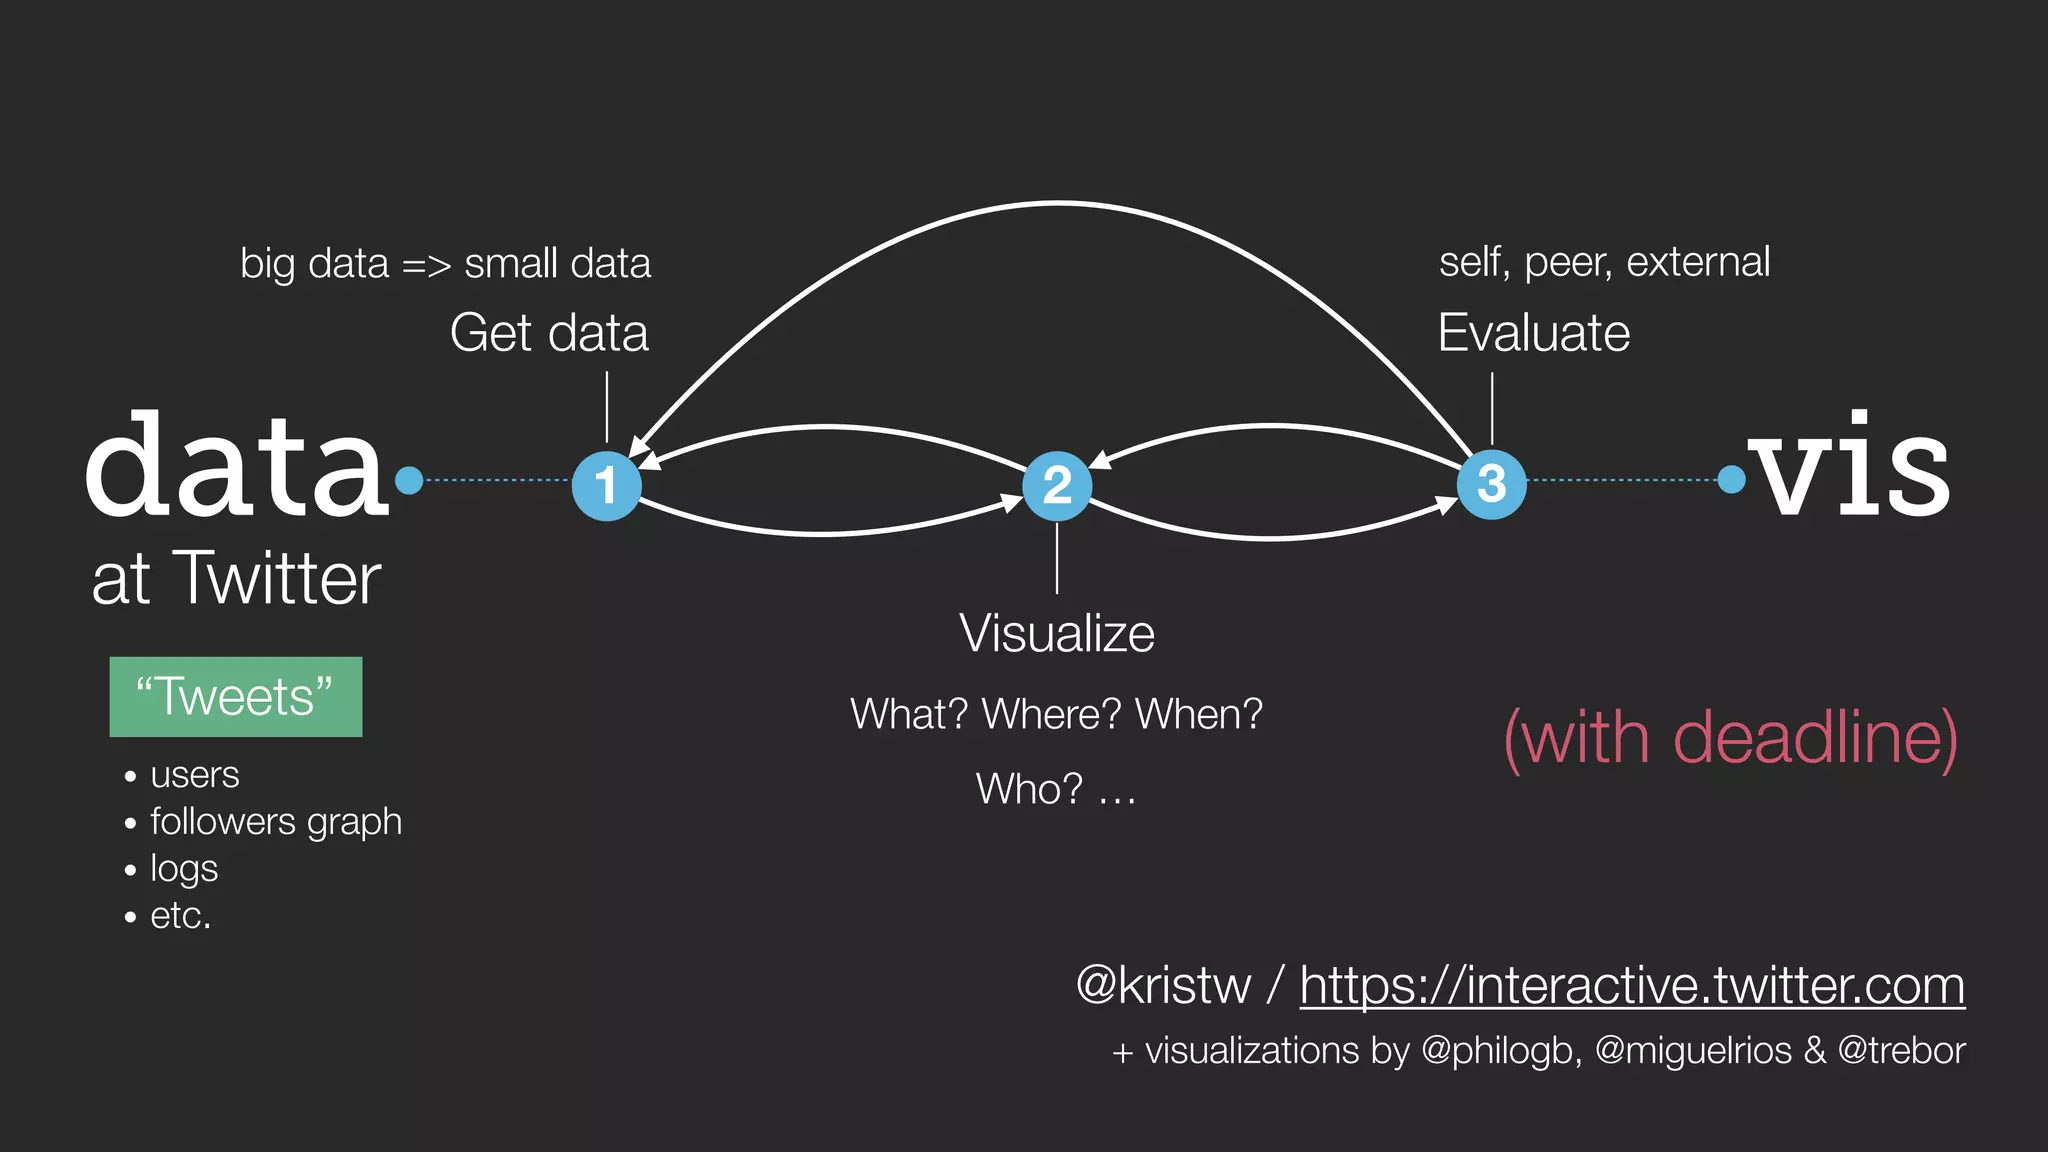


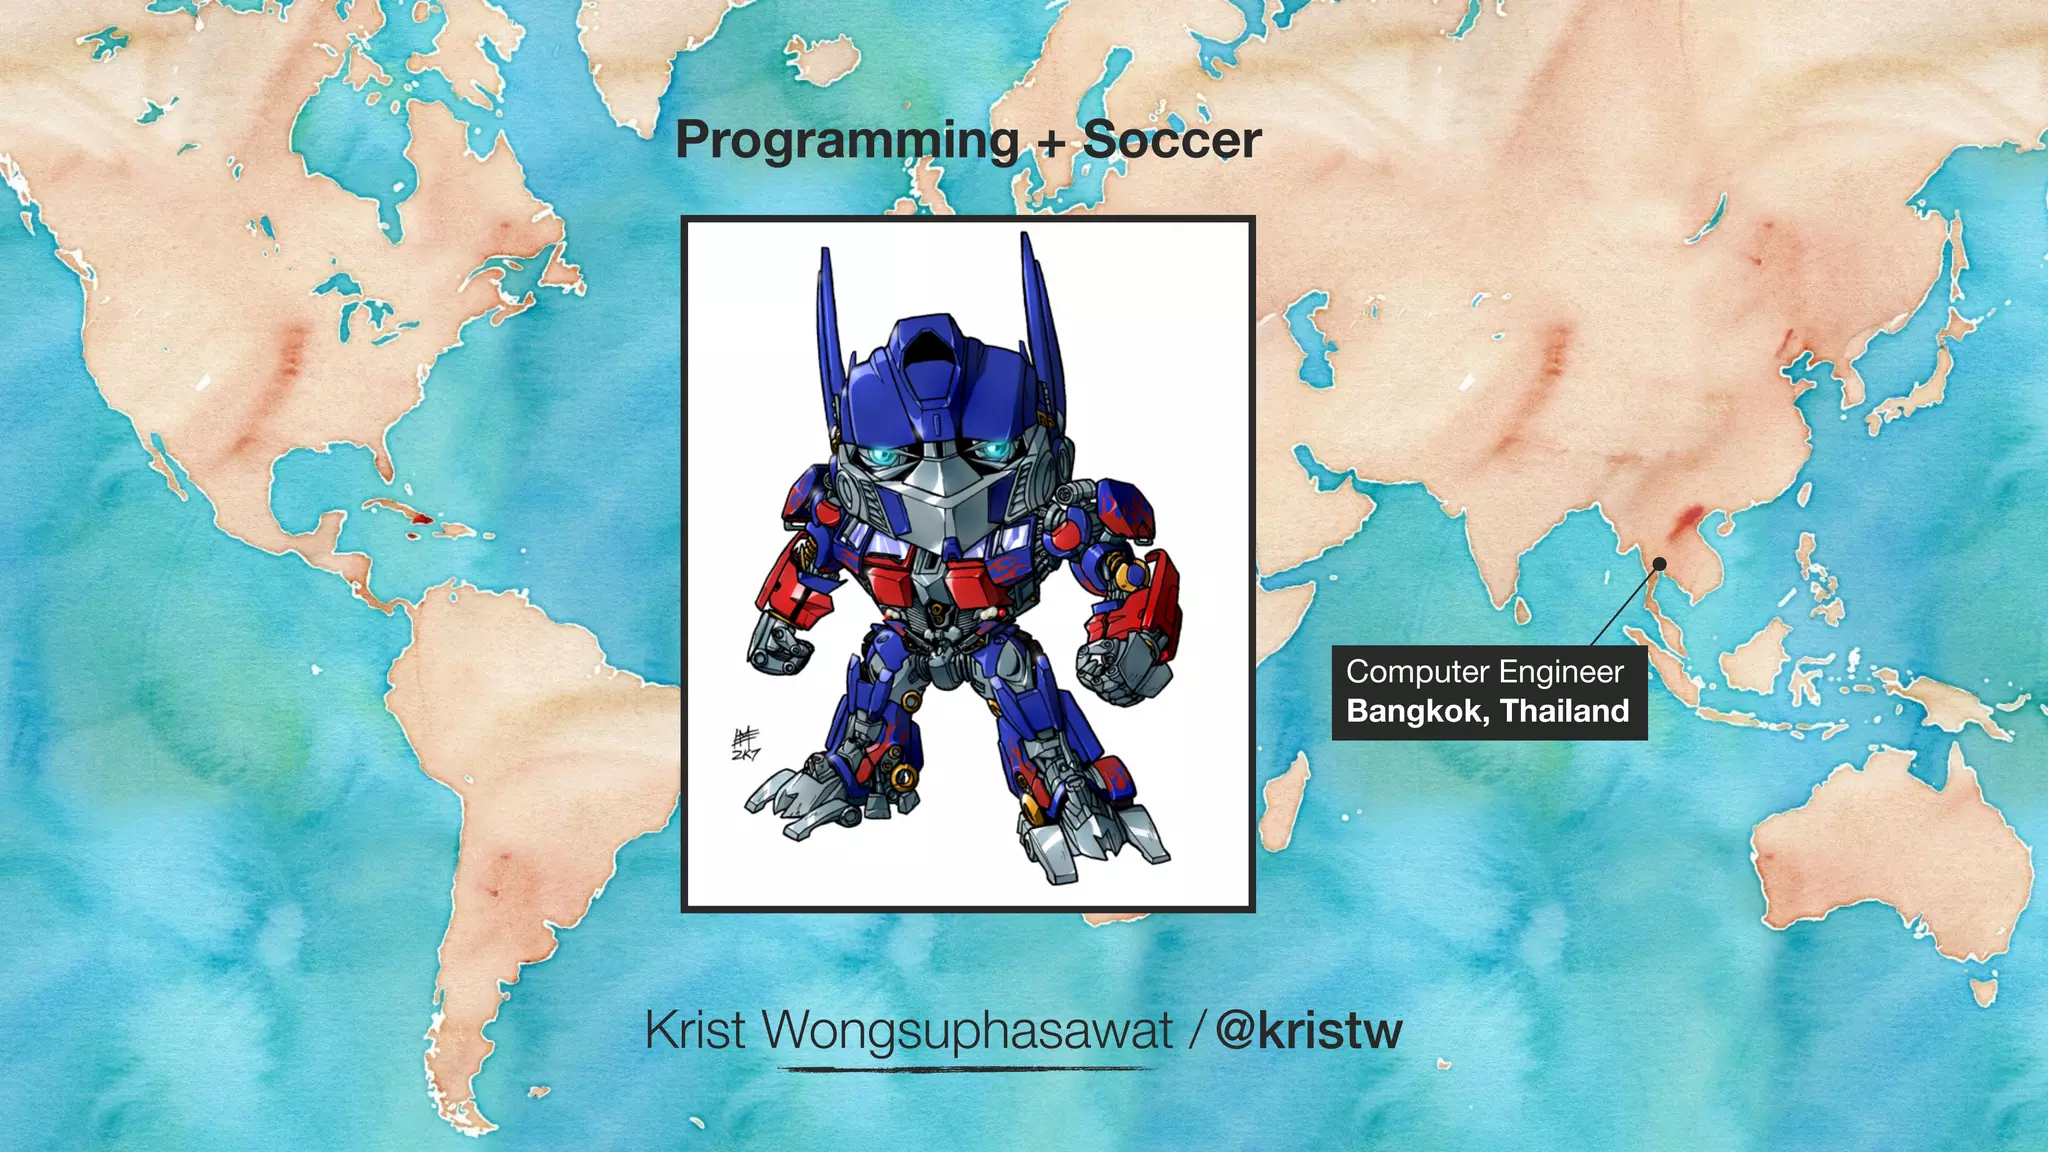
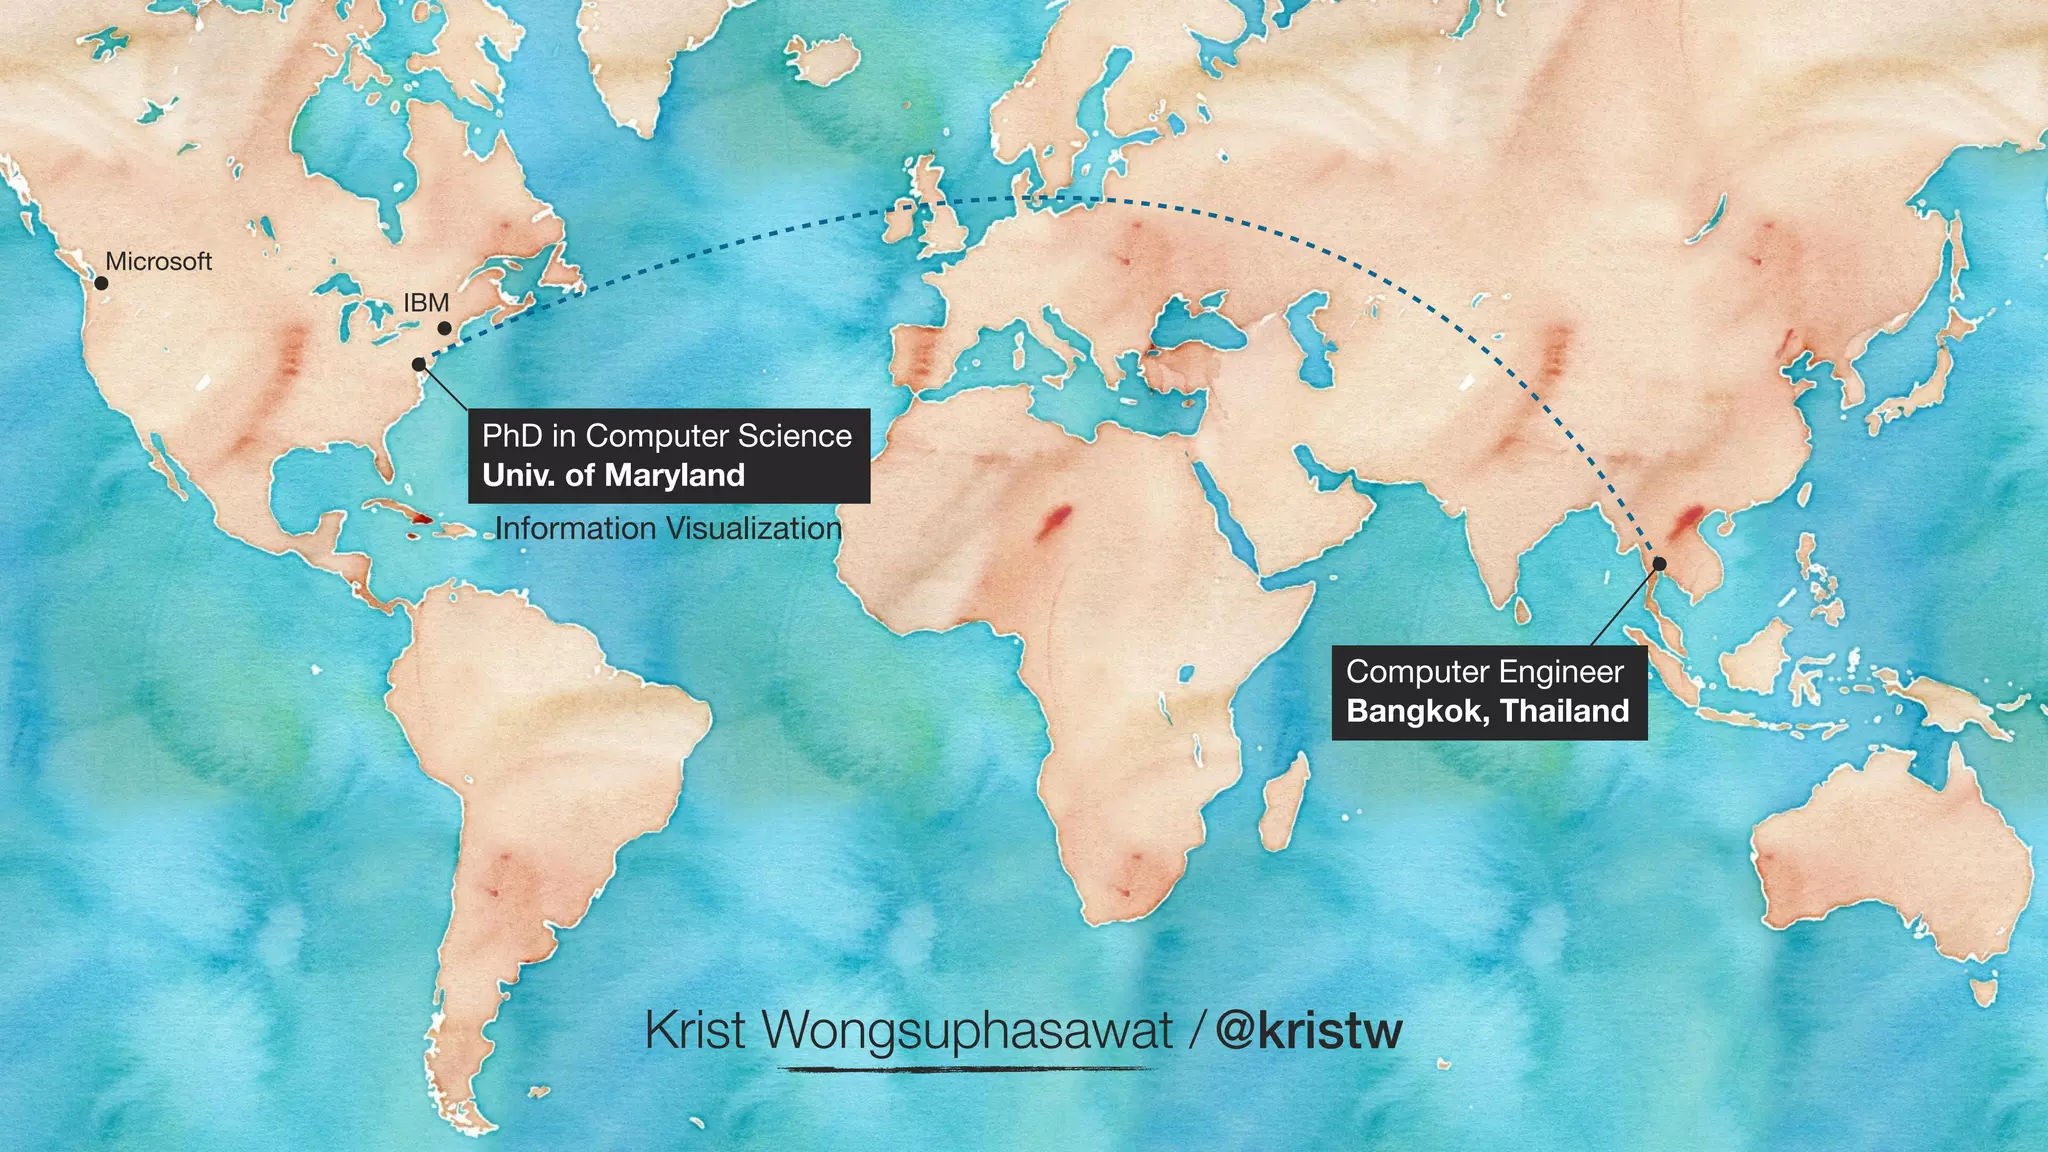
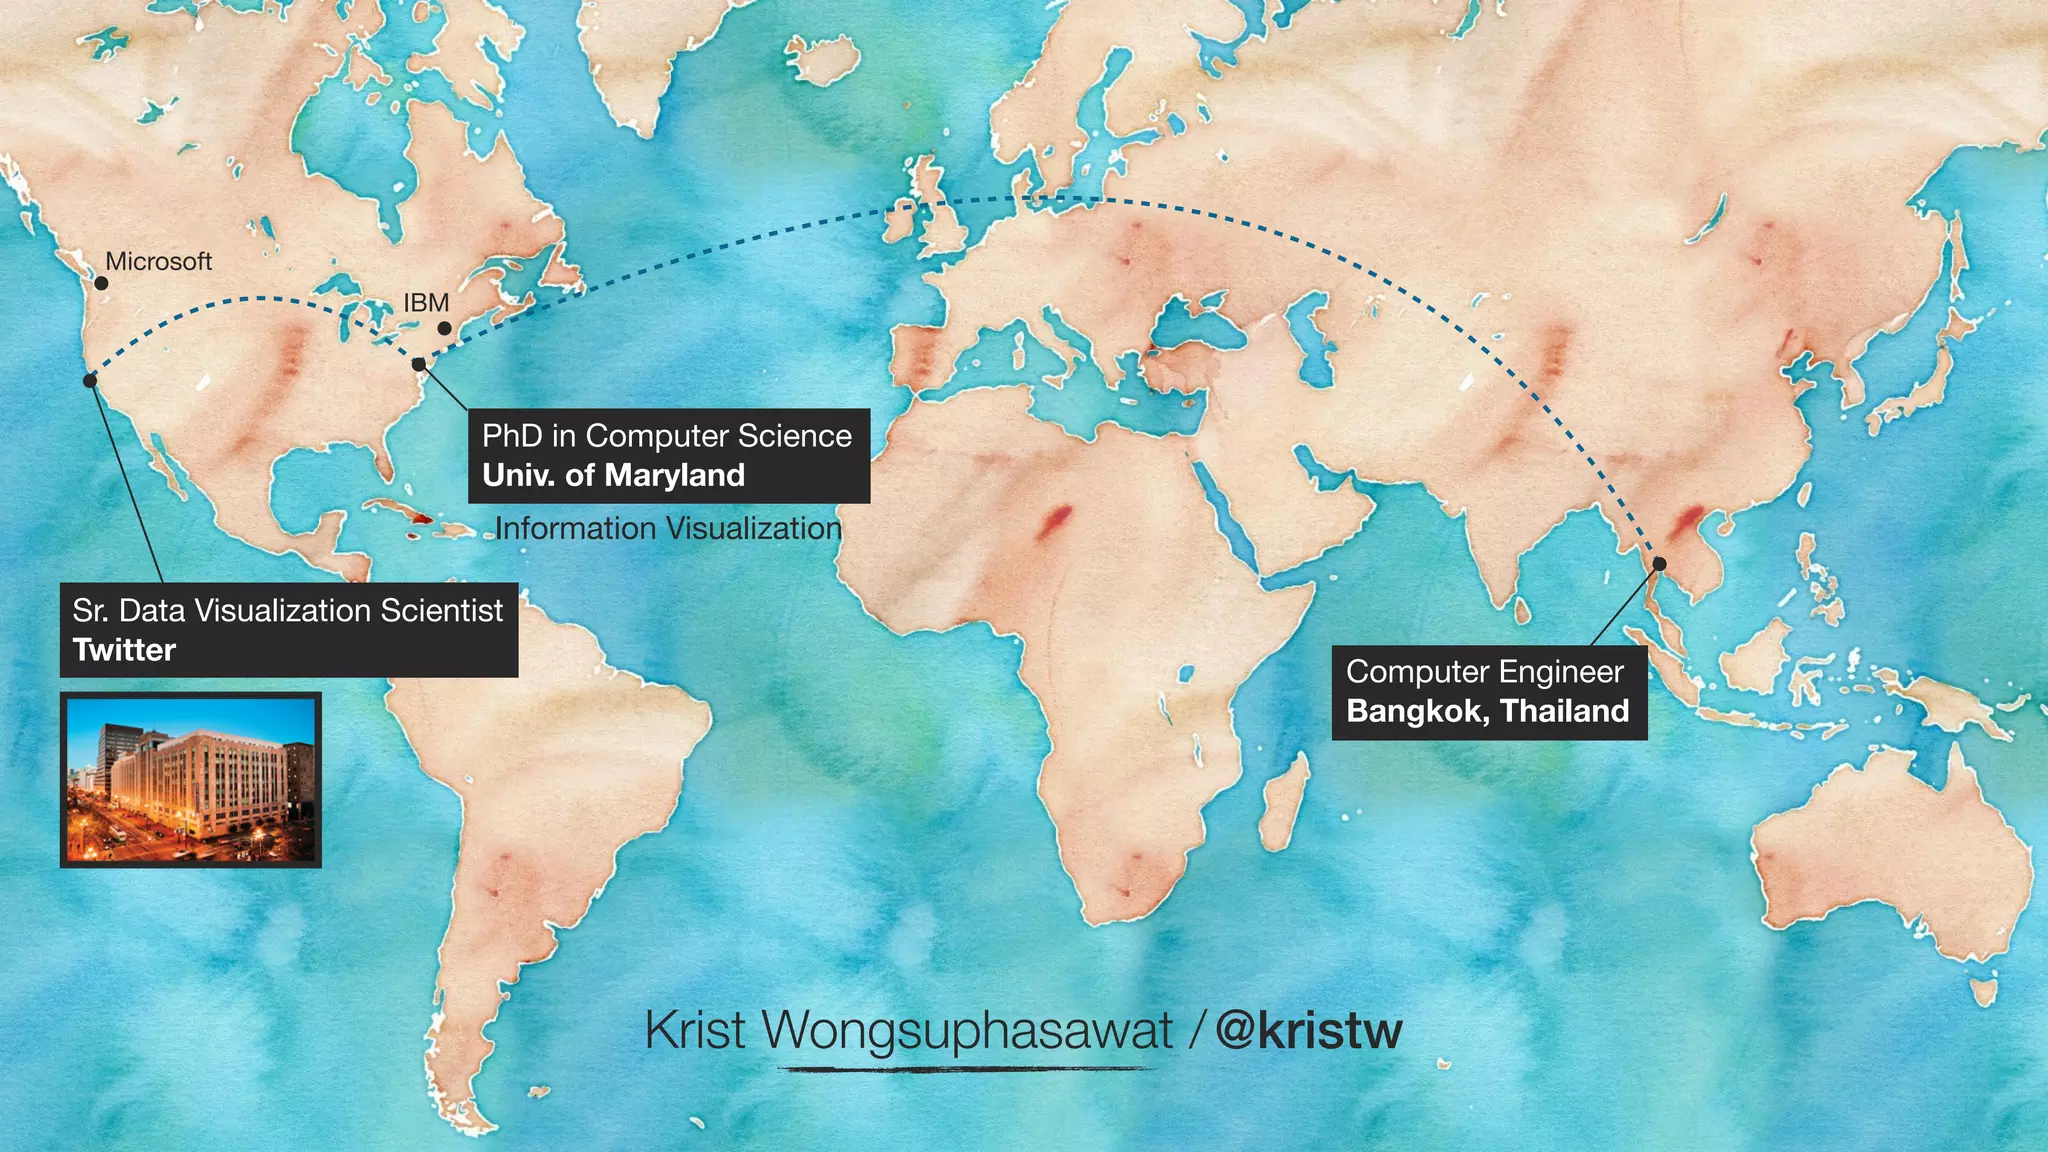
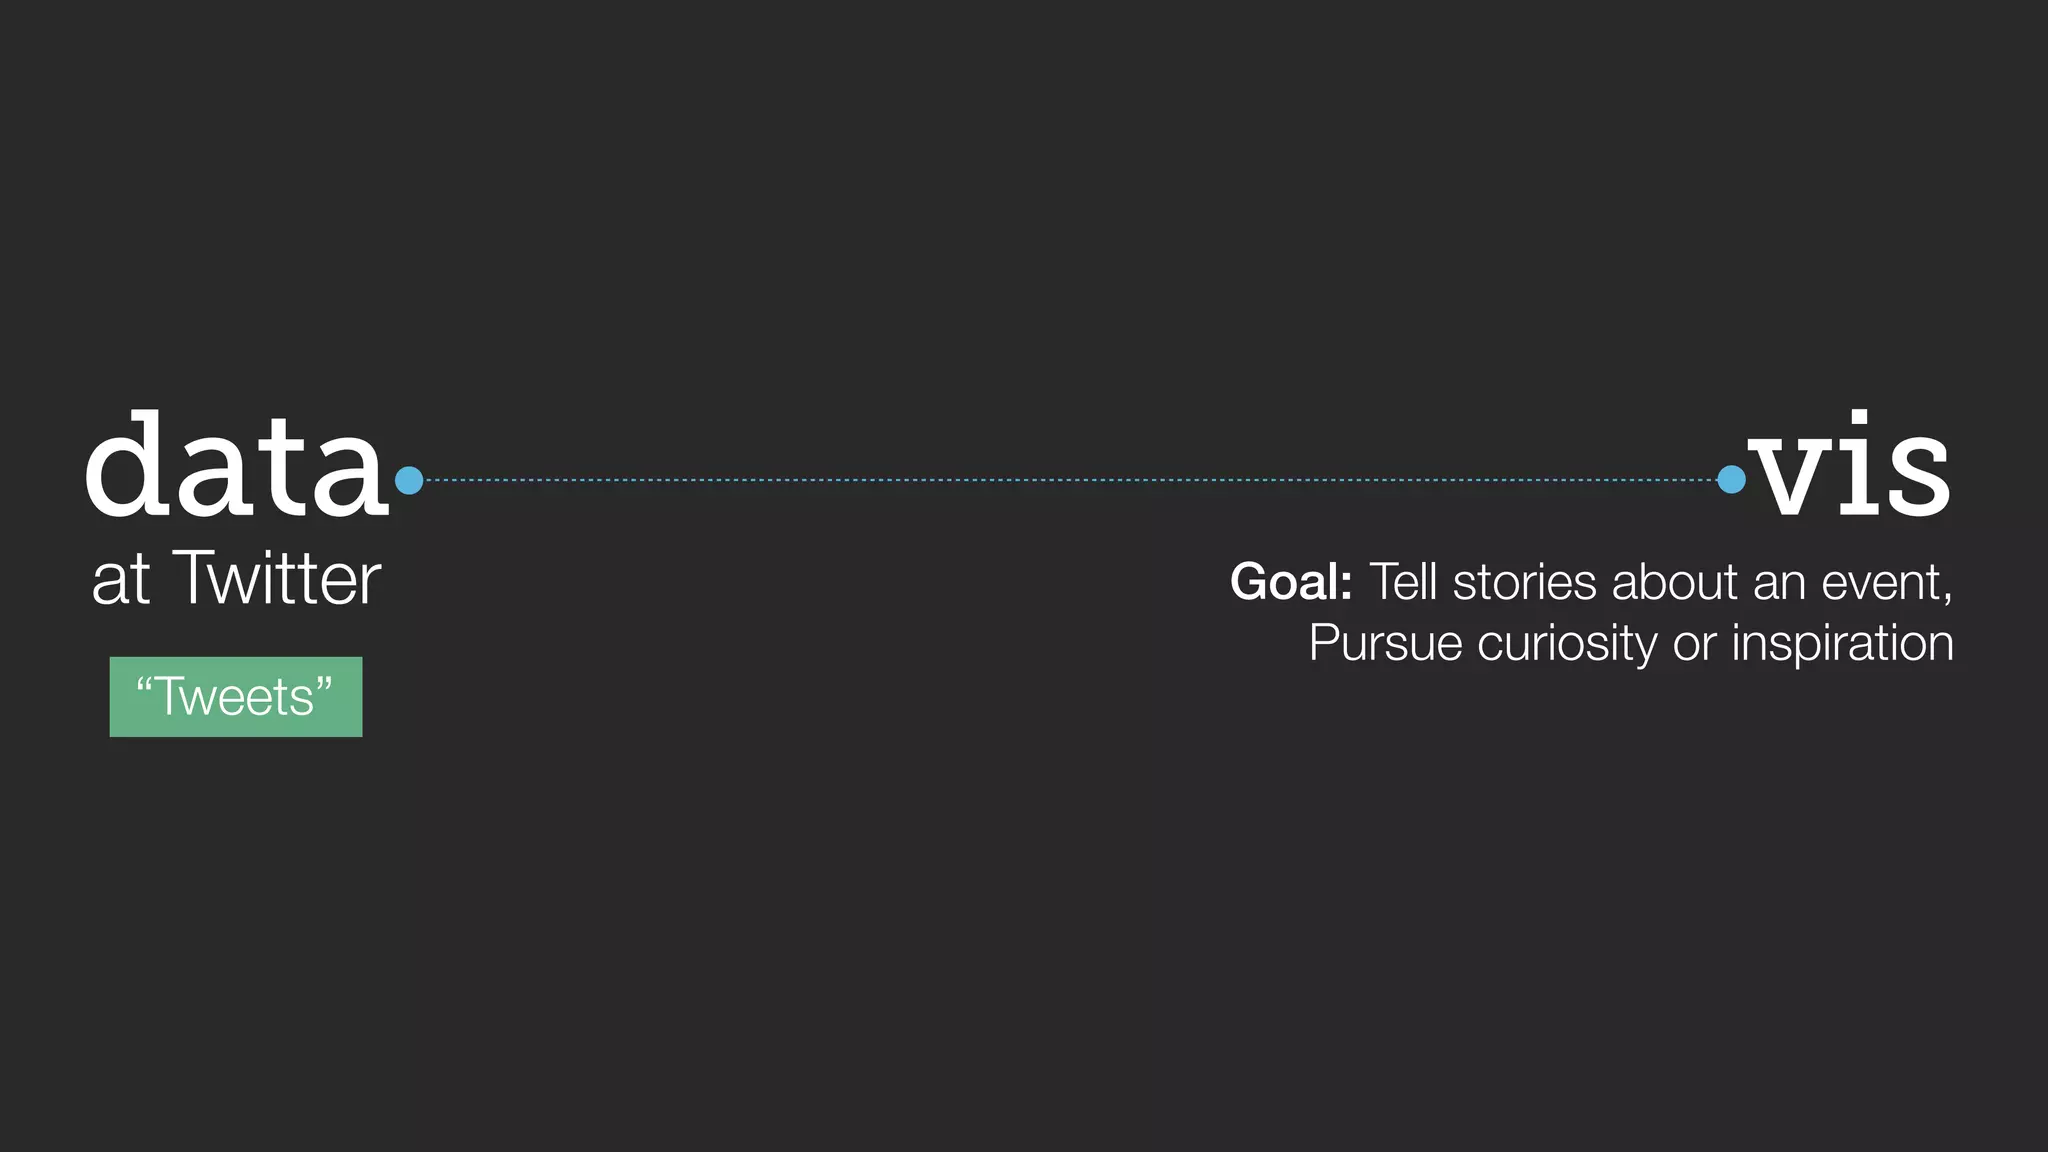
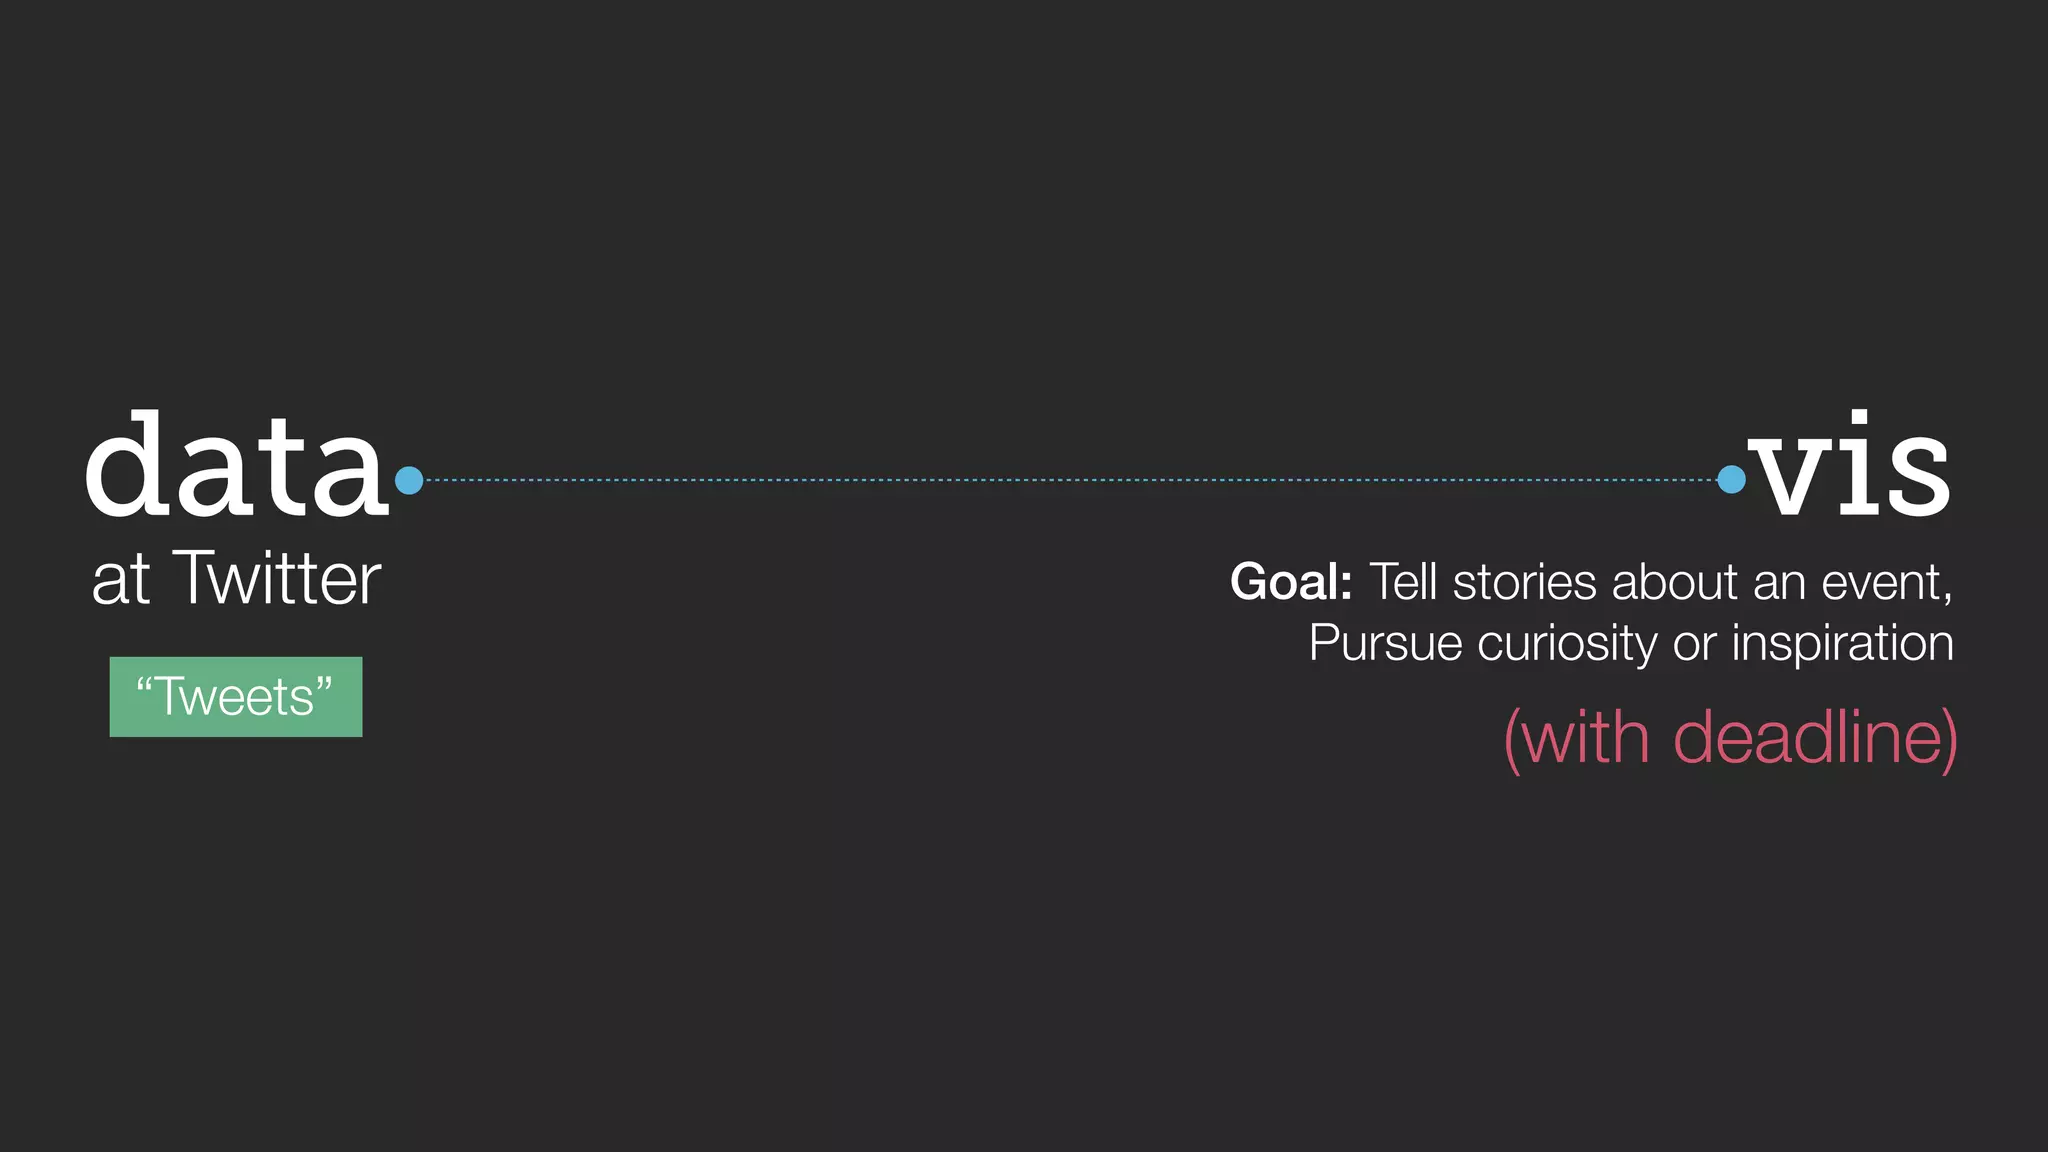
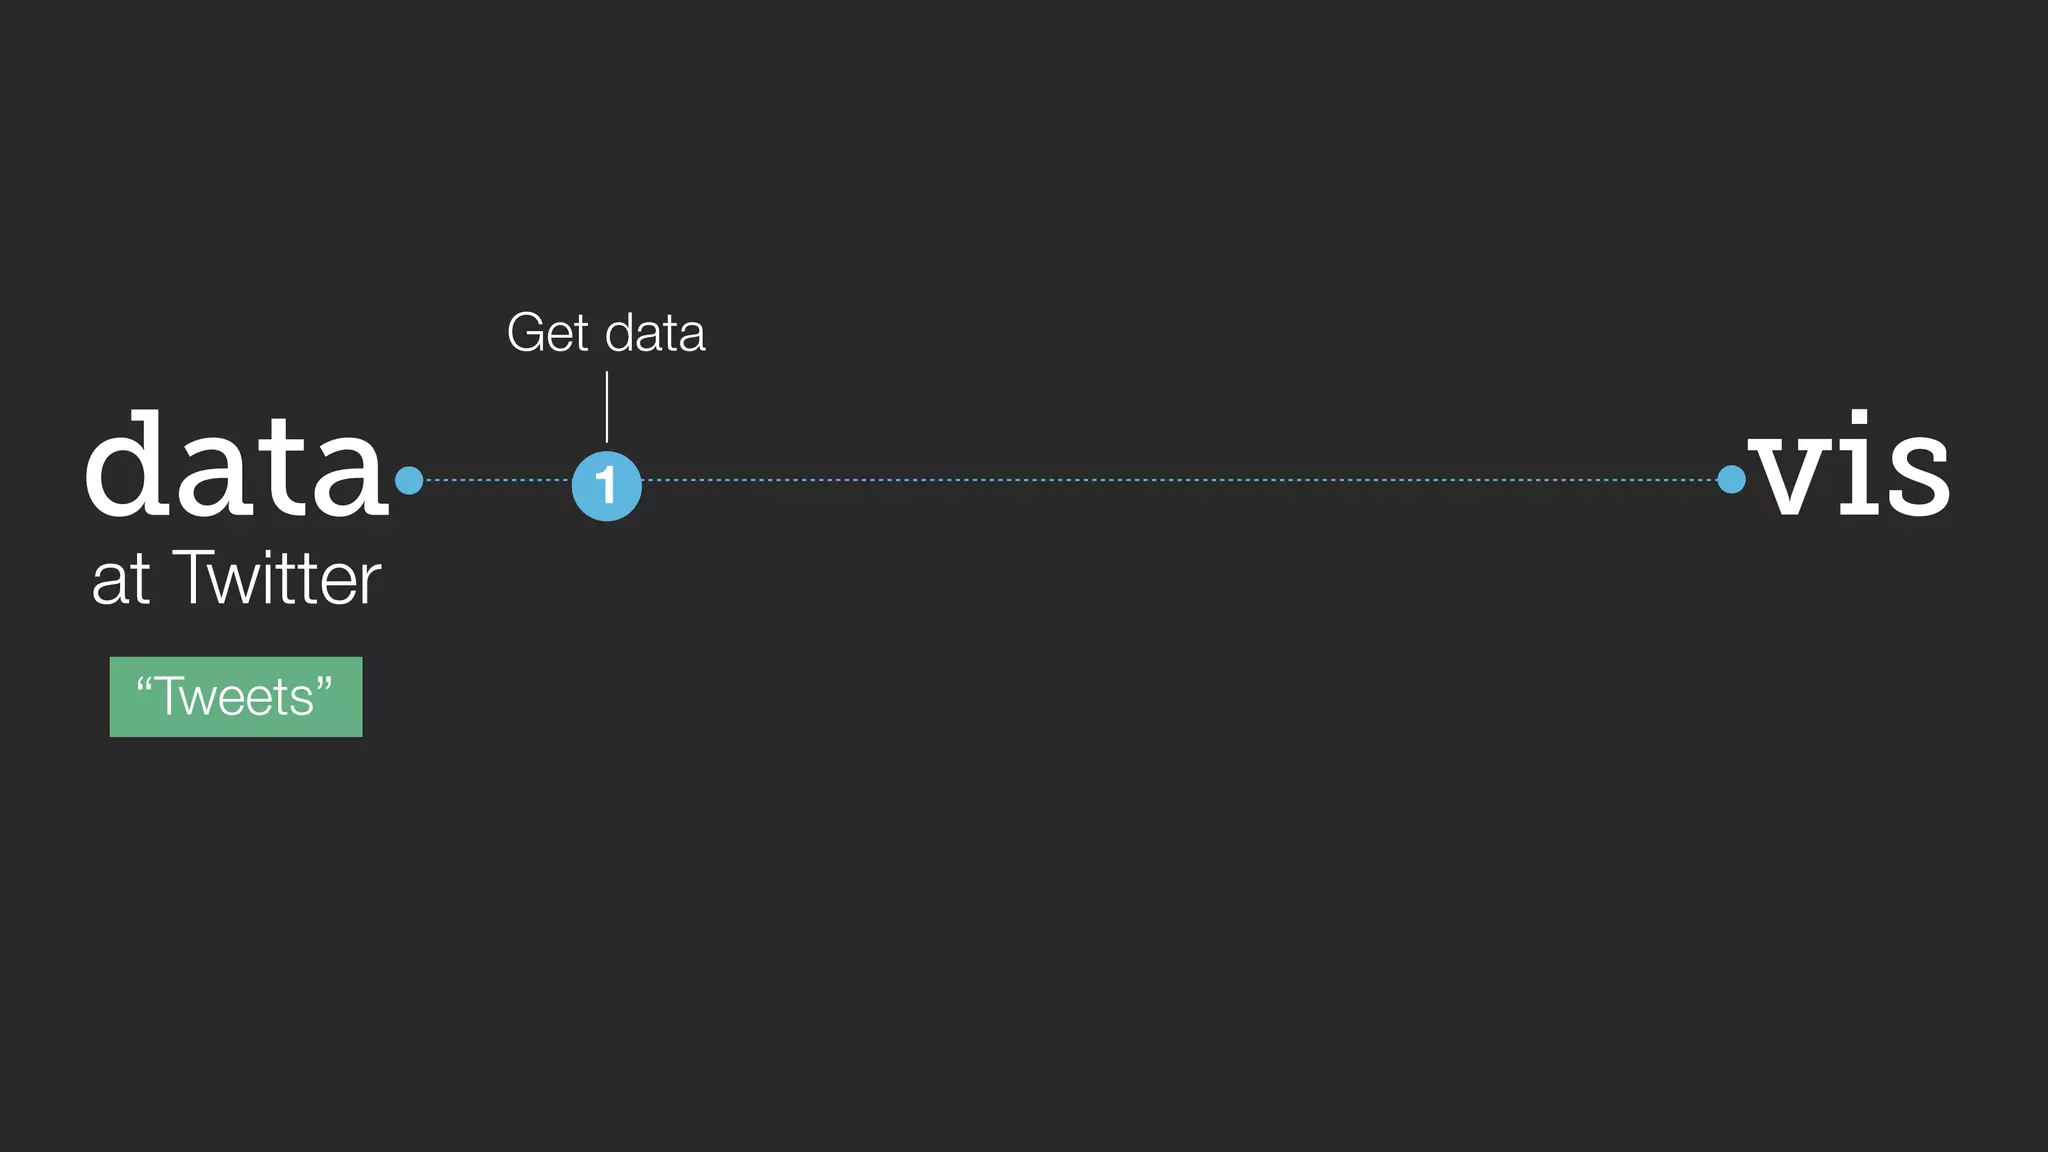
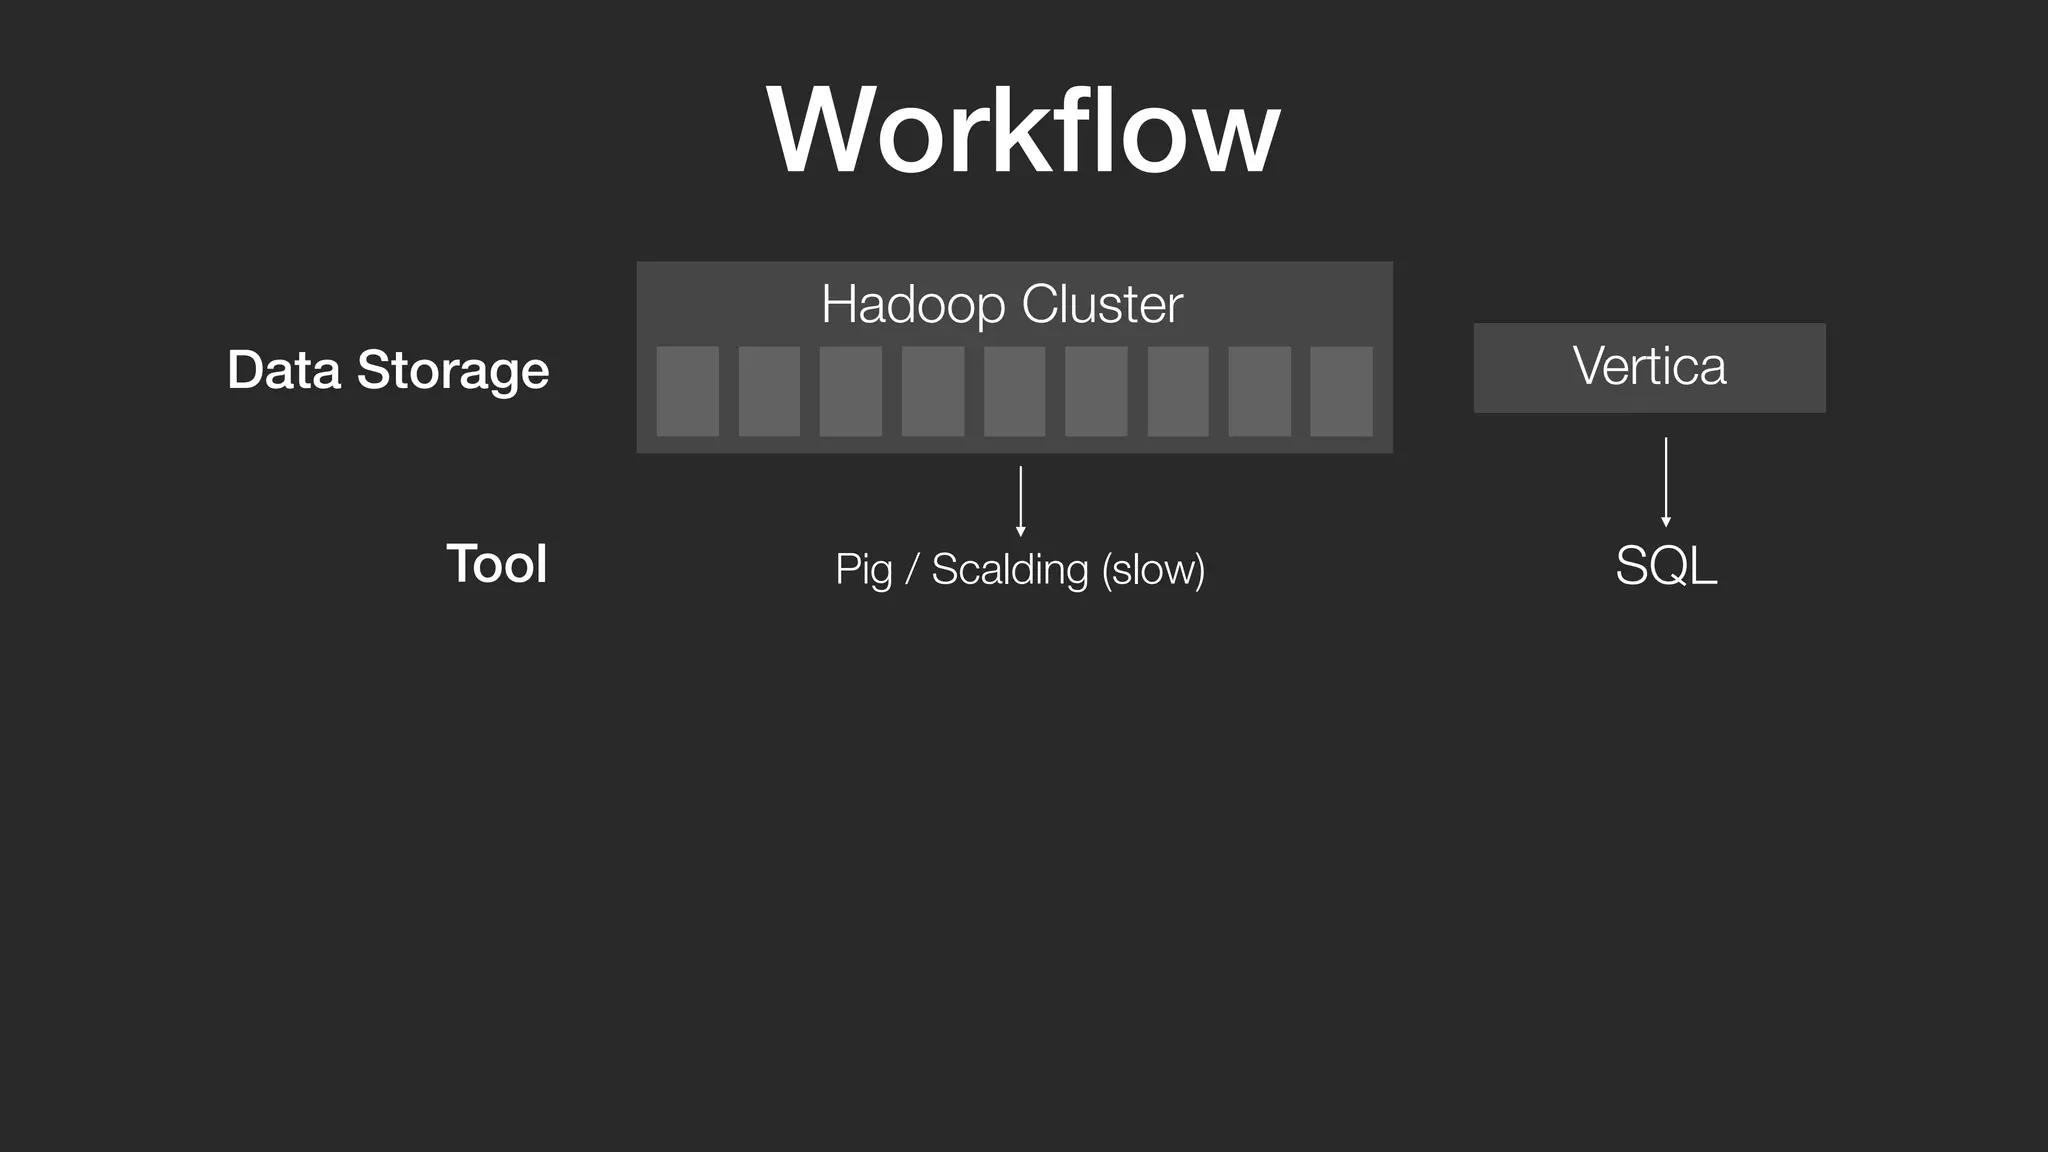
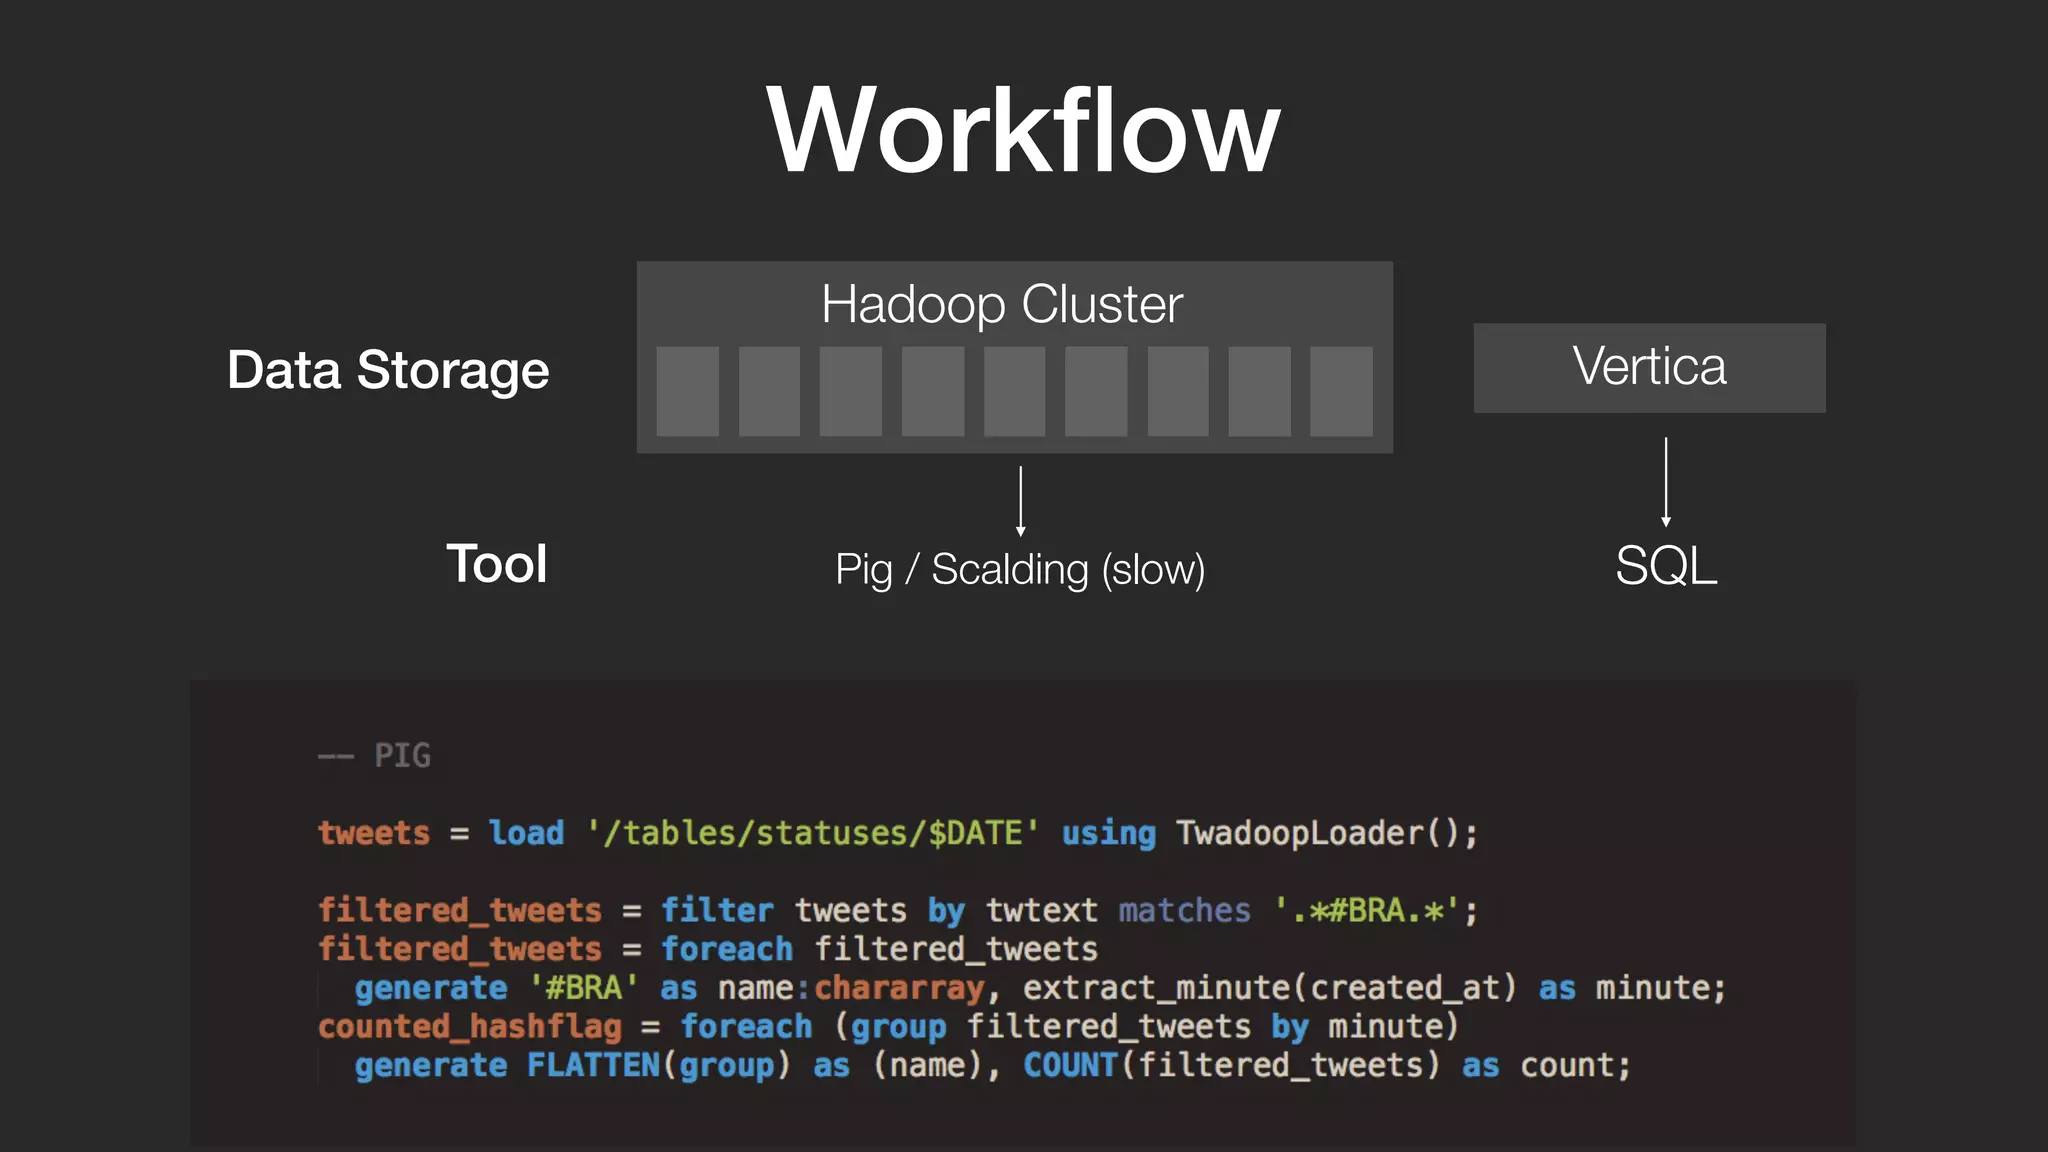
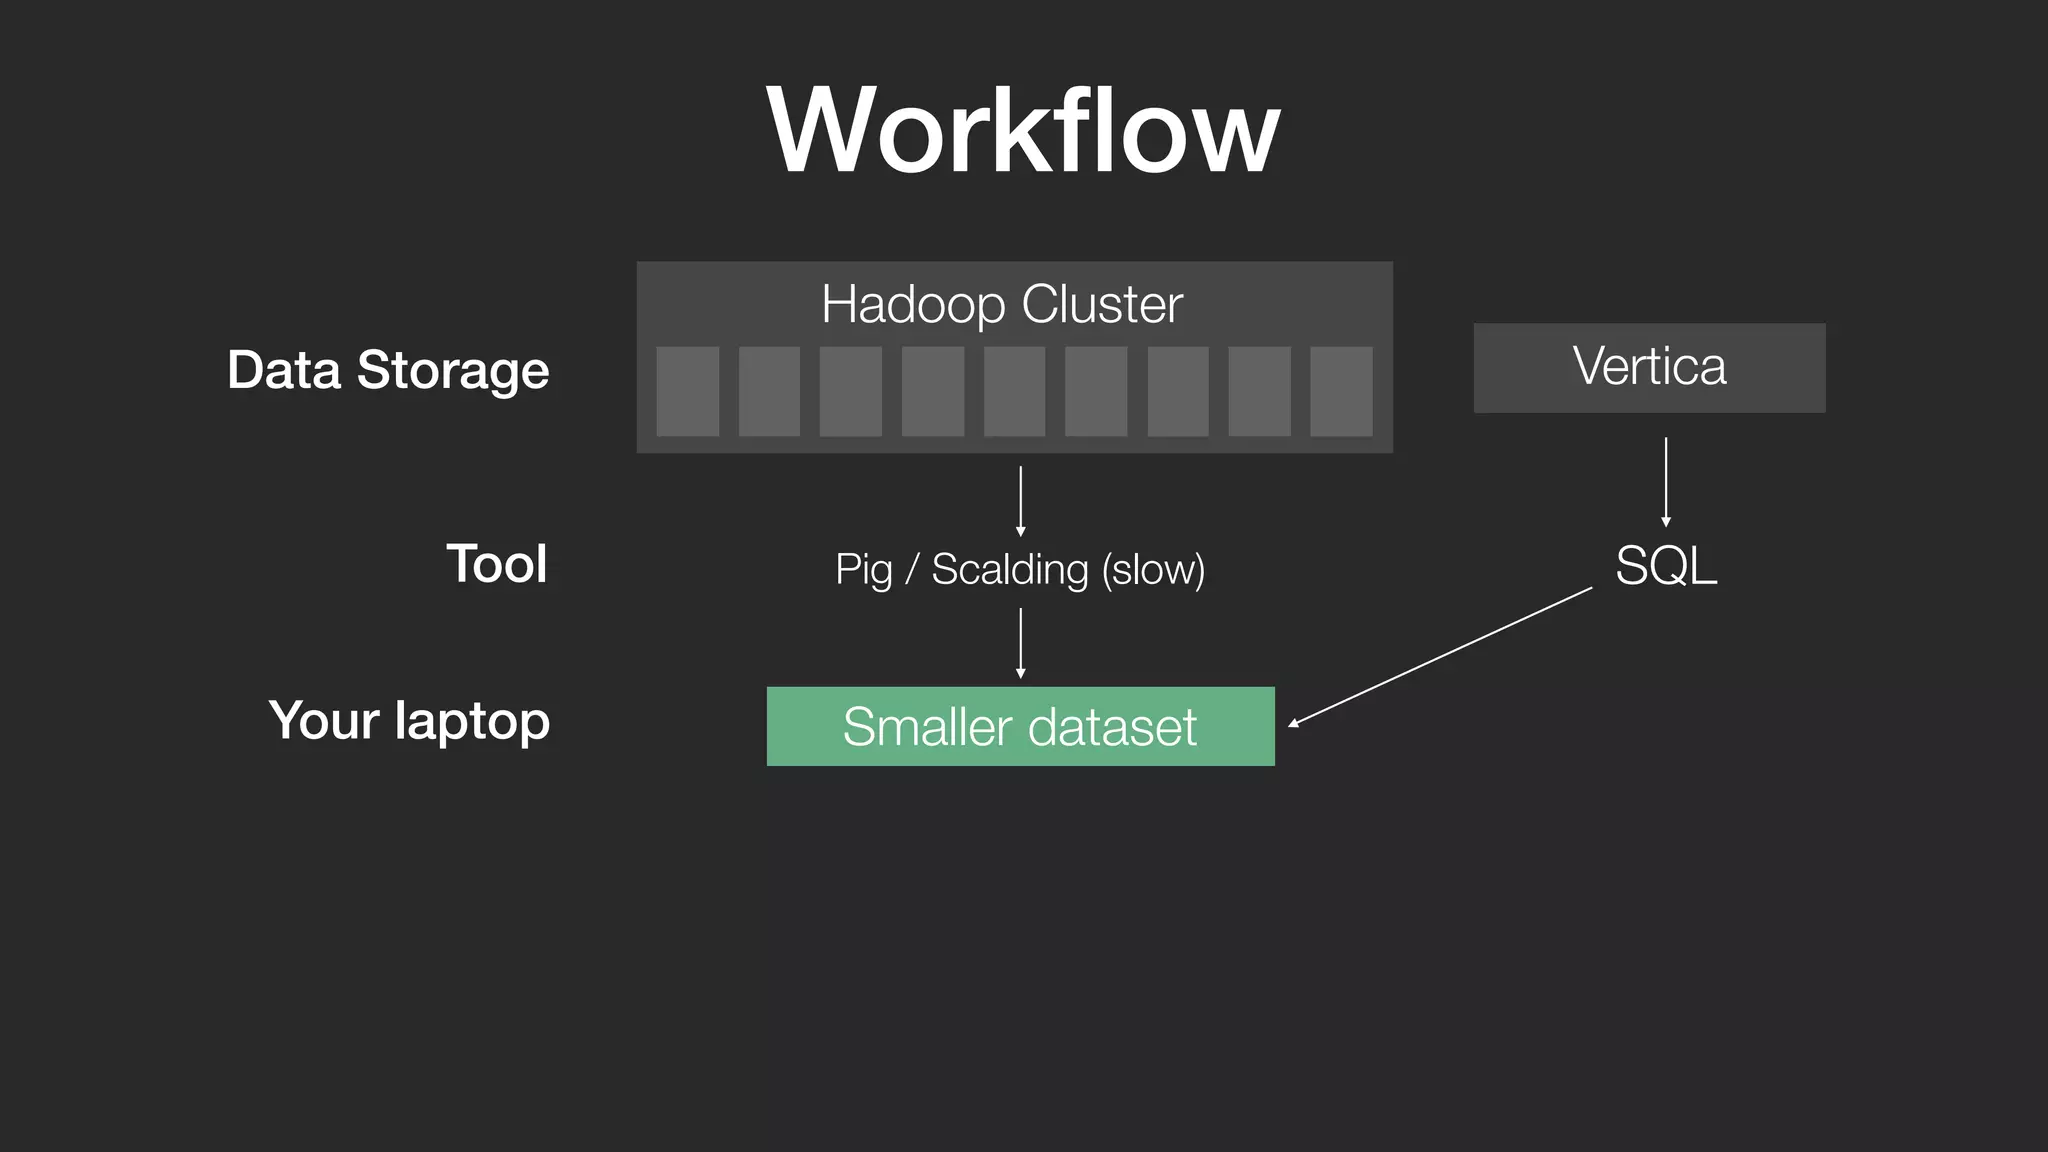
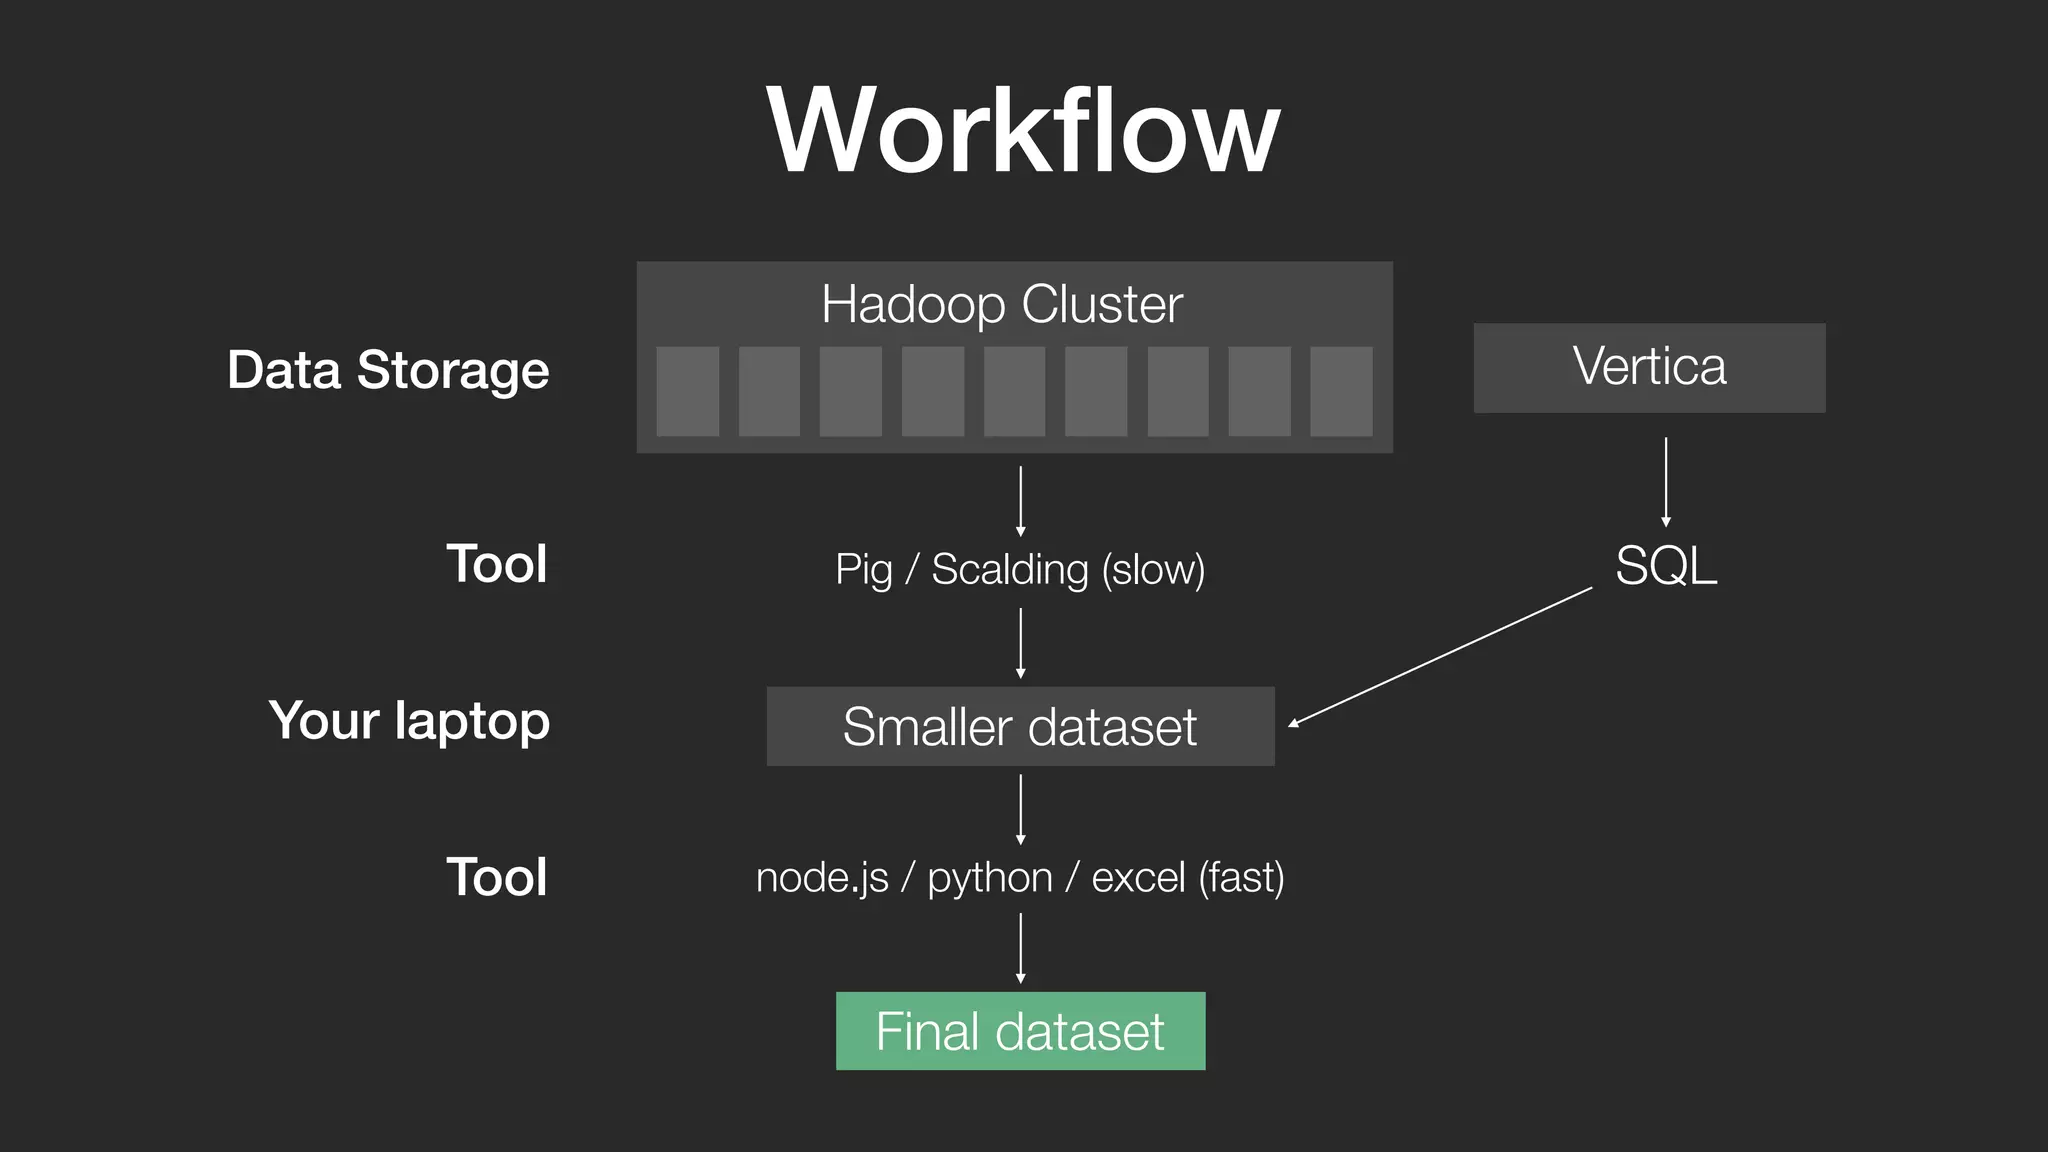
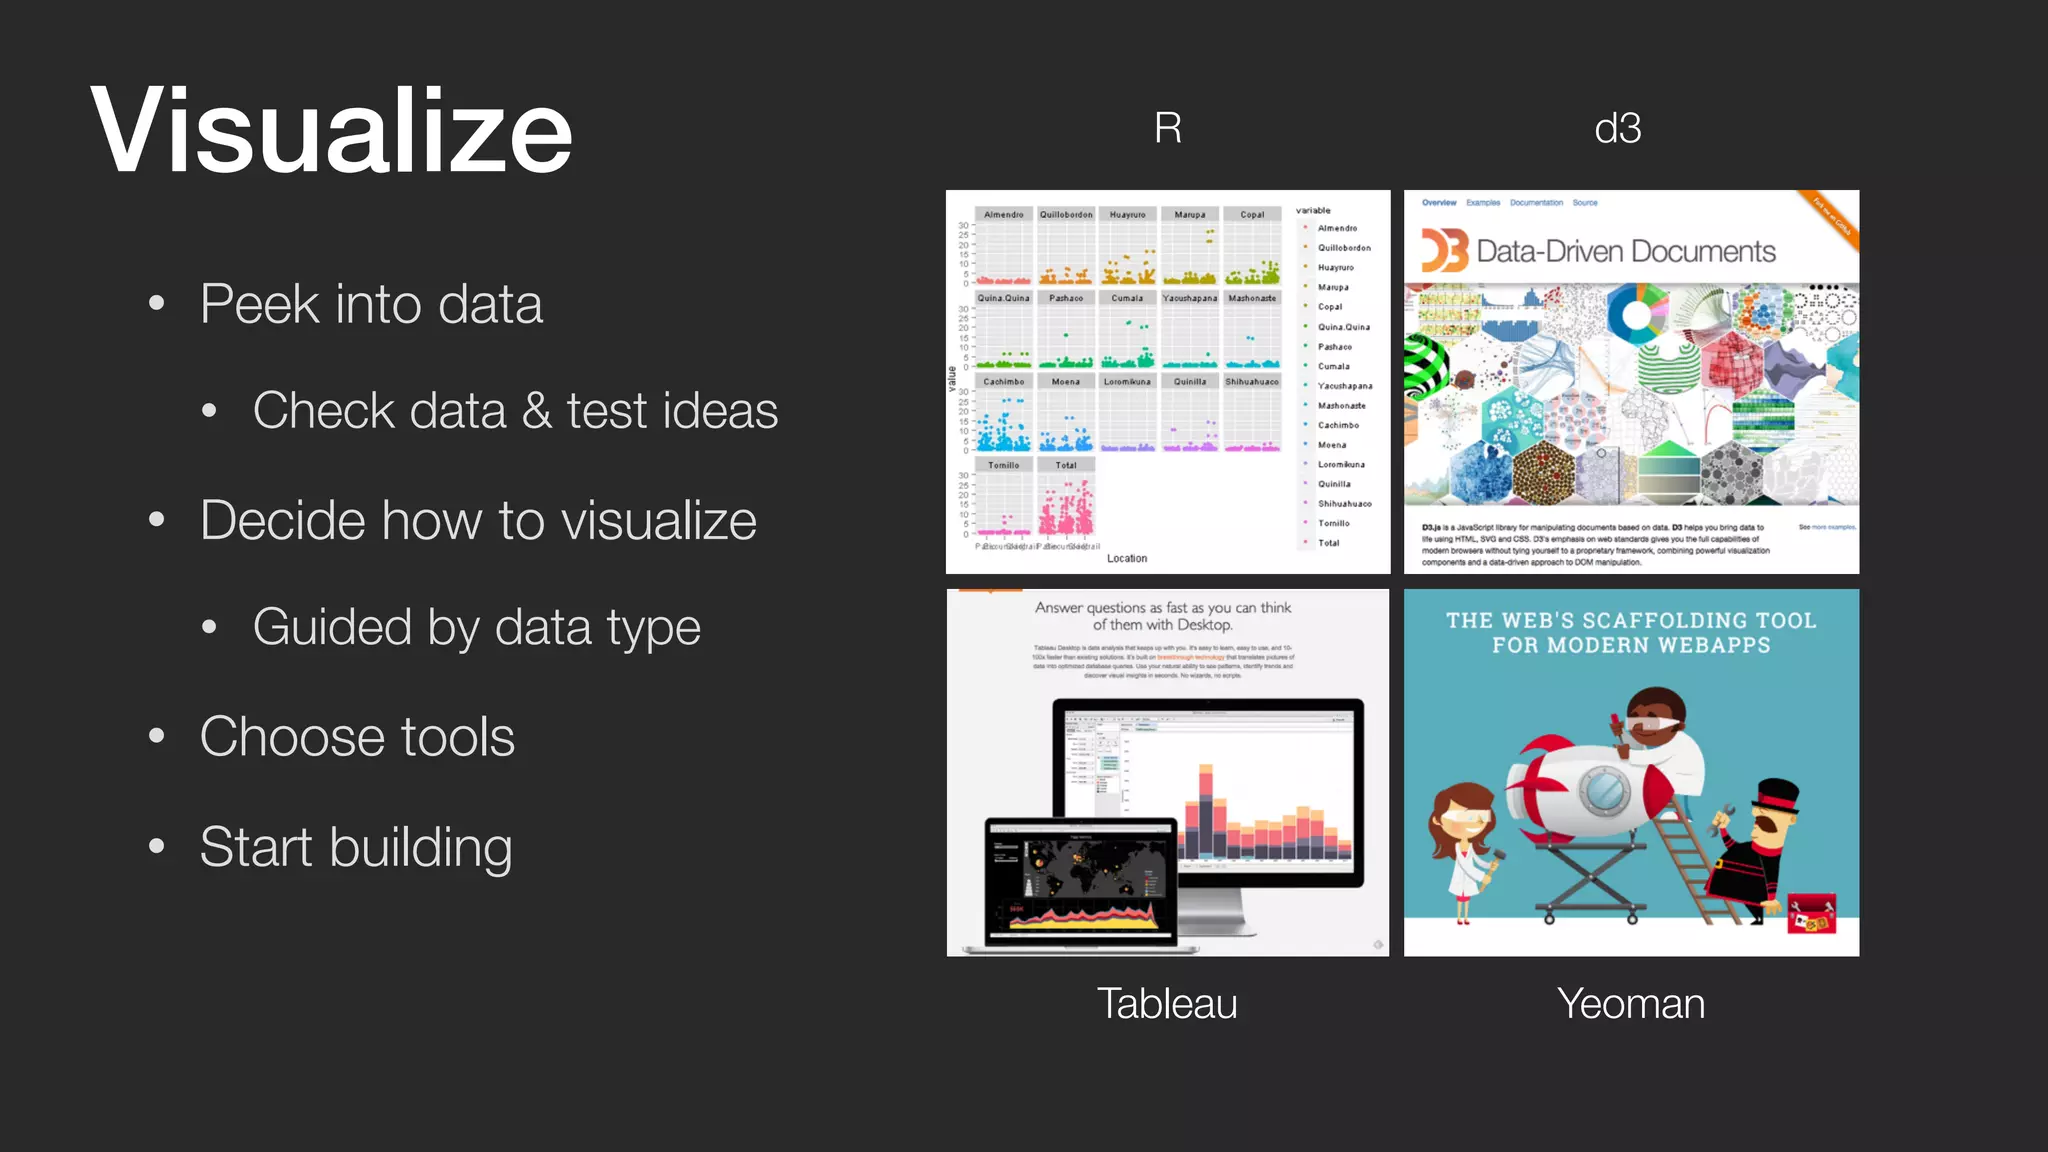
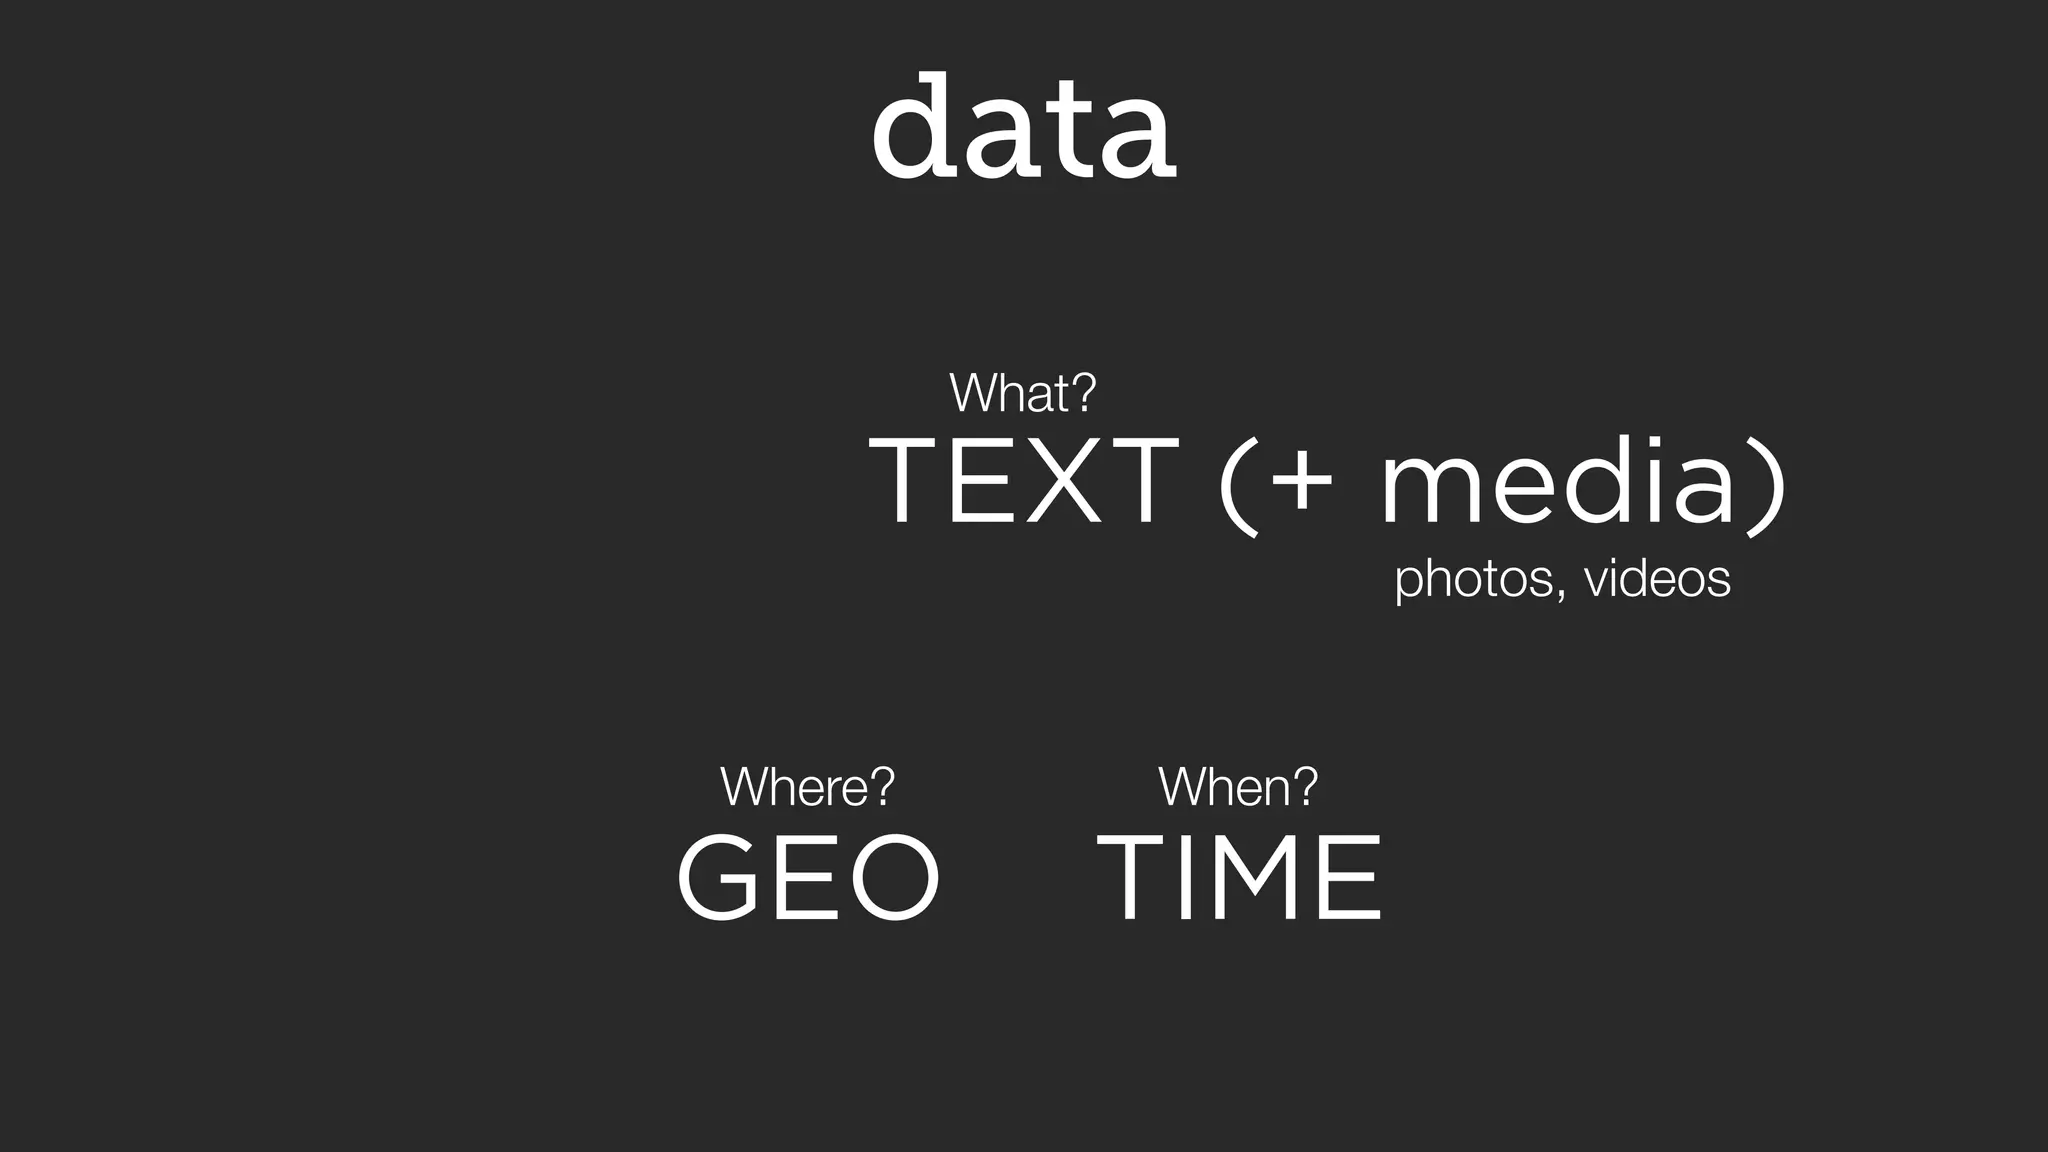
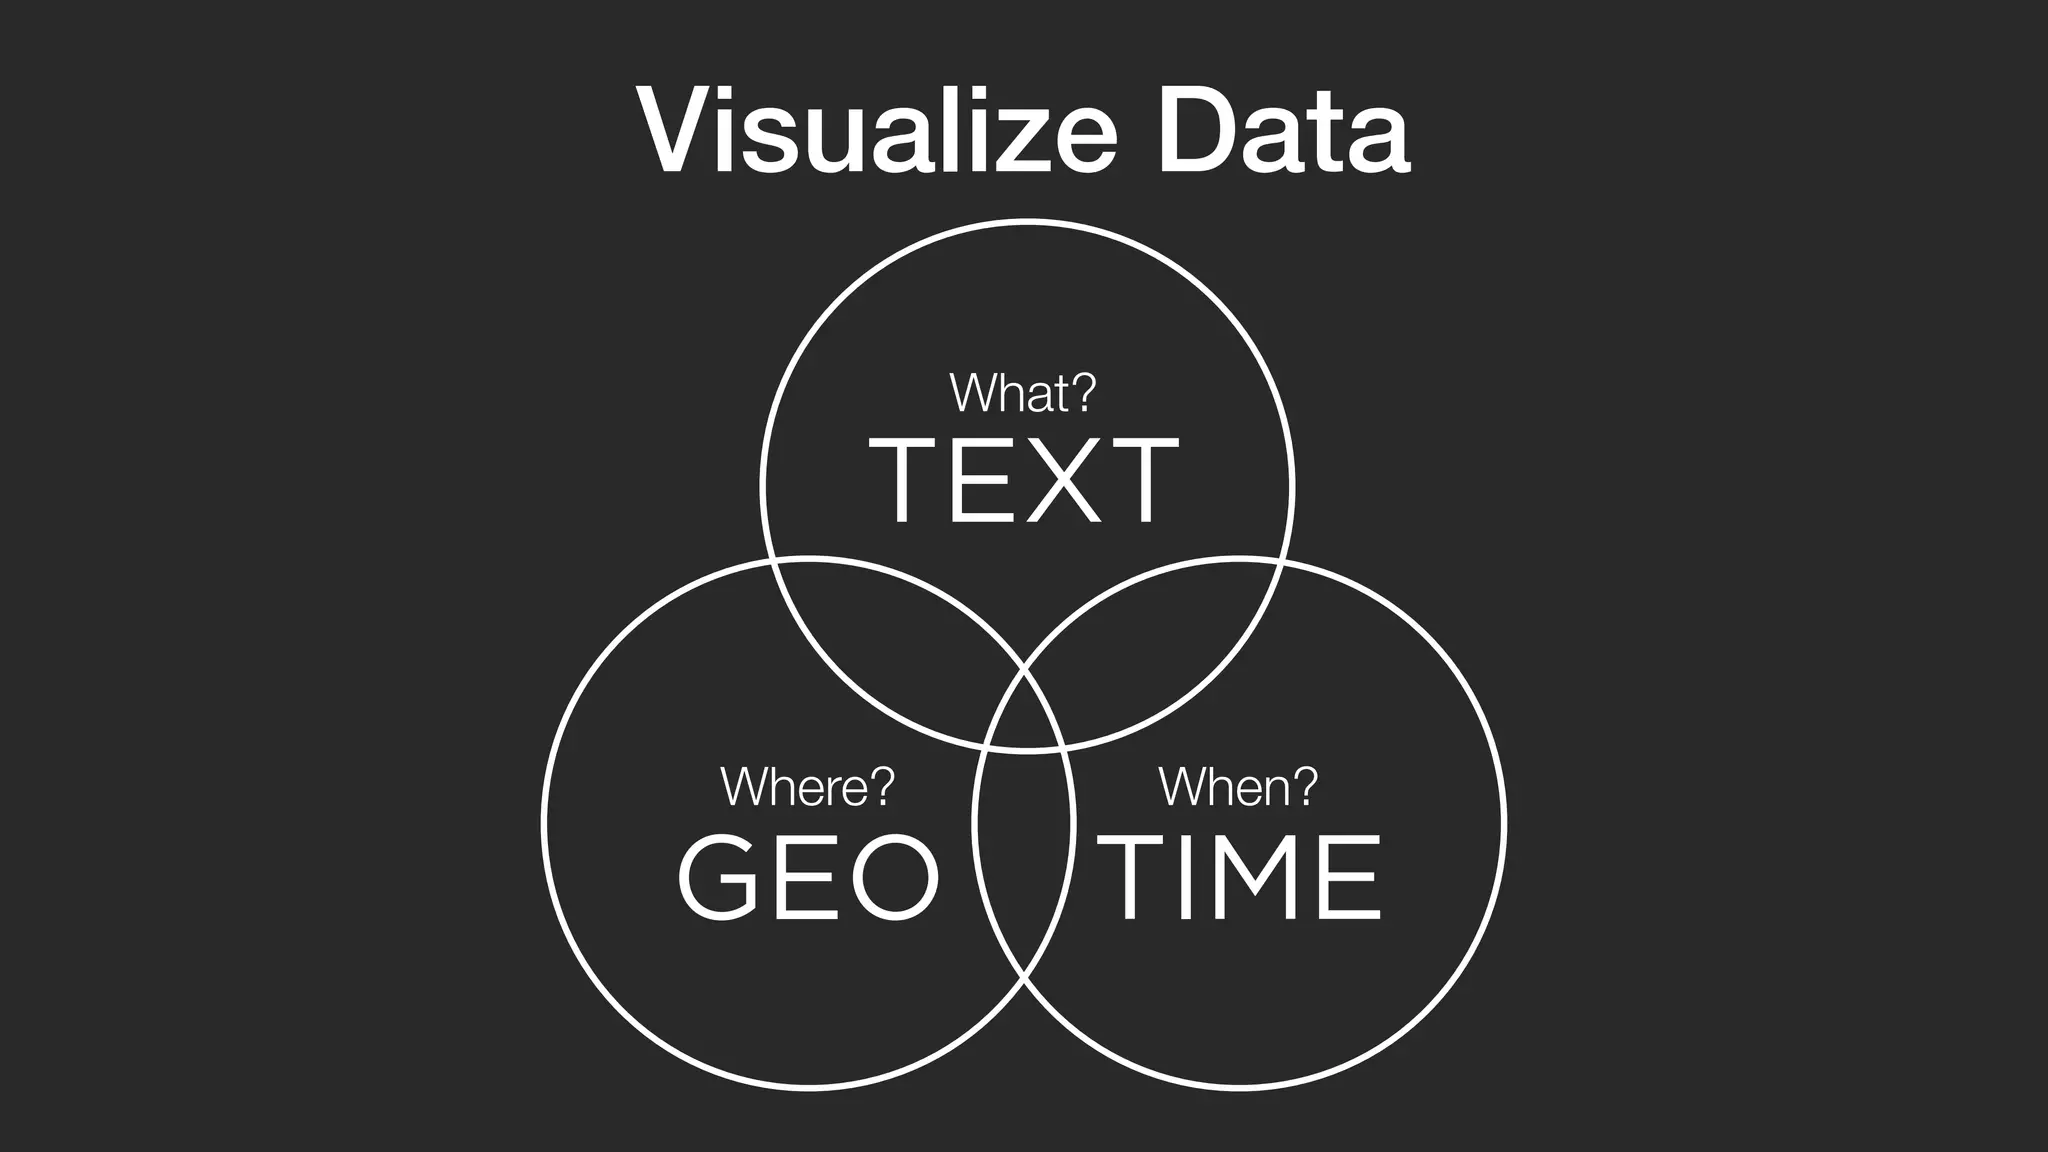
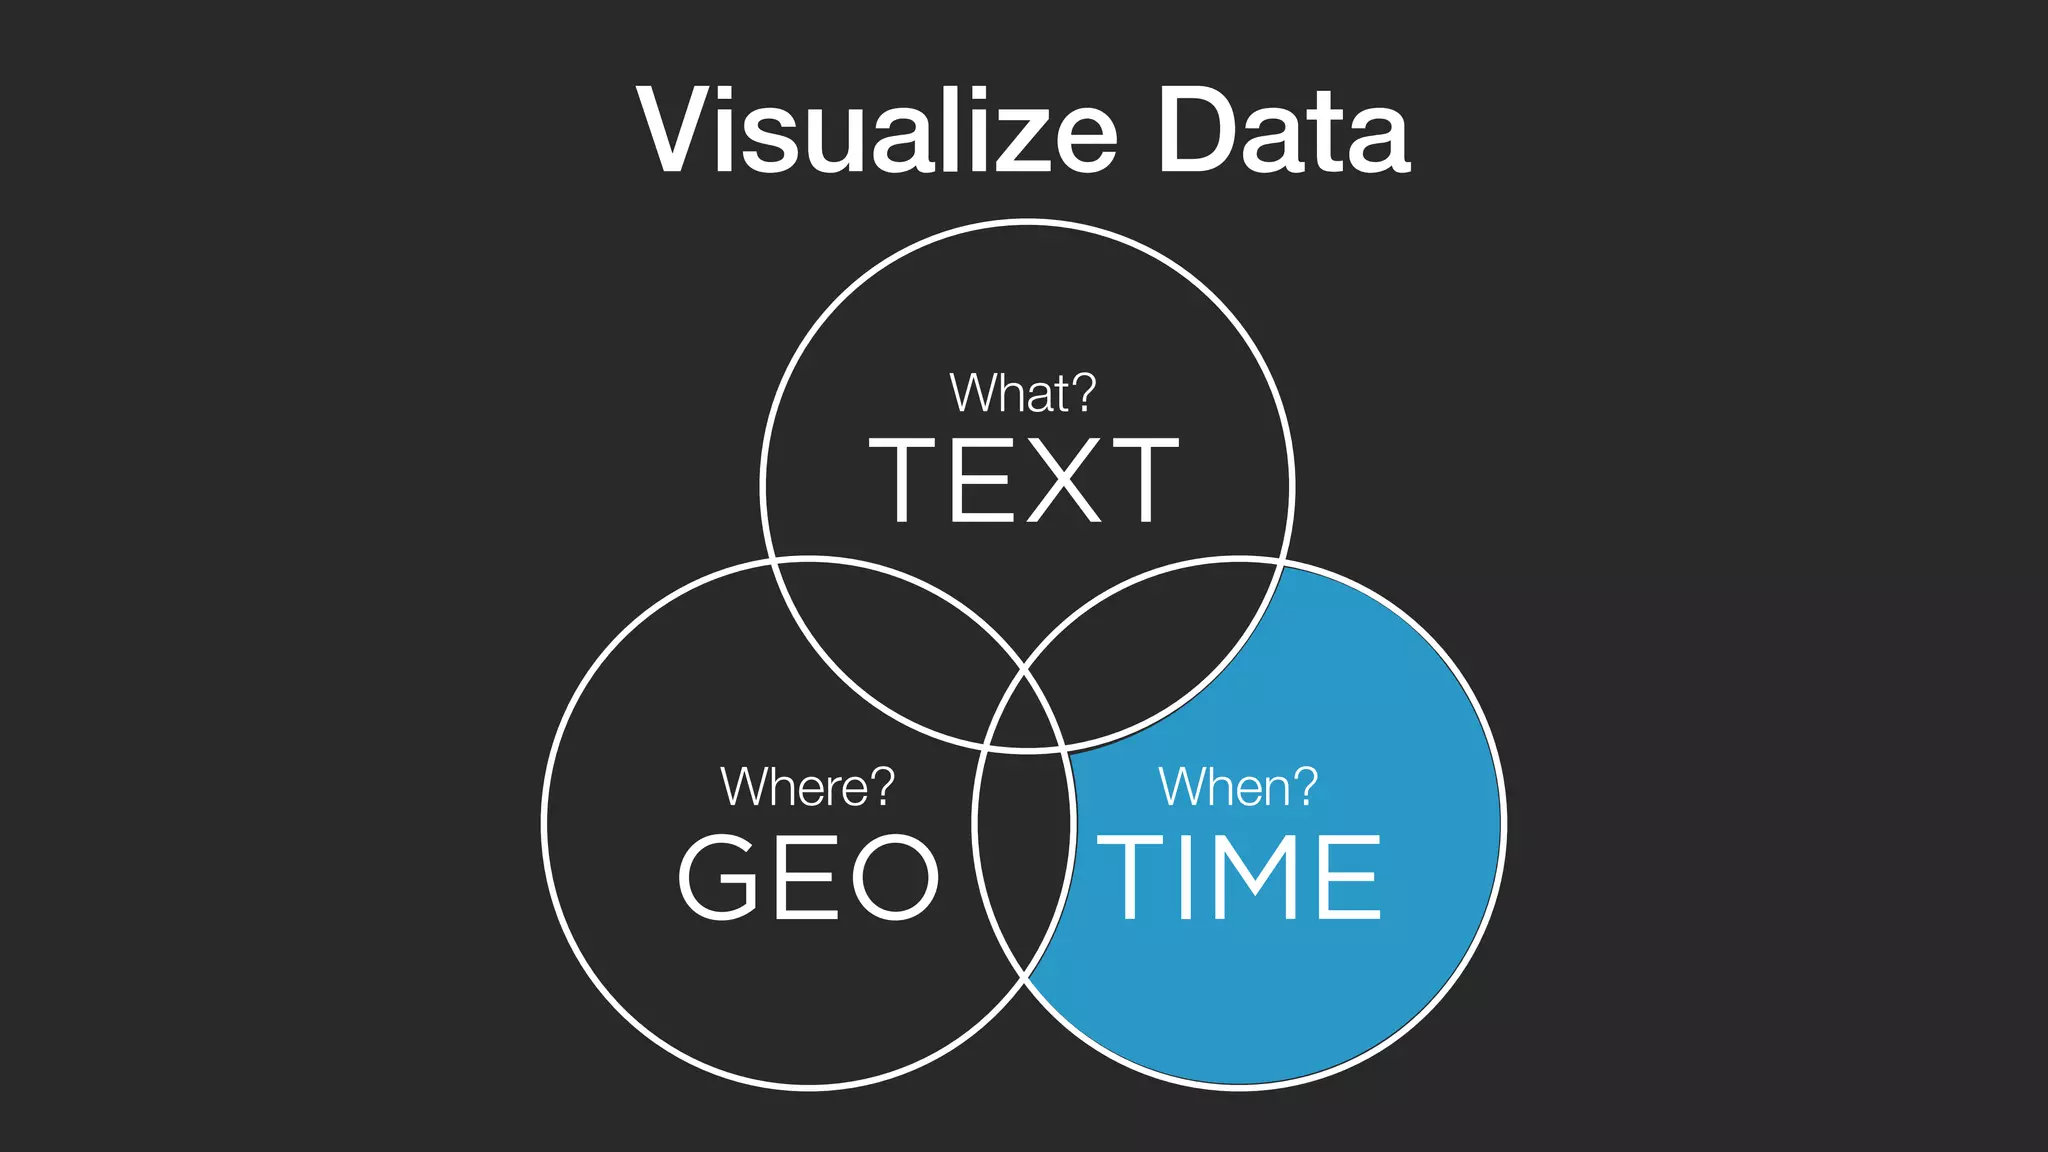
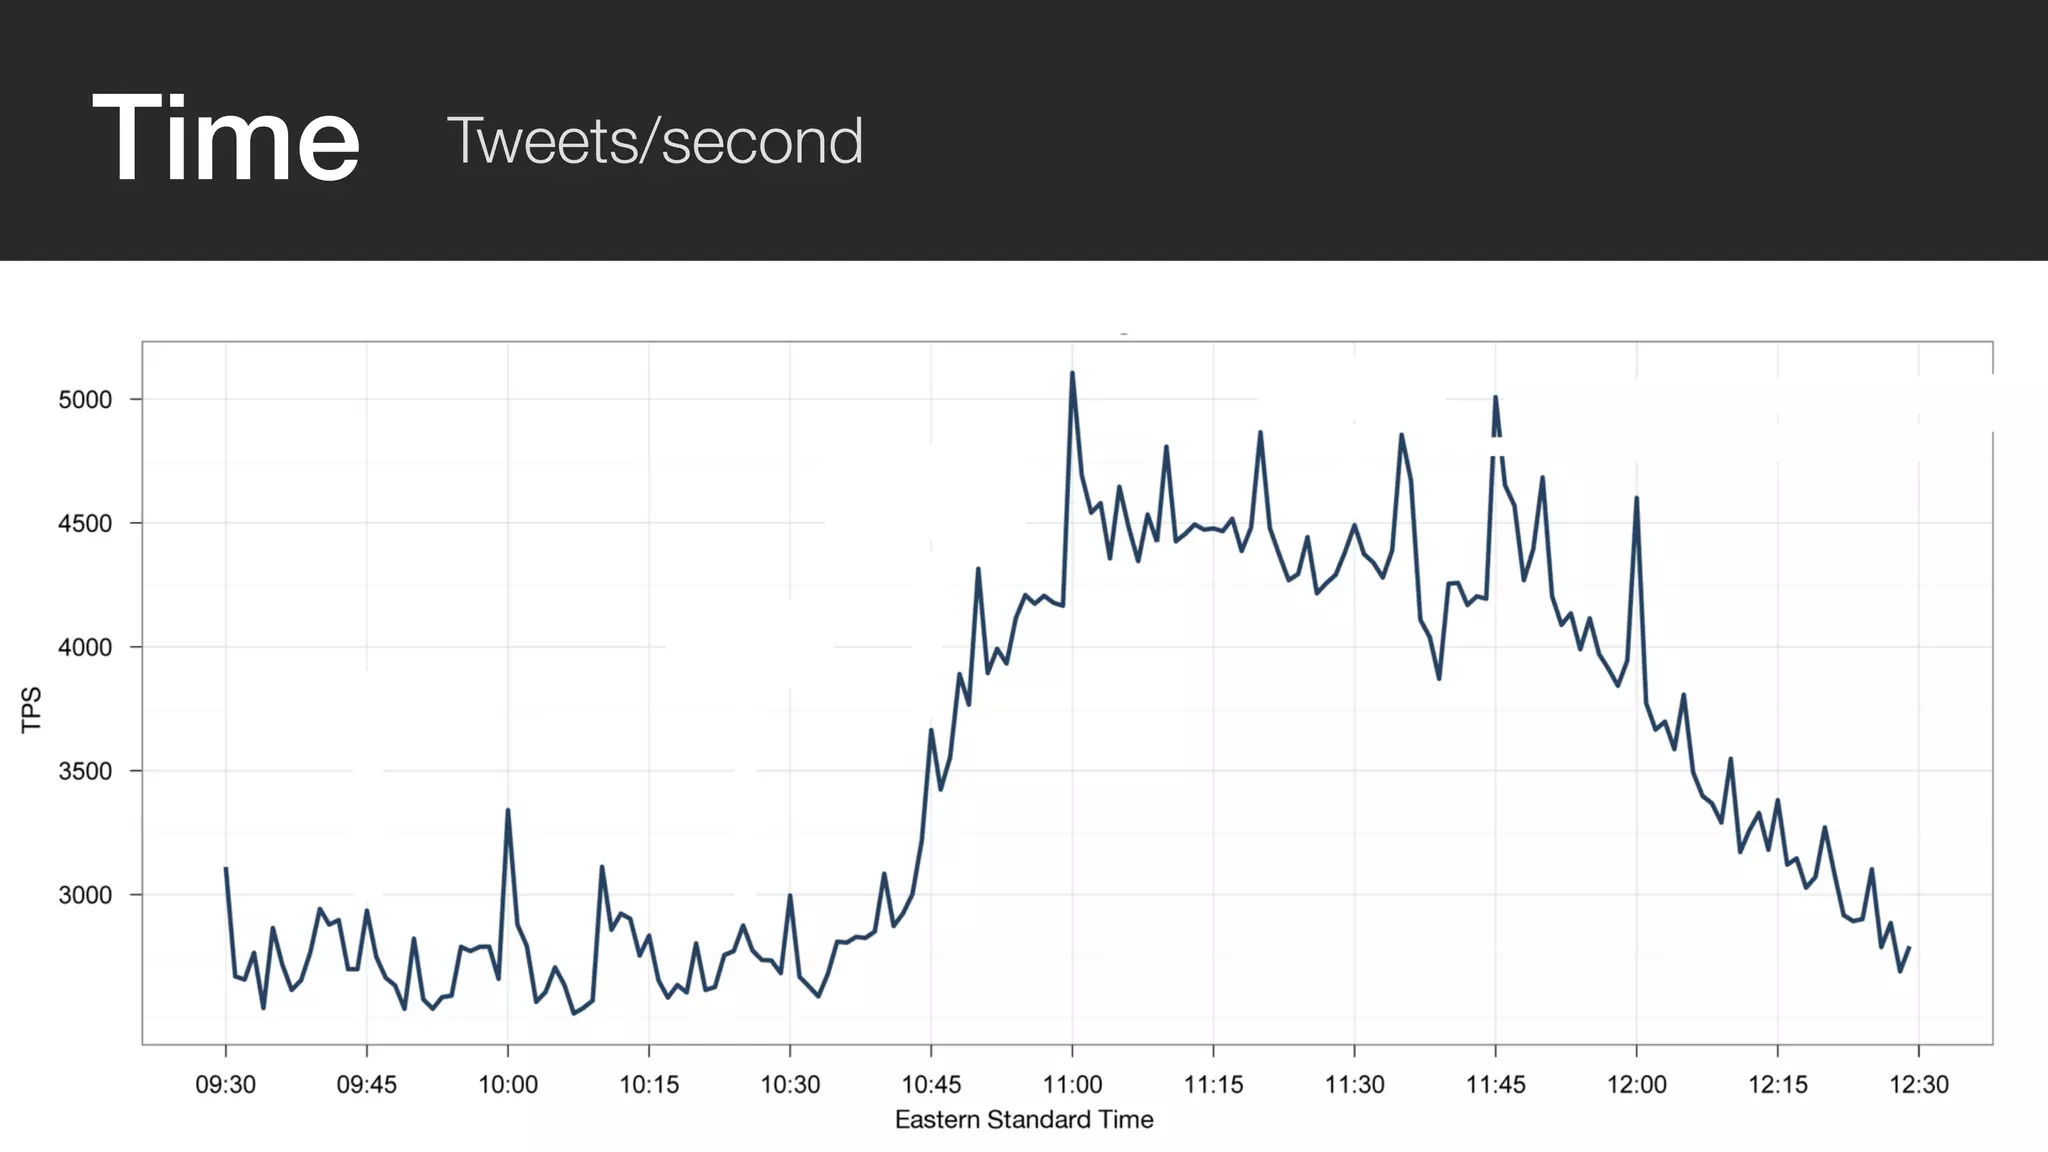
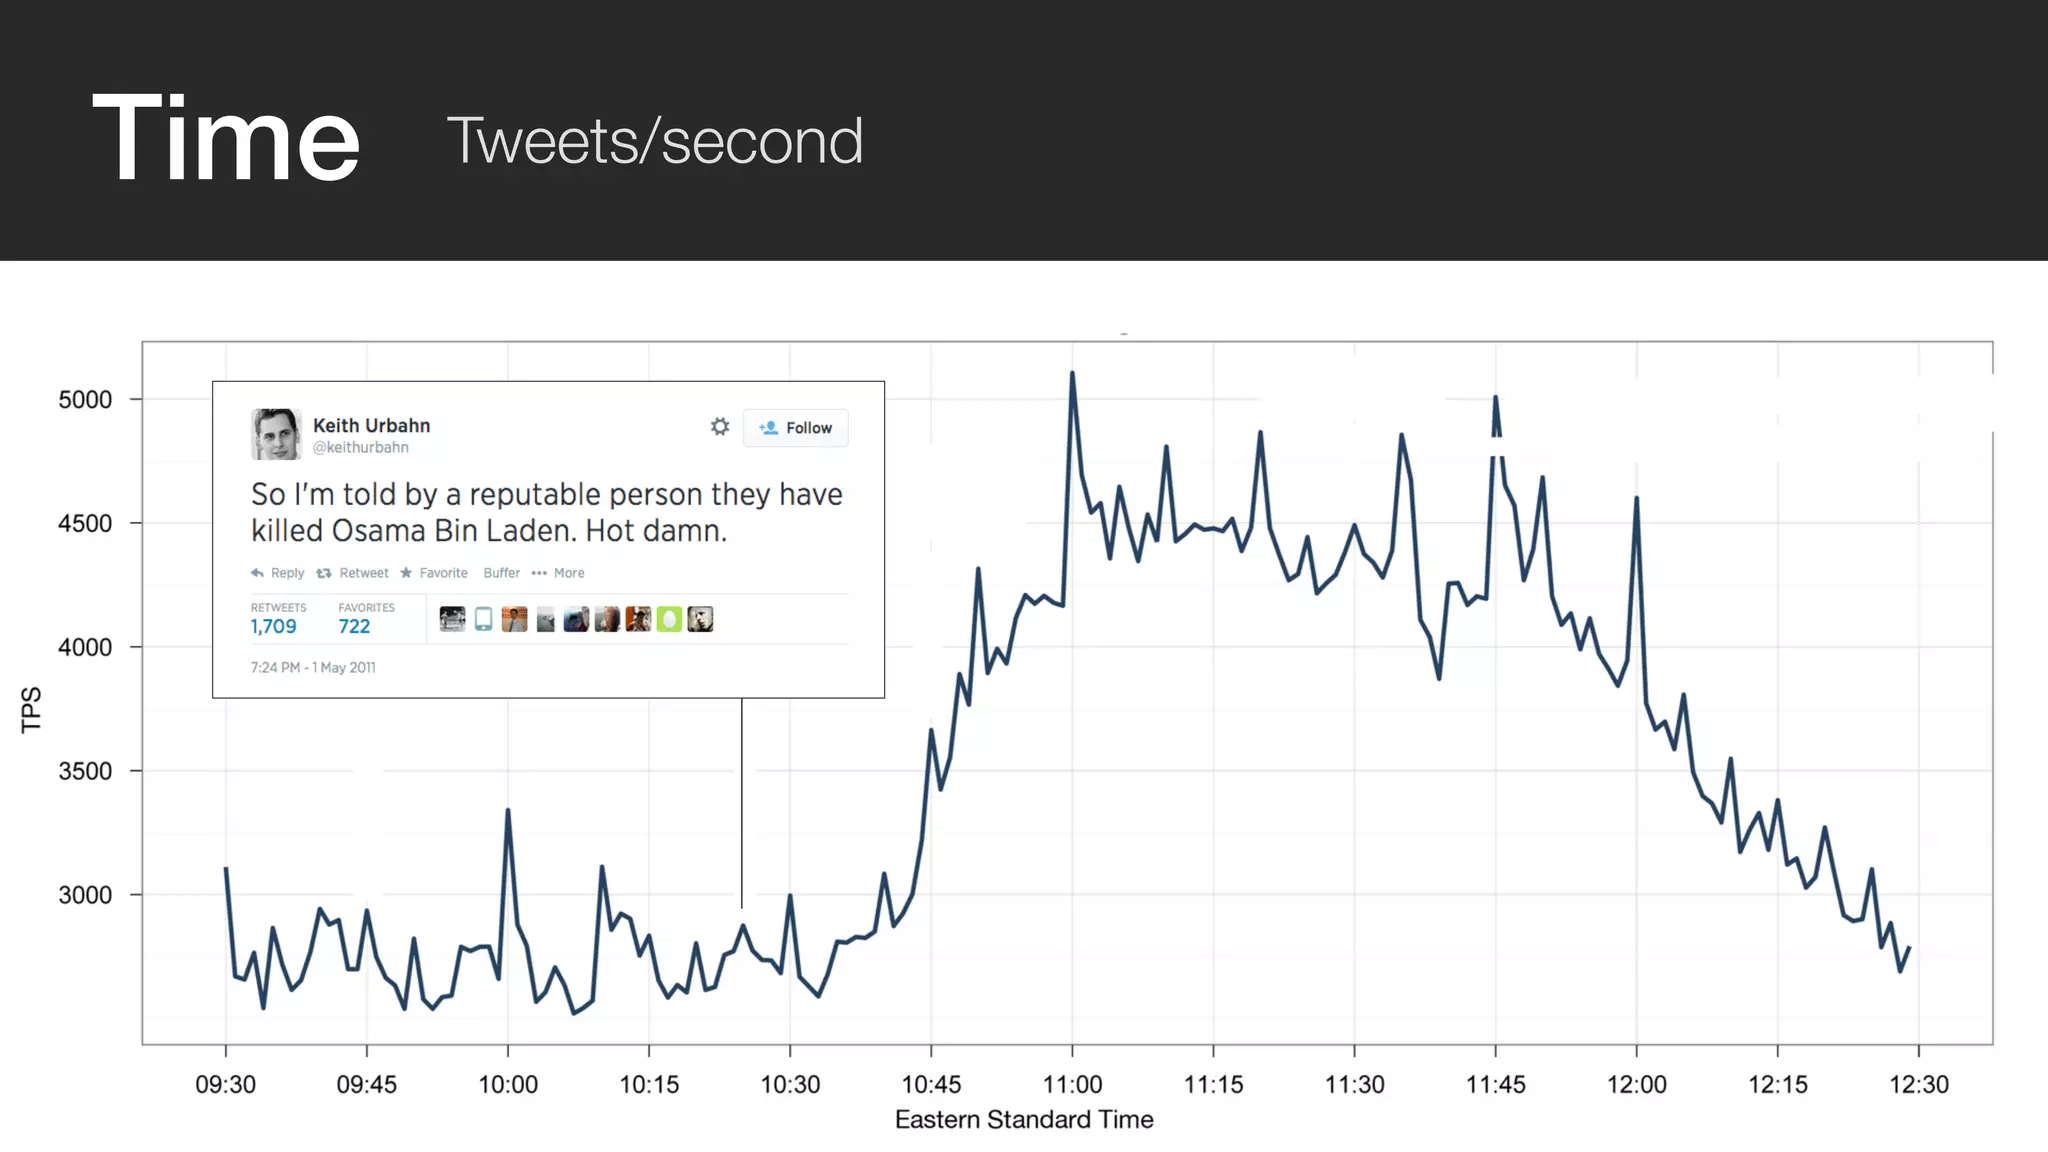
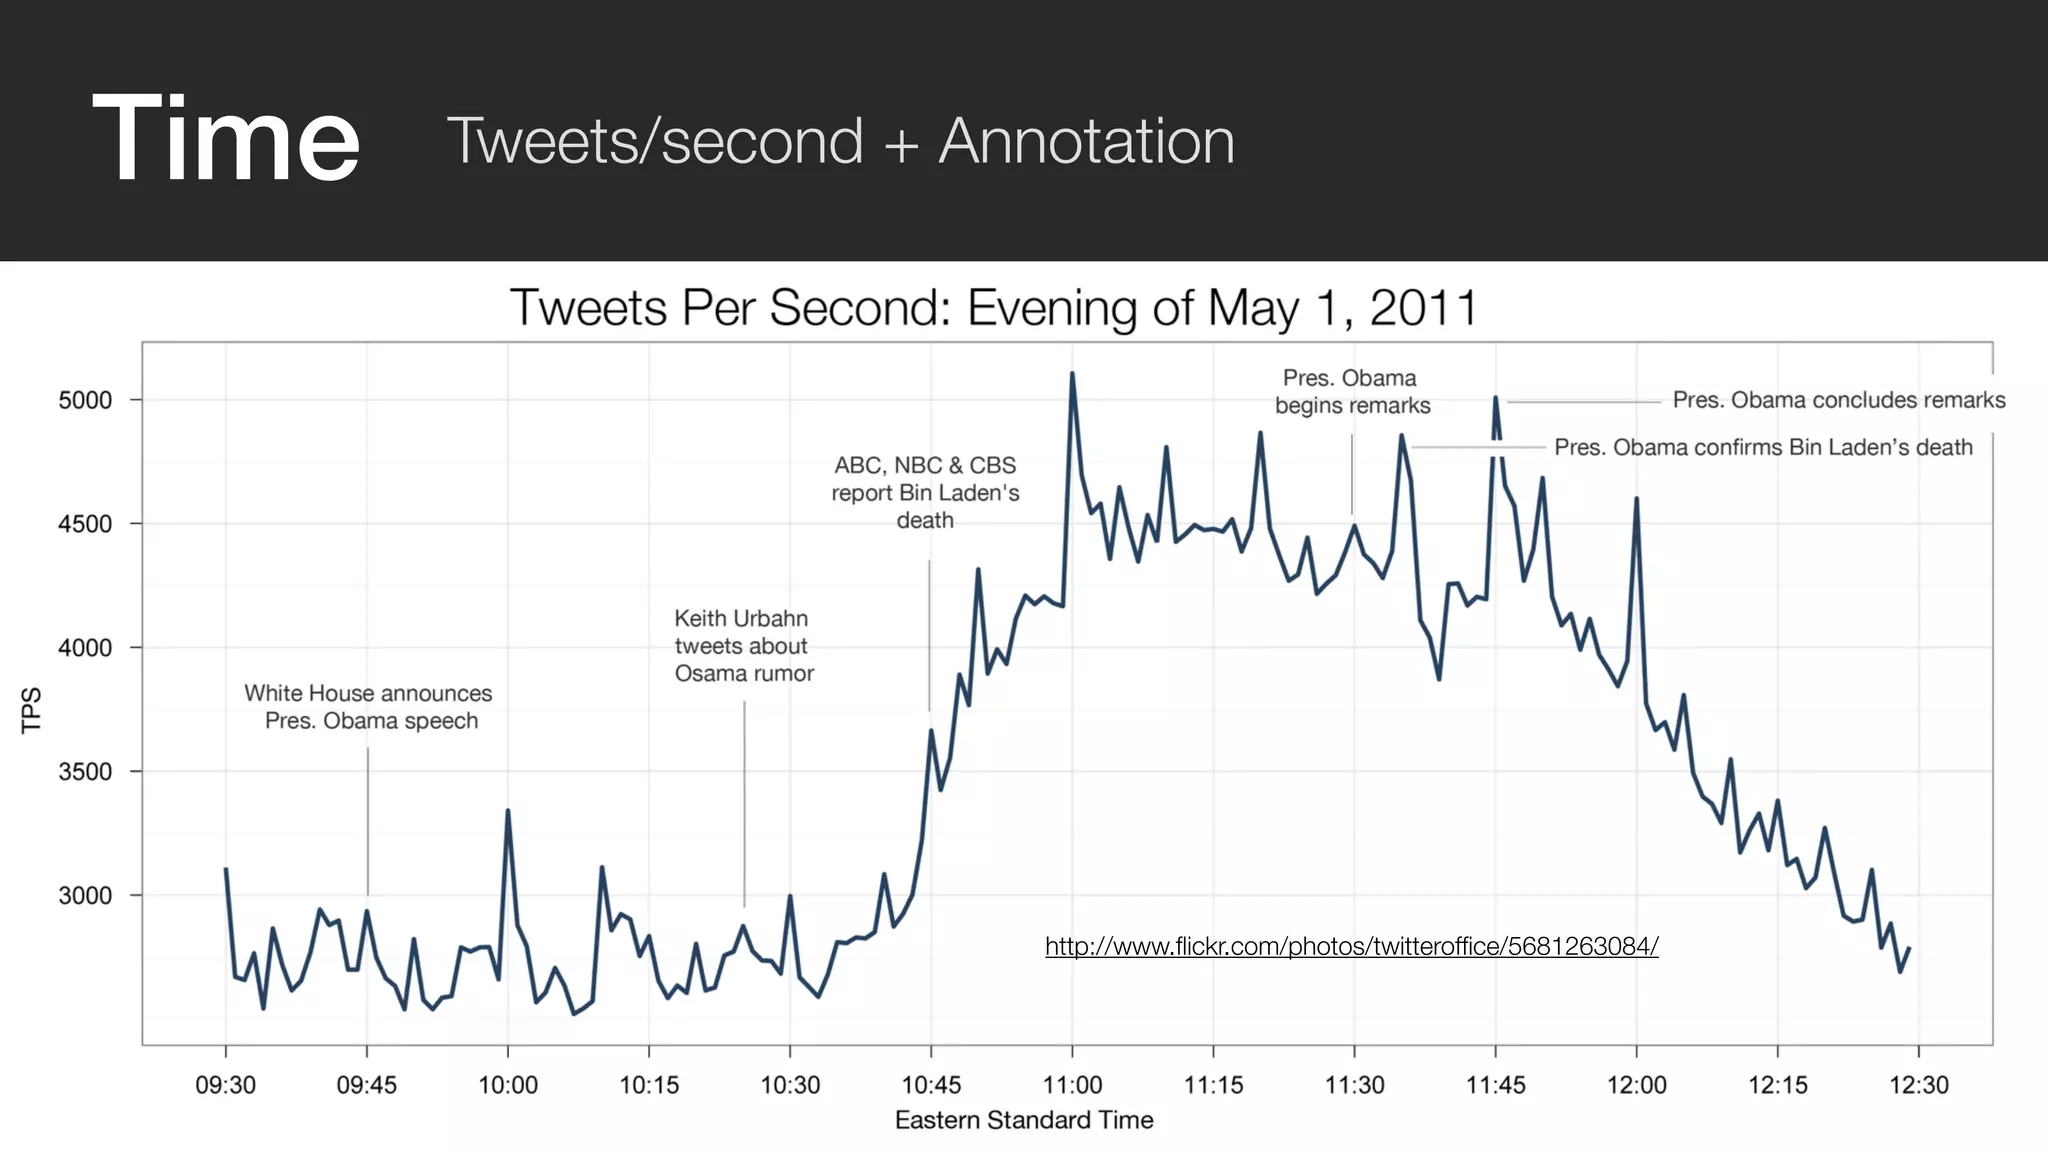
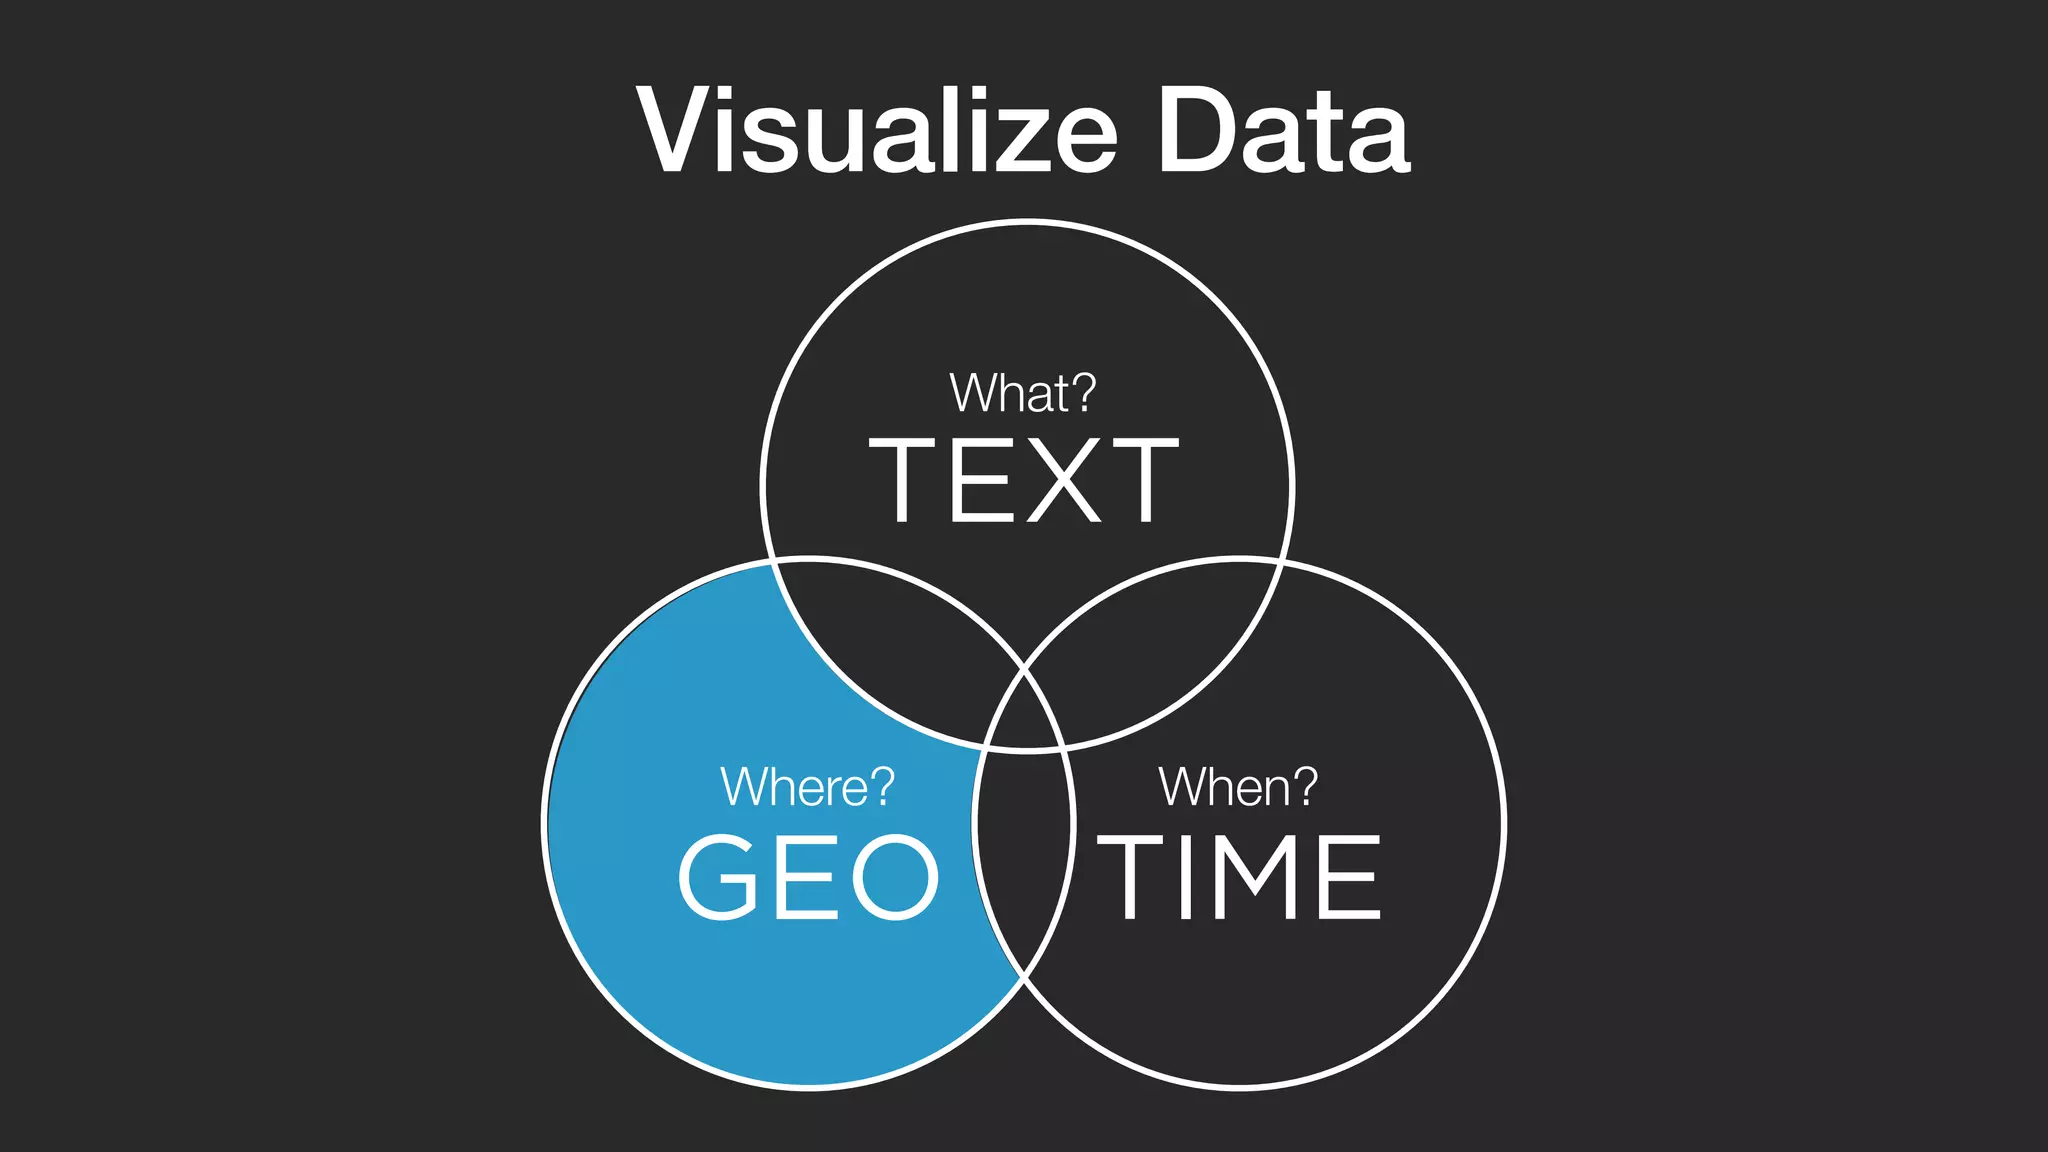
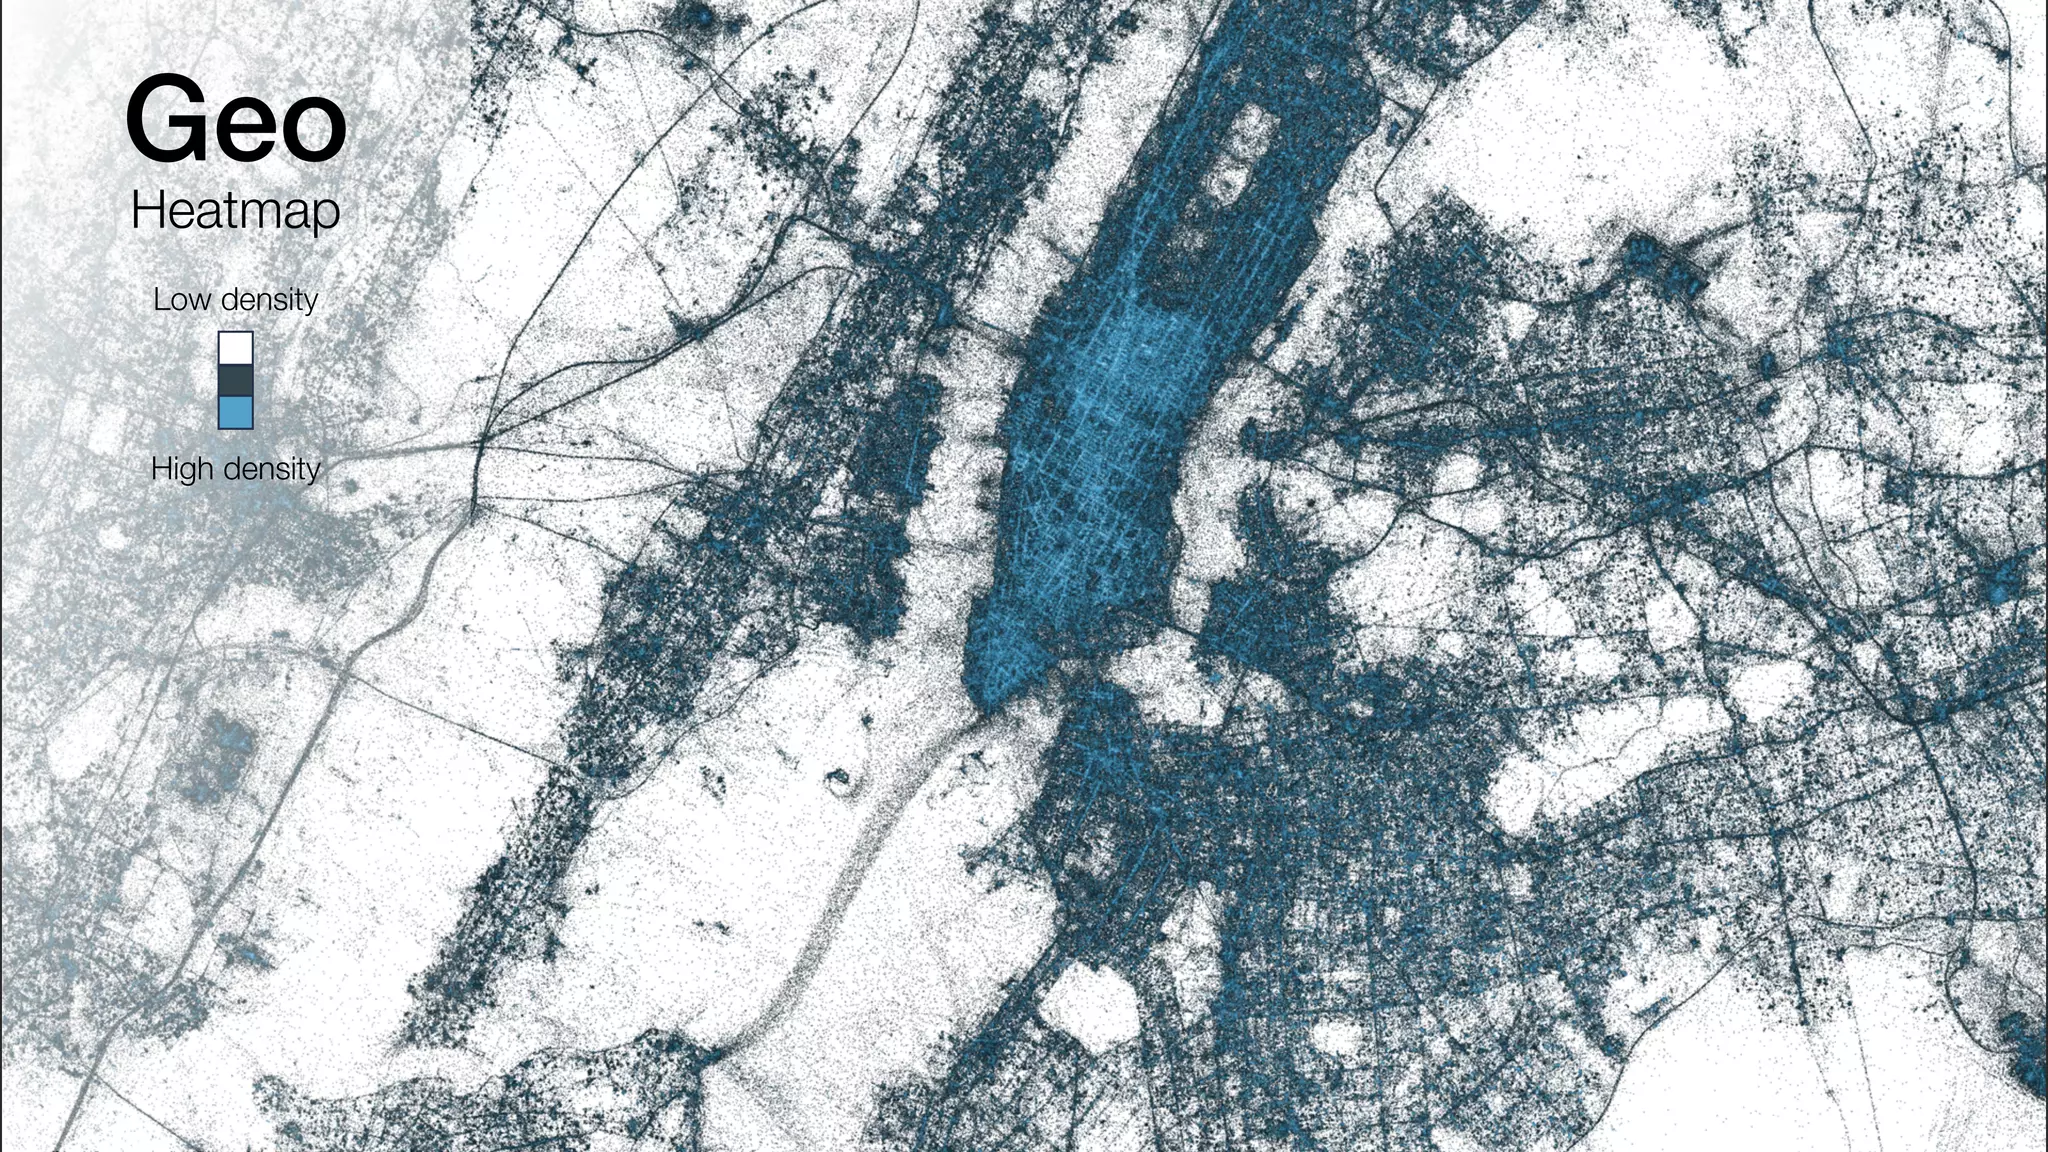
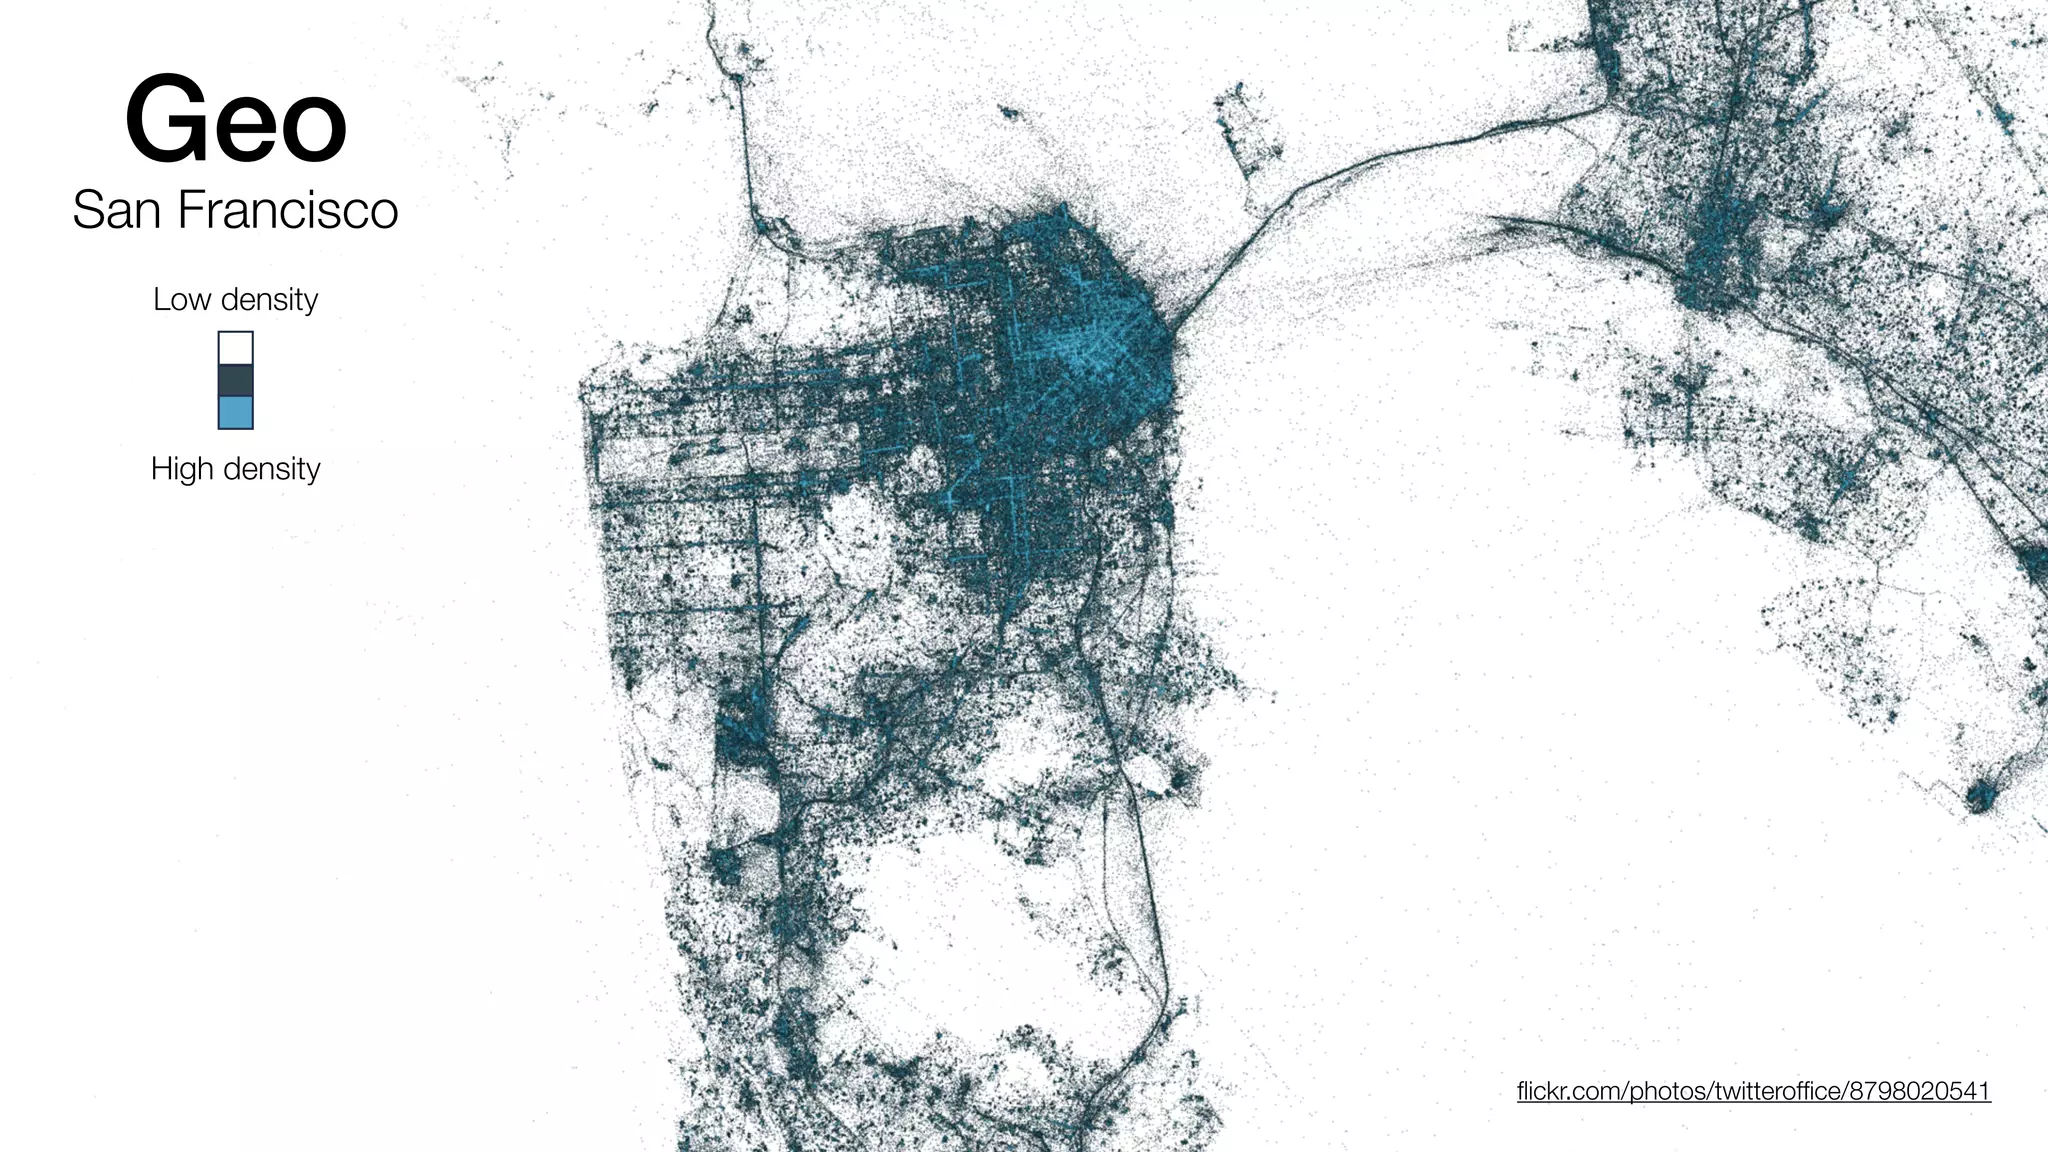
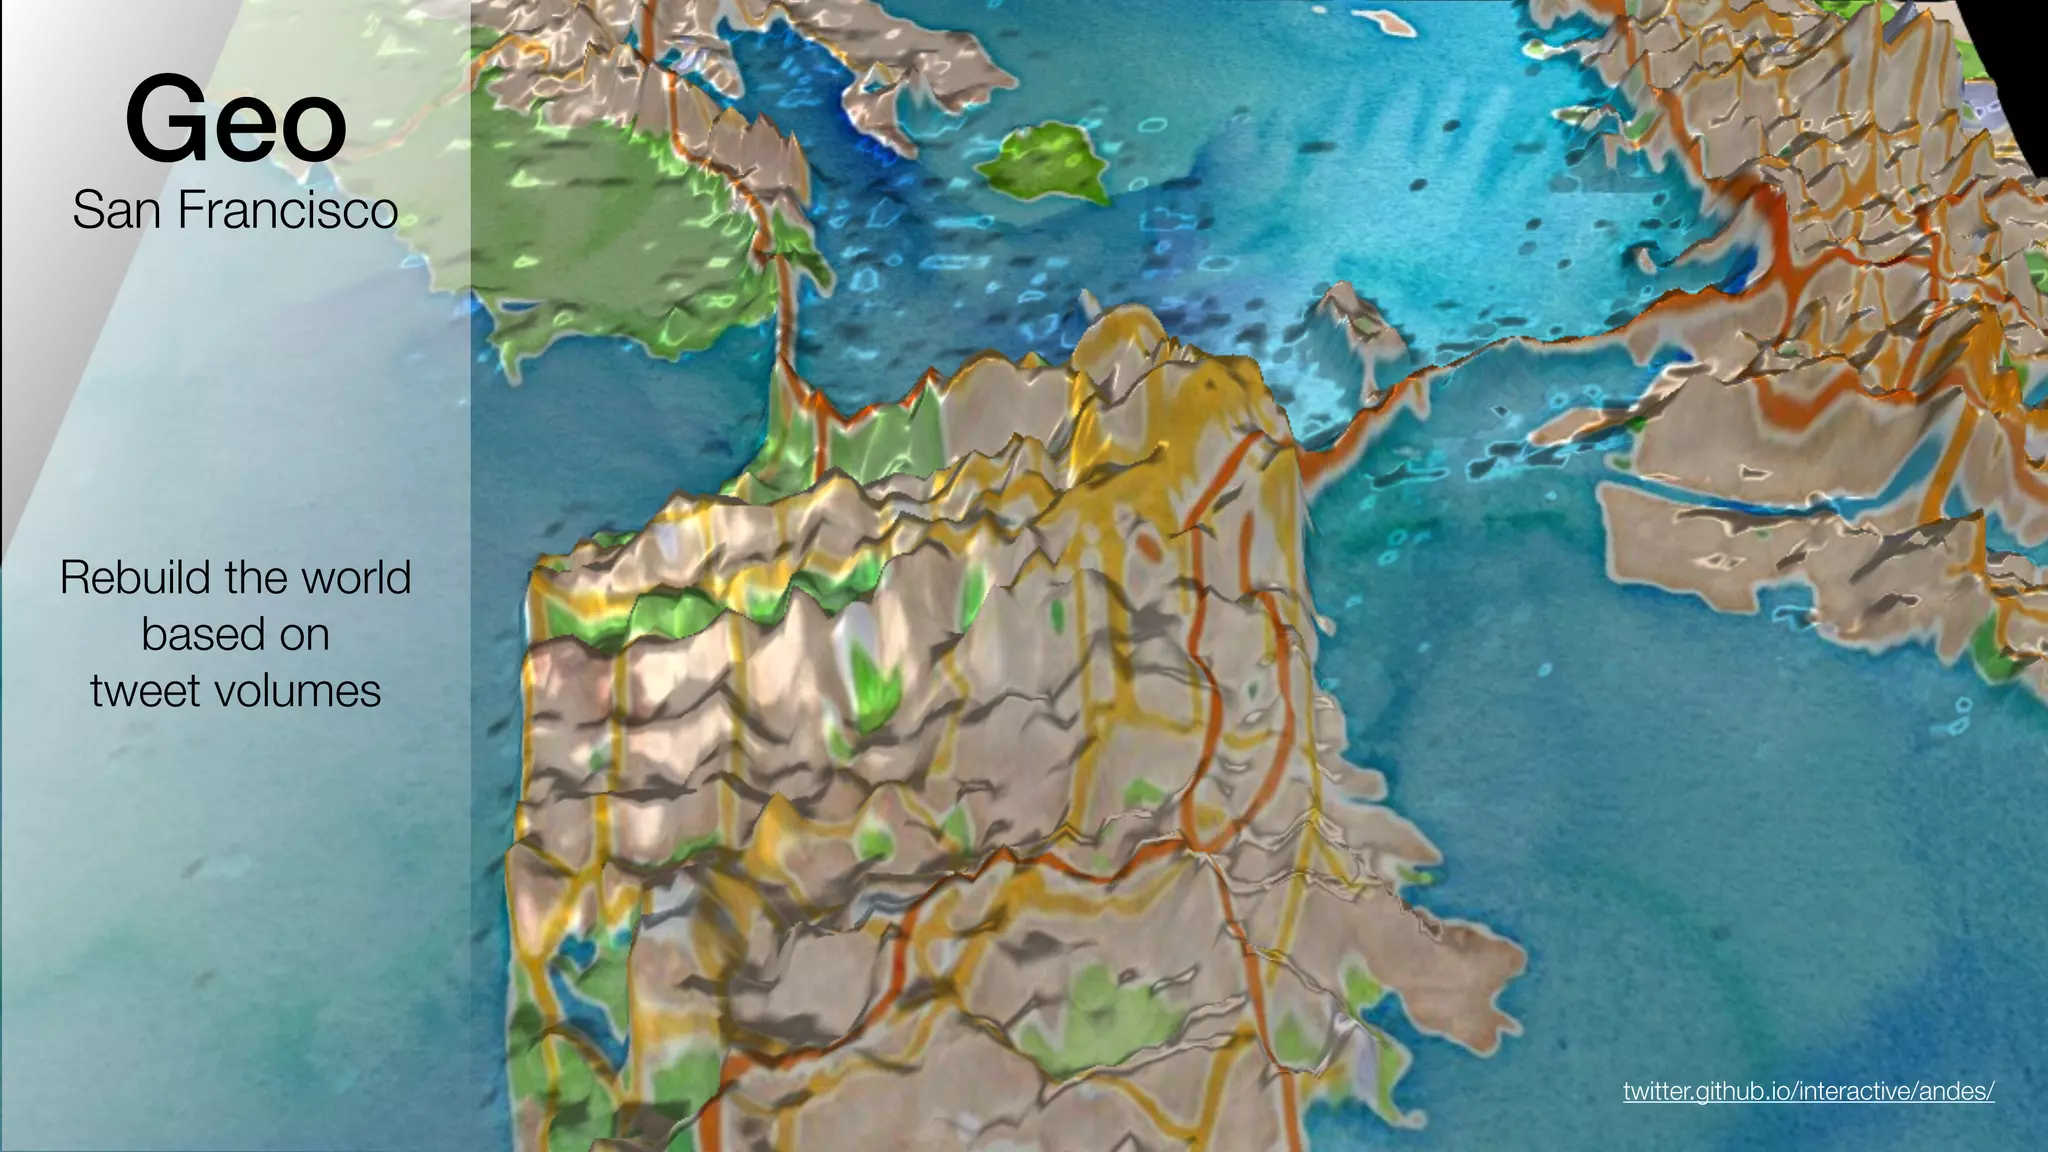
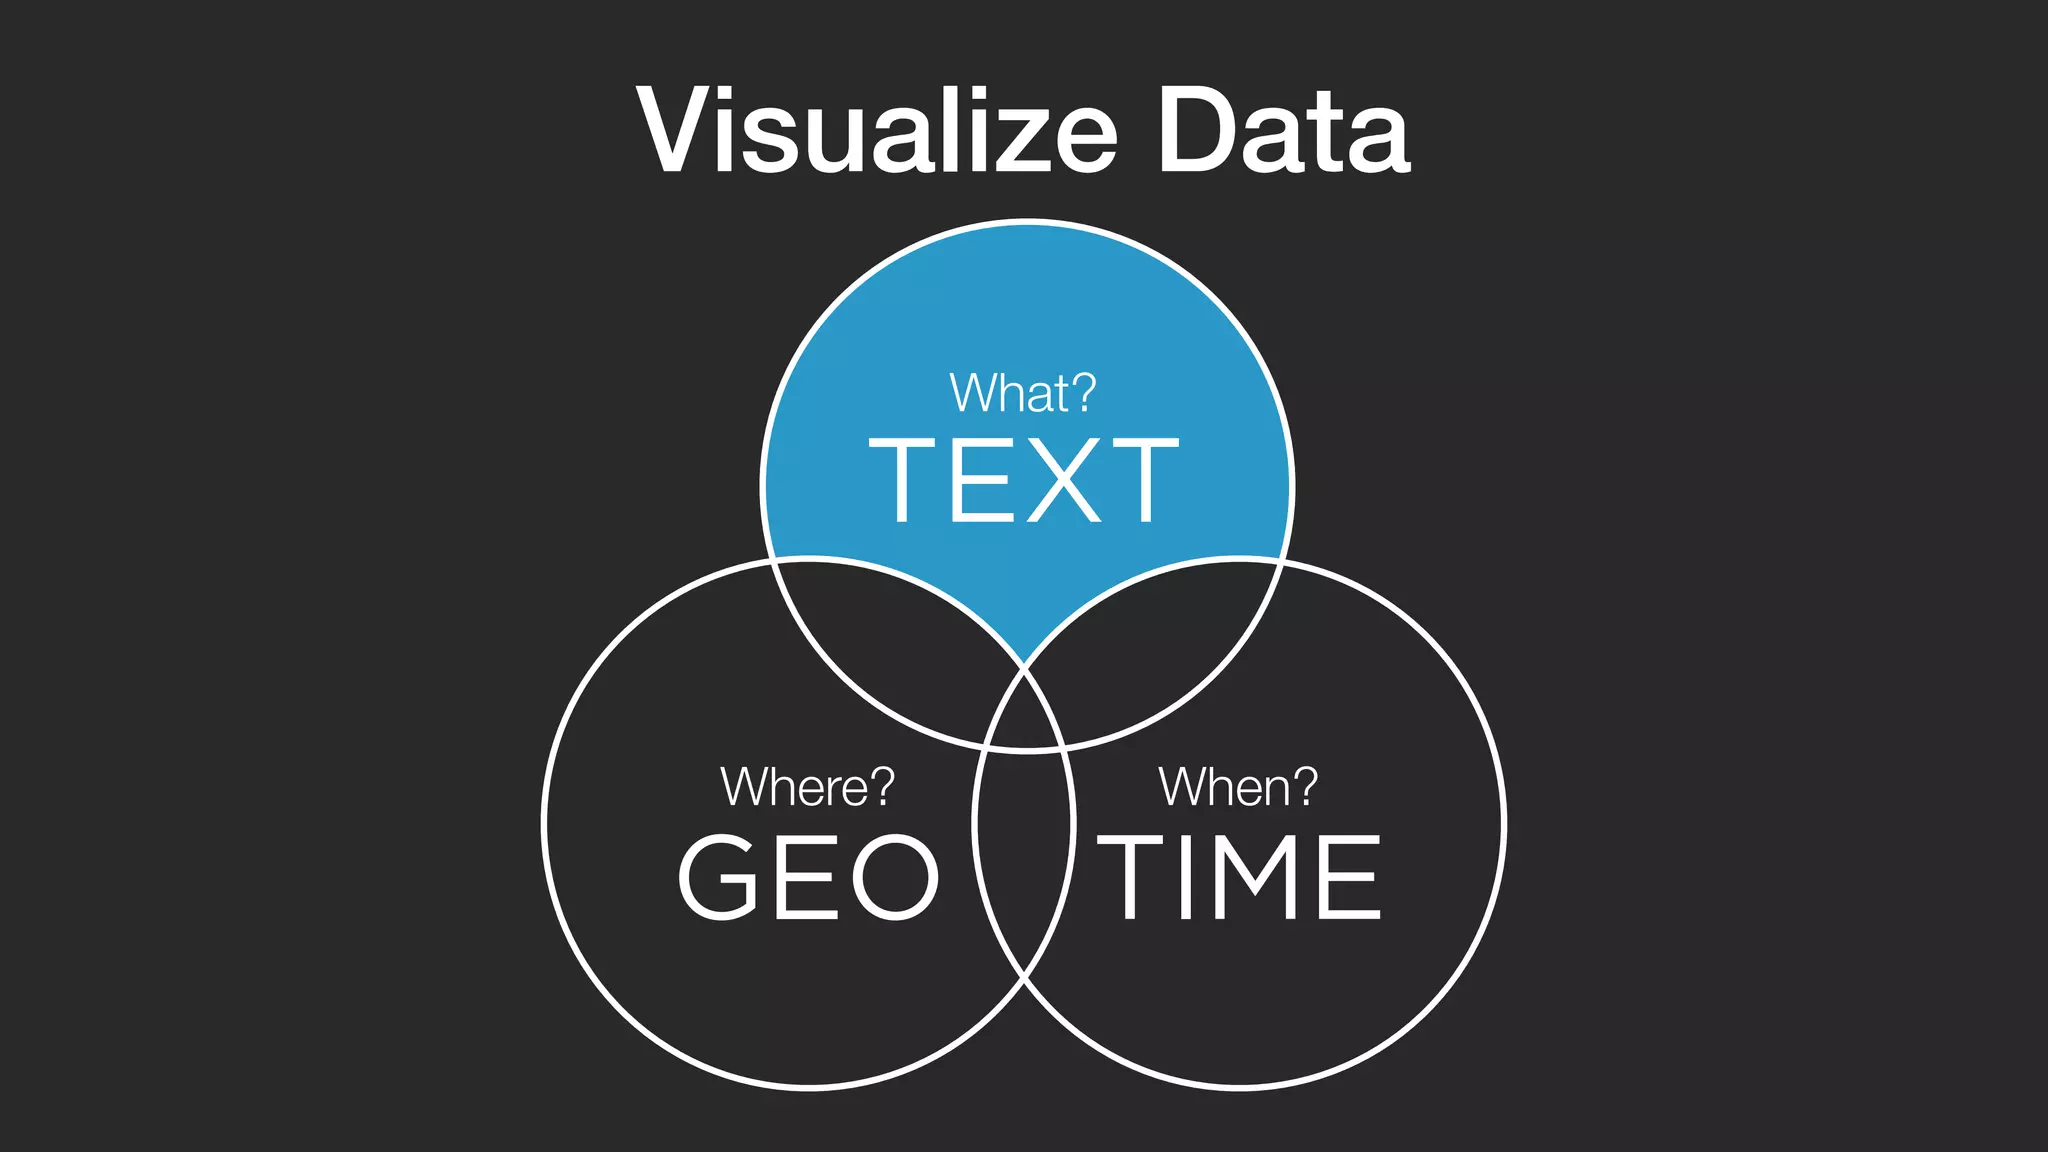
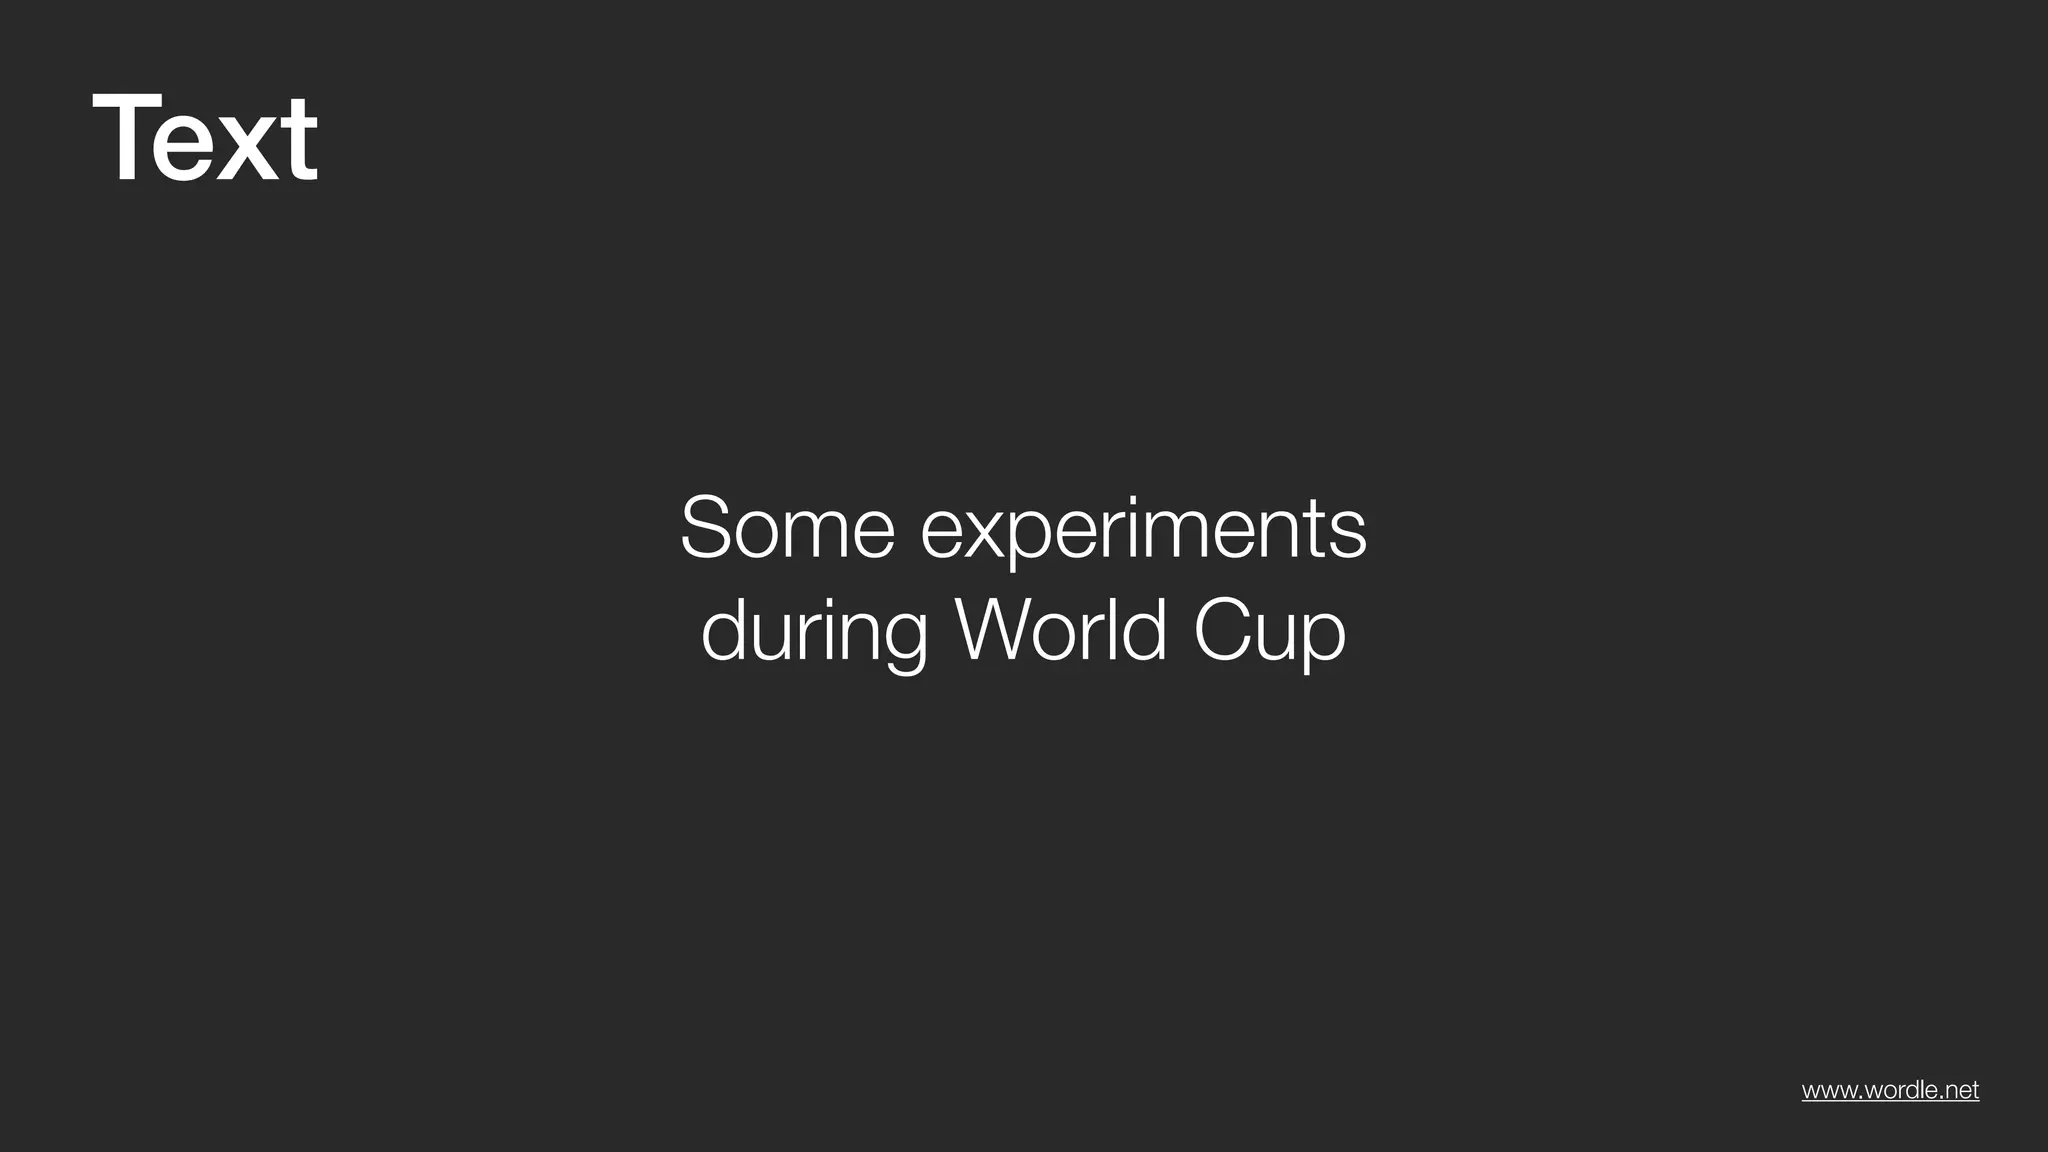
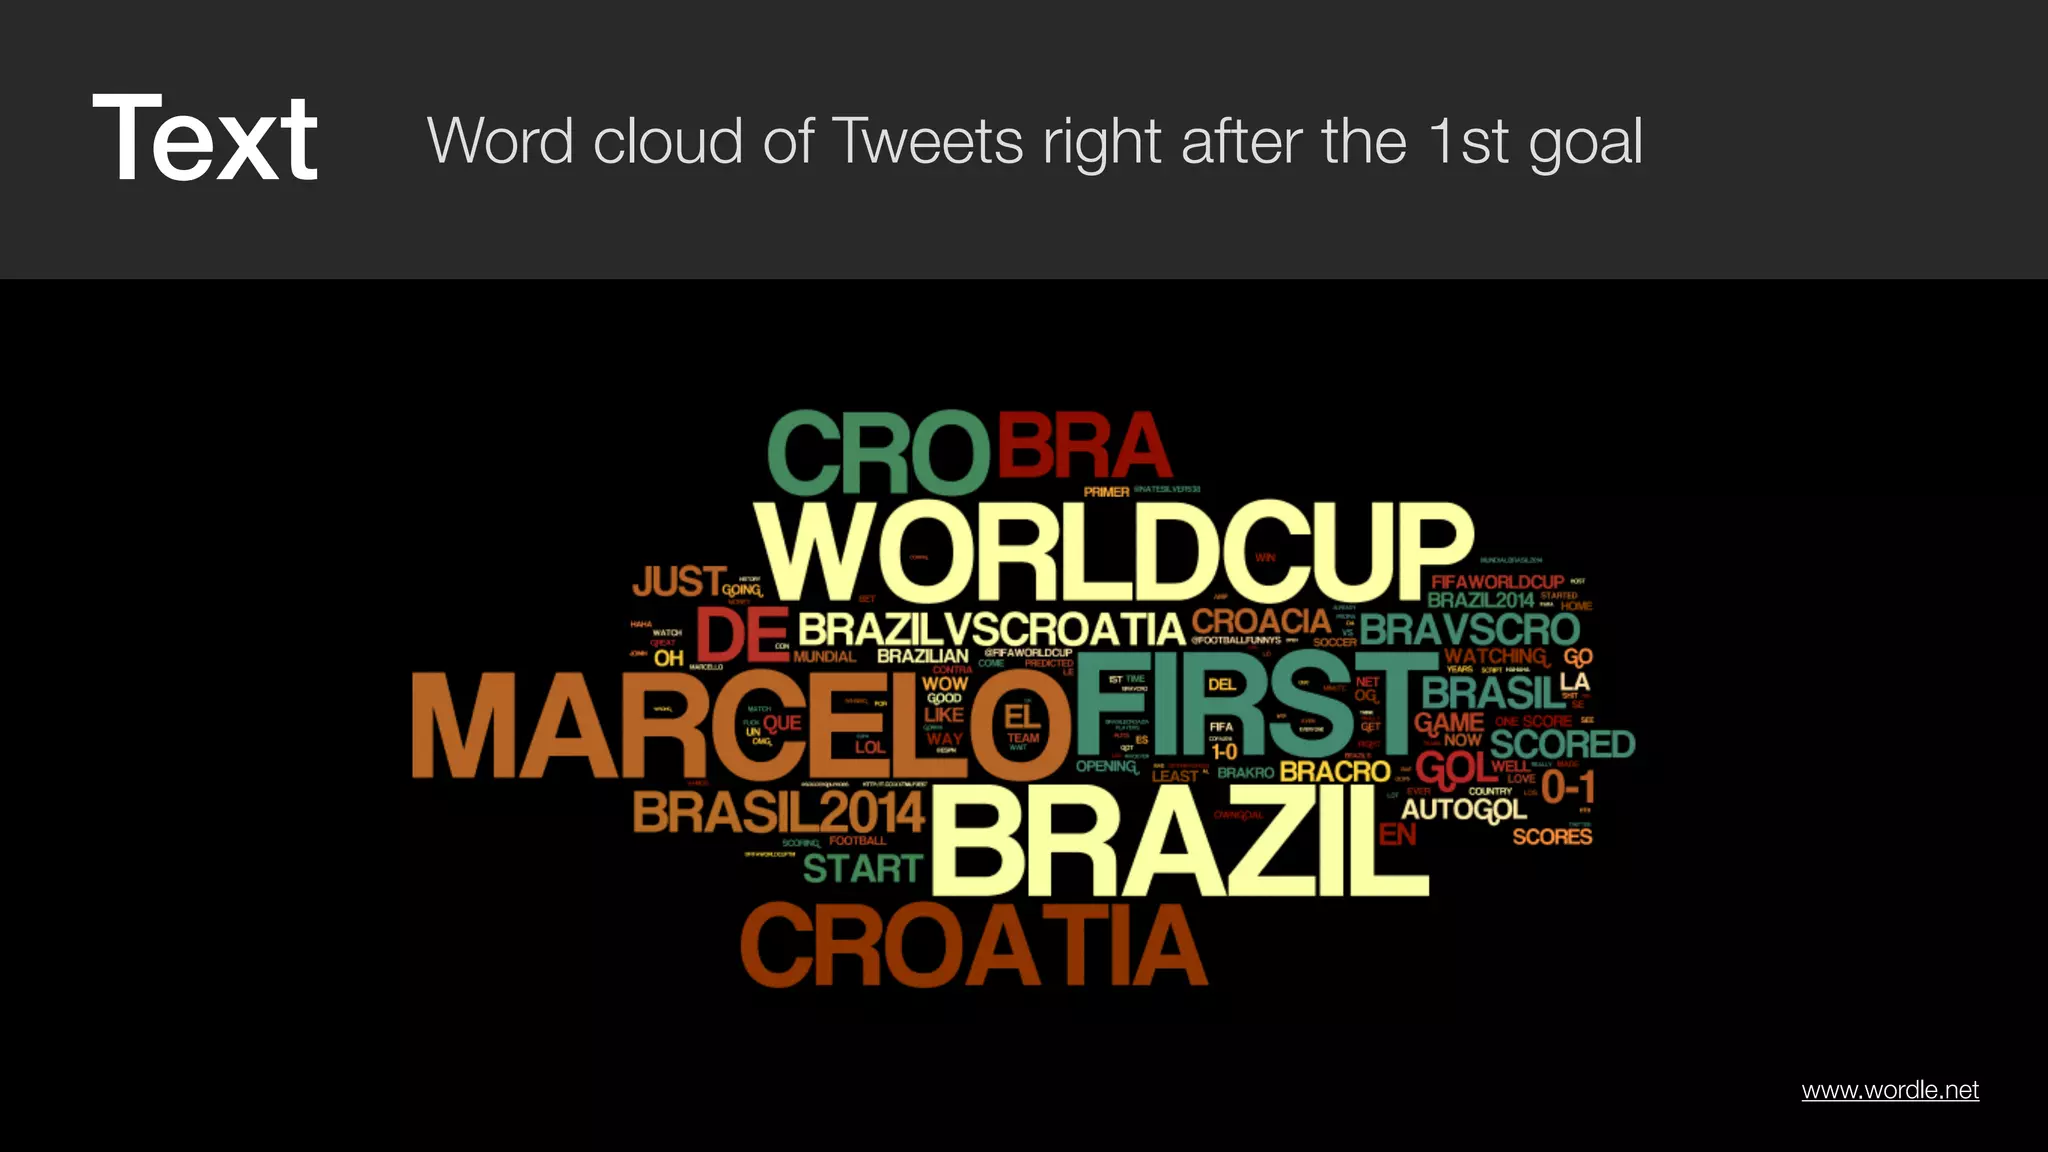
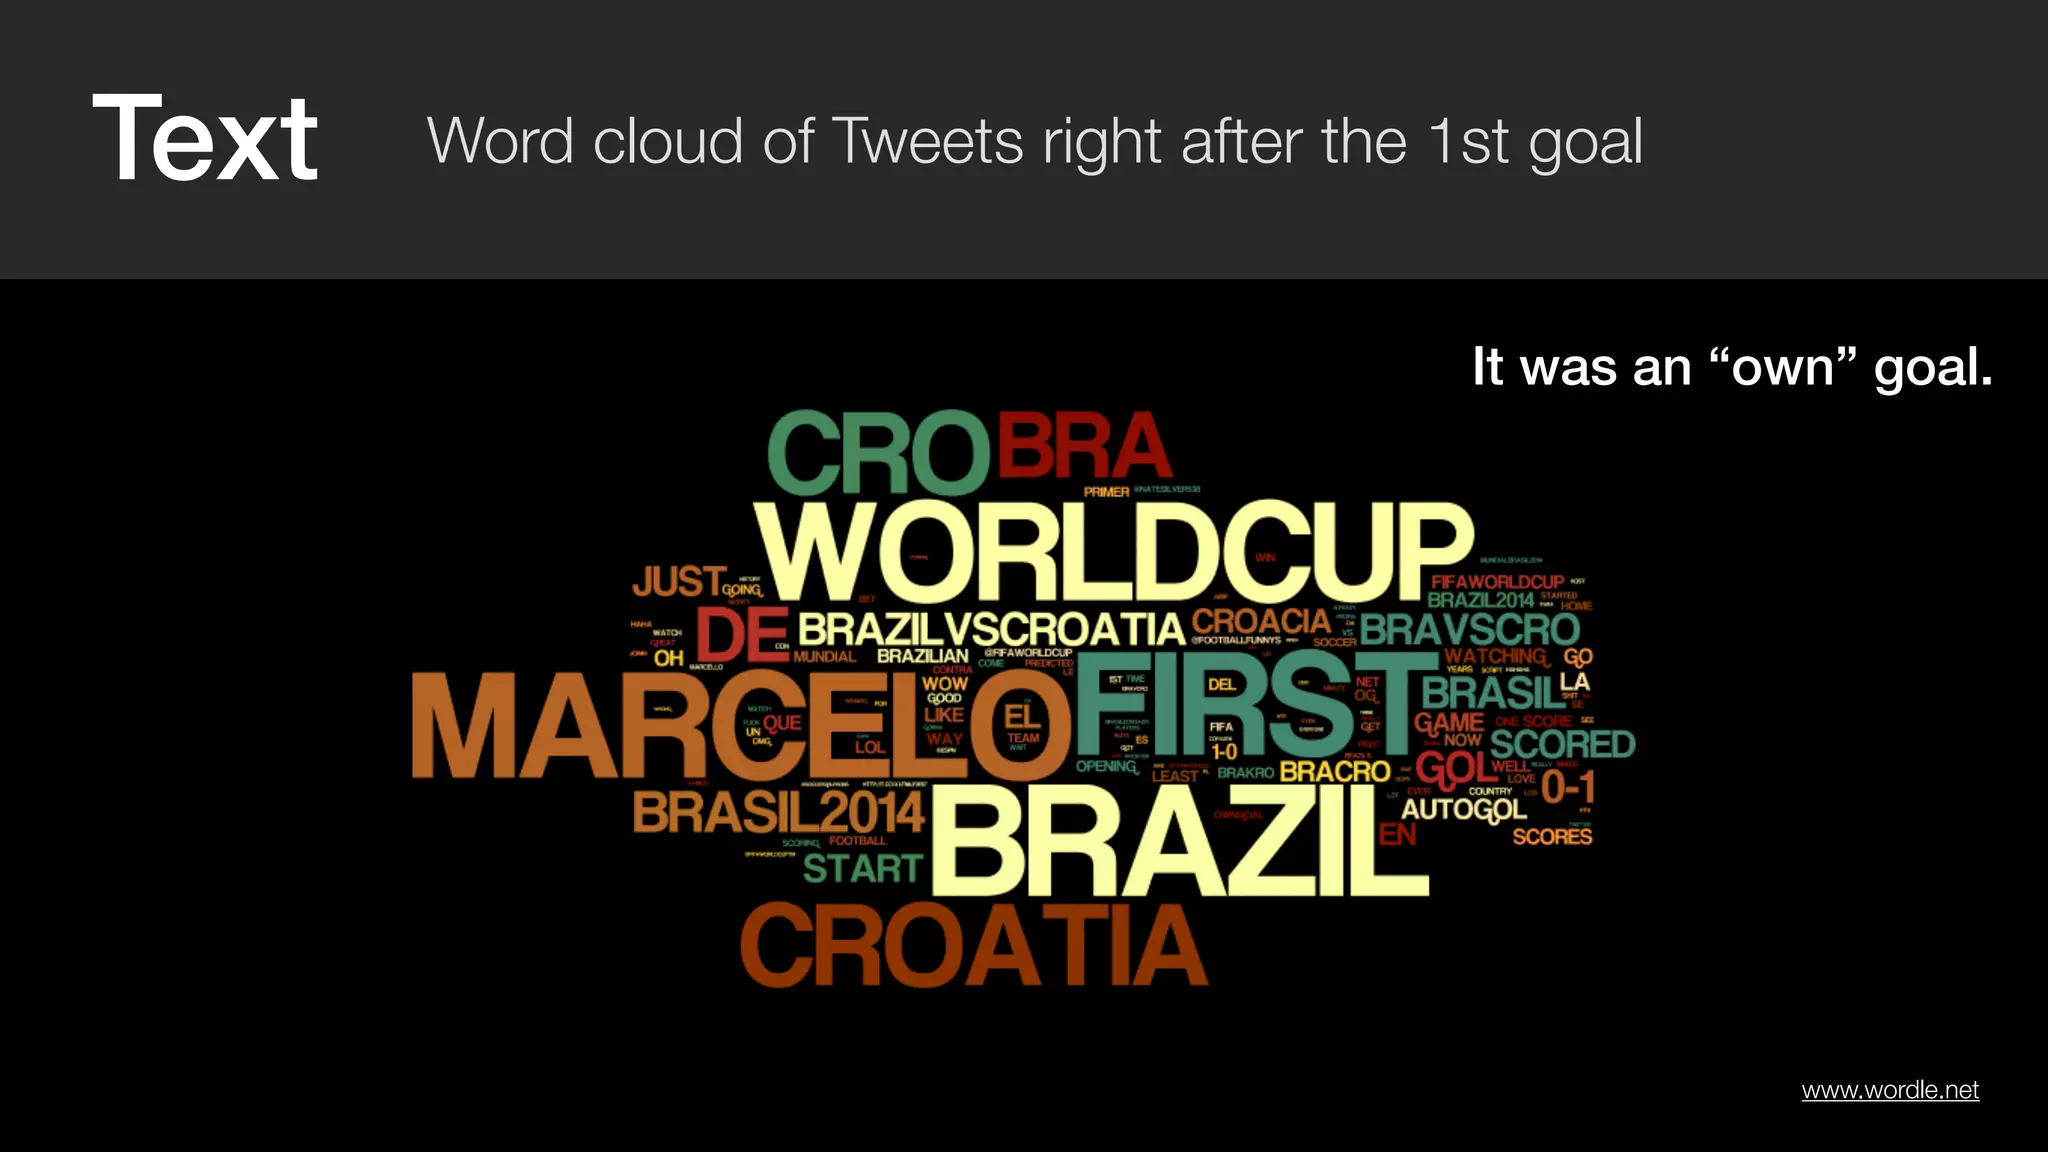
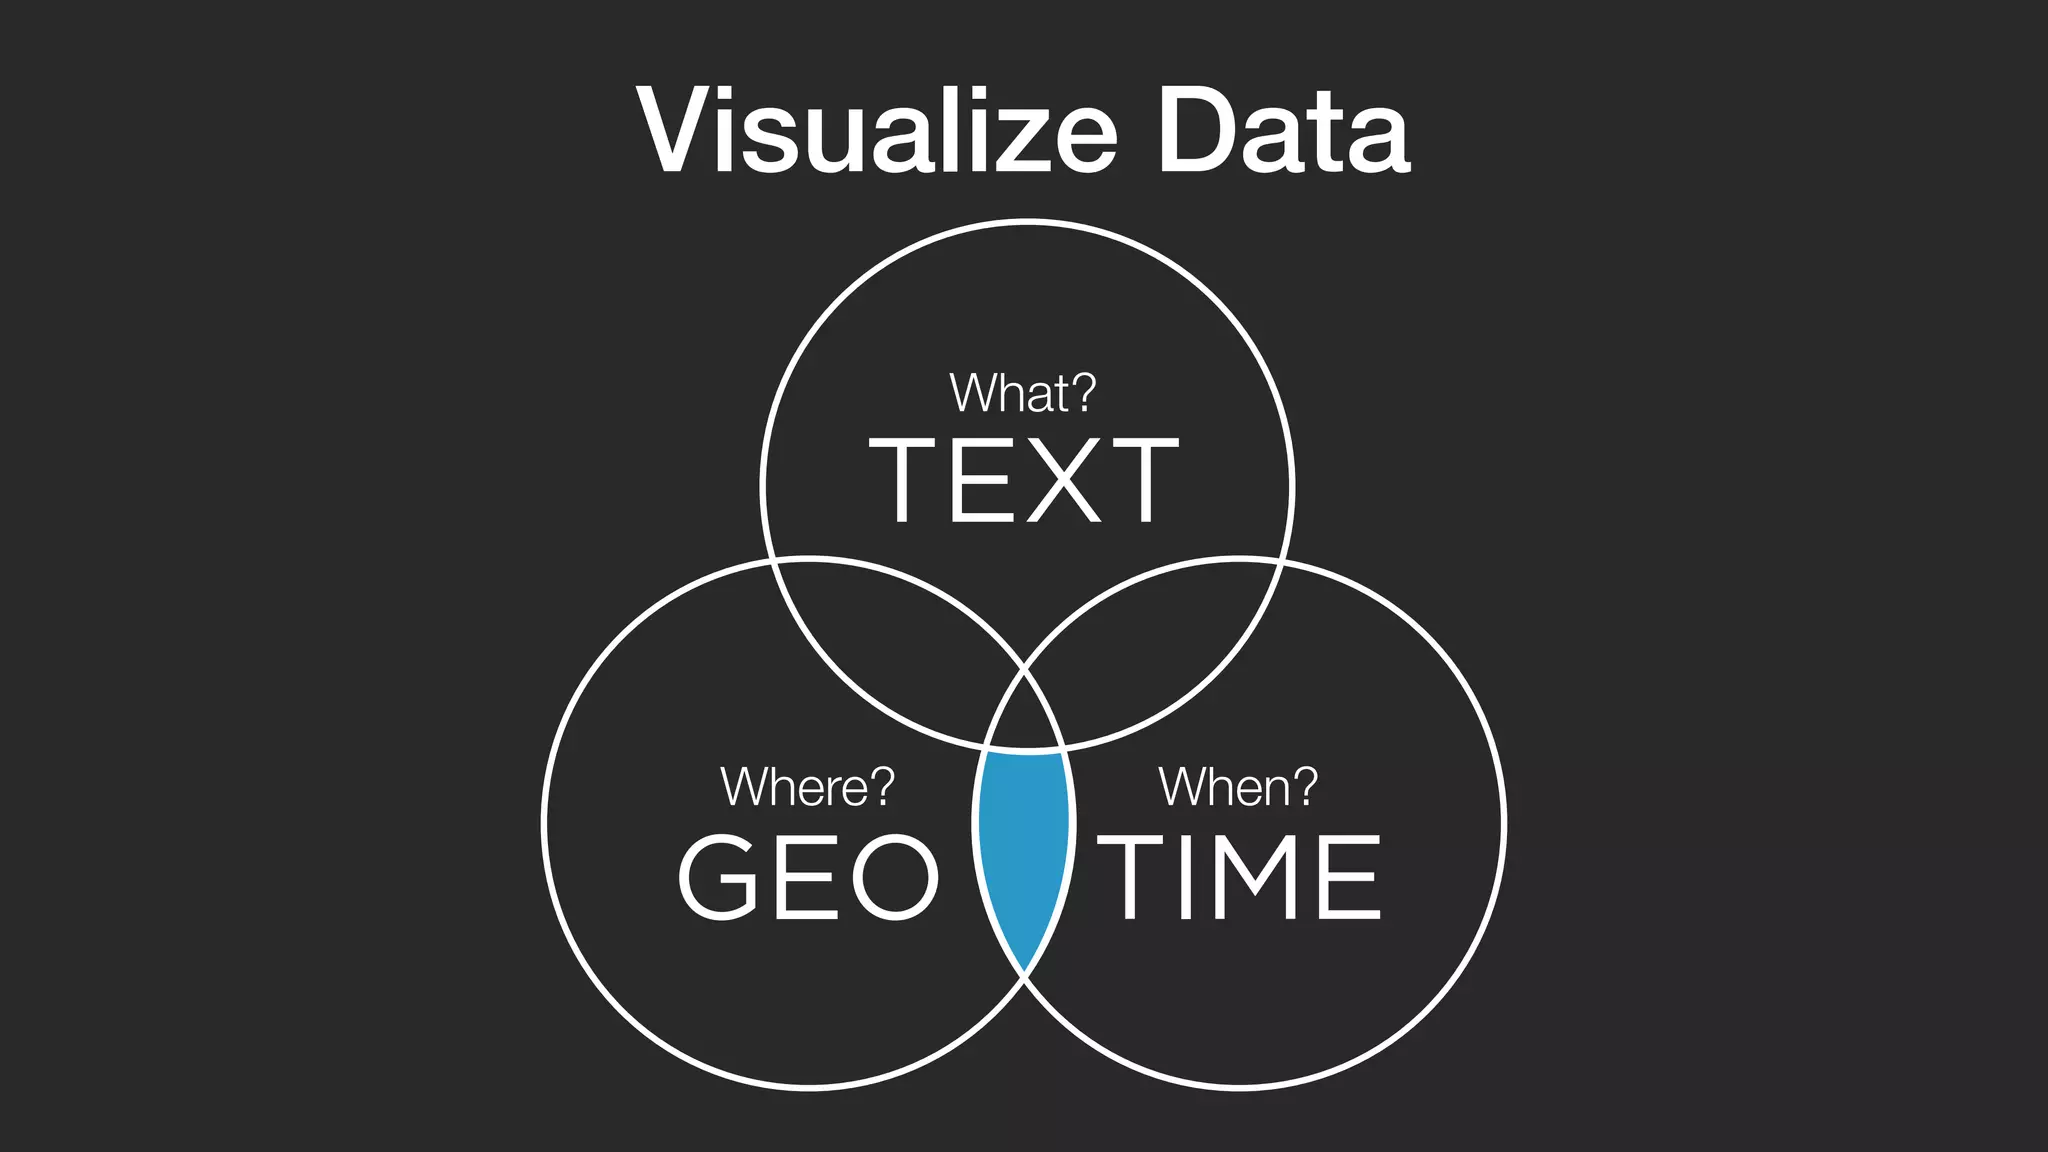
This document summarizes Krist Wongsuphasawat's work in data visualization at Twitter. It describes how he obtains tweet data, visualizes it using tools like R and D3 to show trends over time, locations, and text. Examples include visualizations of events like the World Cup and State of the Union. The process involves getting relevant data, visualizing it, evaluating the results, and iterating. The goal is to transform big Twitter data into smaller, insightful visualizations that tell stories.


![Apache Spark 101 [in 50 min]](https://cdn.slidesharecdn.com/ss_thumbnails/apachespark101-in50min1-150227110033-conversion-gate01-thumbnail.jpg?width=640&height=640&fit=bounds)


![[DSC Europe 25] Aleksandra Dragicevic - AI-Boosted Research in Healthcare: Fr...](https://cdn.slidesharecdn.com/ss_thumbnails/iqwngszurf2r7pi1lnnj-4-aleksandra-dragicevic-ad-dsc-europe-conference-20-251208151905-37c3238a-thumbnail.jpg?width=640&height=640&fit=bounds)


![[DSC Europe 25] Bassam Maharmeh - Artificial Intelligence: Opportunities and ...](https://cdn.slidesharecdn.com/ss_thumbnails/thhfmr2fqpawzj7hsjpg-5-251211083048-2c23204f-thumbnail.jpg?width=640&height=640&fit=bounds)


![[DSC Europe 25] Milan Sekuloski - Data, Defence, and Development: Cybersecuri...](https://cdn.slidesharecdn.com/ss_thumbnails/dfrkwwx4qly6atqpbl4z-4-251209104645-c3d4b0ca-thumbnail.jpg?width=640&height=640&fit=bounds)
![[DSC Europe 25] Dobrica Cosic - Savings by the Second: How Dynamic Pricing an...](https://cdn.slidesharecdn.com/ss_thumbnails/znp09f3smtqz3w2sq6wn-1-dobrica-cosic-savings-by-the-second-how-dynamic-pricing-and-smart-data-are-bu-251208151905-26e6f41e-thumbnail.jpg?width=640&height=640&fit=bounds)
![[DSC Europe 25] Kaja Kandare - LLM as a judge.pptx](https://cdn.slidesharecdn.com/ss_thumbnails/arxyccaxsdsd1ba99wjw-7-251212104007-2b4e3f64-thumbnail.jpg?width=640&height=640&fit=bounds)
![[DSC Europe 25] Vladimir Jelic - The AI-Driven Security Shift From Reactive D...](https://cdn.slidesharecdn.com/ss_thumbnails/6g5gj25mtjwayniqem1t-6-251209104645-7a5a5fc6-thumbnail.jpg?width=640&height=640&fit=bounds)


![[DSC Europe 25] Debmalya Biswas - Agentification: the art of transforming man...](https://cdn.slidesharecdn.com/ss_thumbnails/r5azlggvtqiaiiusrqdr-4-251212103249-5a12c89b-thumbnail.jpg?width=640&height=640&fit=bounds)
![[DSC Europe 25] Milan Zdravkovic - The road less traveled in District Heating...](https://cdn.slidesharecdn.com/ss_thumbnails/nfaboniqwsz4ucyctnmy-2-milan-zdravkovic-dsc2025-the-road-less-traveled-in-district-heating-operation-251208151905-f56388a5-thumbnail.jpg?width=640&height=640&fit=bounds)
![[DSC Europe 25] Dusan Jovicic - AI Story: From on-prem to cloud and back agai...](https://cdn.slidesharecdn.com/ss_thumbnails/8kp49m6uq22ifnbwhfnk-2-251205085715-964d11a6-thumbnail.jpg?width=640&height=640&fit=bounds)
![[DSC Europe 25] Dragan Vucic - Building the Learning Organization - How AI Tr...](https://cdn.slidesharecdn.com/ss_thumbnails/8brigo2sbu6qur6gxrra-7-251205085715-6ae07d24-thumbnail.jpg?width=640&height=640&fit=bounds)
![[DSC Europe 25] Max Talanov - Non digital NNs.pptx](https://cdn.slidesharecdn.com/ss_thumbnails/wif8tr3gtua74qvtopke-non-digital-nns-251205090438-26b0eea6-thumbnail.jpg?width=640&height=640&fit=bounds)
