Download as PDF, PPTX


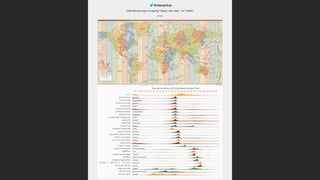
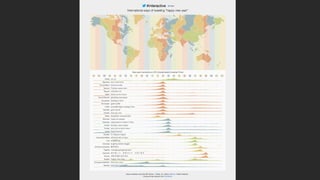
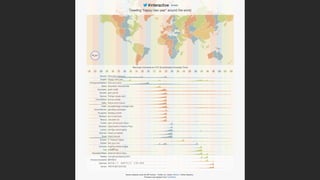
![HAPPY NEW YEAR AROUND THE WORLD
[ PROJECT ]](https://image.slidesharecdn.com/6thingstoexpectwhenyouarevisualizingv6-200408205651/85/6-things-to-expect-when-you-are-visualizing-2020-Edition-67-320.jpg)

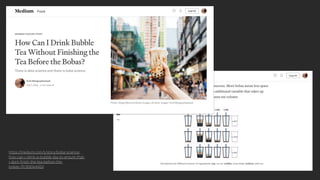
![BOBA SCIENCE
[ PROJECT ]](https://image.slidesharecdn.com/6thingstoexpectwhenyouarevisualizingv6-200408205651/85/6-things-to-expect-when-you-are-visualizing-2020-Edition-74-320.jpg)
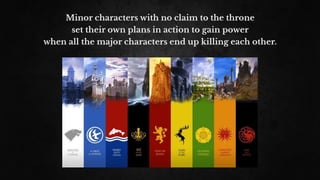
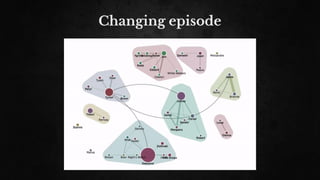
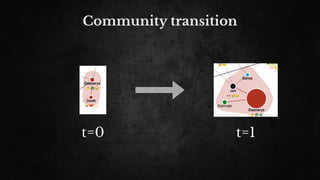
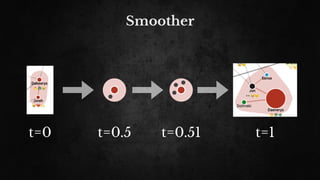
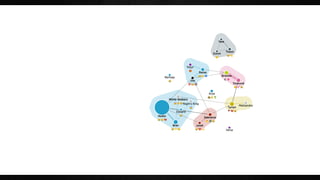
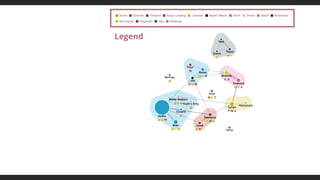
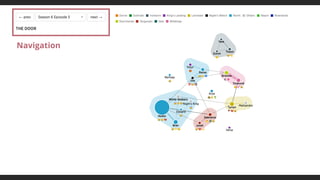
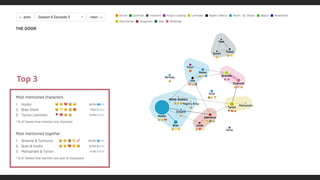
![GAME OF THRONES
[ PROJECT ]](https://image.slidesharecdn.com/6thingstoexpectwhenyouarevisualizingv6-200408205651/85/6-things-to-expect-when-you-are-visualizing-2020-Edition-76-320.jpg)


![VISUAL ANALYTICS FOR LOG EVENTS
[ PROJECT ]](https://image.slidesharecdn.com/6thingstoexpectwhenyouarevisualizingv6-200408205651/85/6-things-to-expect-when-you-are-visualizing-2020-Edition-137-320.jpg)


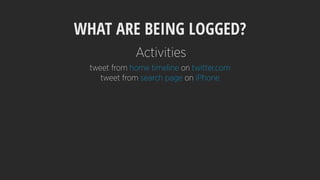


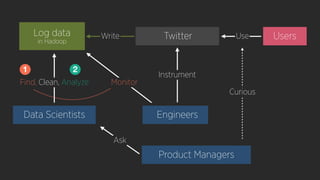
![LOG EVENT A.K.A. “CLIENT EVENT”
[Lee et al. 2012]](https://image.slidesharecdn.com/6thingstoexpectwhenyouarevisualizingv6-200408205651/85/6-things-to-expect-when-you-are-visualizing-2020-Edition-146-320.jpg)
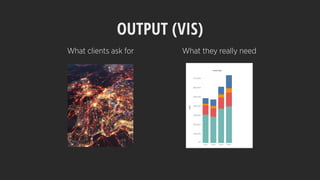
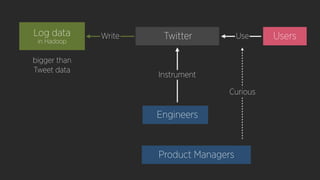
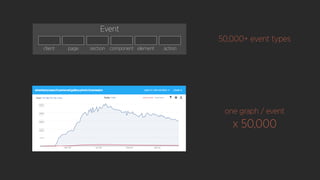
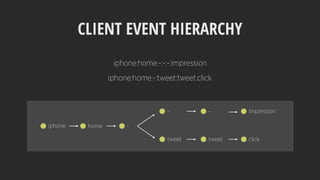
![LOG EVENT A.K.A. “CLIENT EVENT”
client : page : section : component : element : action
web : home : timeline : tweet_box : button : tweet
1) User ID
2) Timestamp
3) Event name
4) Event detail
[Lee et al. 2012]](https://image.slidesharecdn.com/6thingstoexpectwhenyouarevisualizingv6-200408205651/85/6-things-to-expect-when-you-are-visualizing-2020-Edition-147-320.jpg)

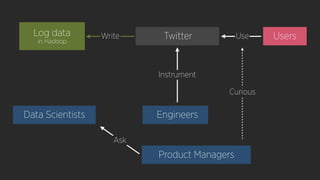


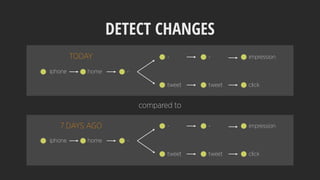
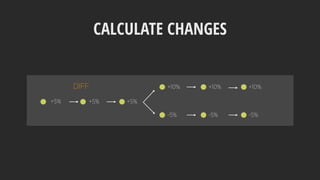
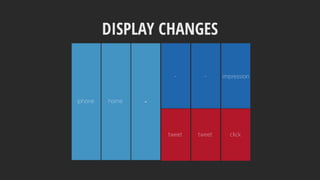
![DISPLAY CHANGES
iphone home -
- - impression
tweet tweet click
Map of the Market [Wattenberg 1999], StemView [Guerra-Gomez et al. 2013]](https://image.slidesharecdn.com/6thingstoexpectwhenyouarevisualizingv6-200408205651/85/6-things-to-expect-when-you-are-visualizing-2020-Edition-163-320.jpg)


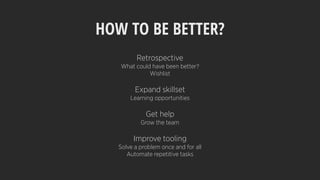

![LABELLA.JS
[ PROJECT ]](https://image.slidesharecdn.com/6thingstoexpectwhenyouarevisualizingv6-200408205651/85/6-things-to-expect-when-you-are-visualizing-2020-Edition-190-320.jpg)
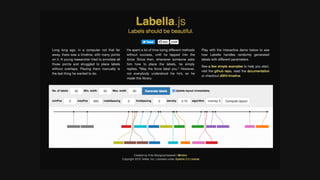
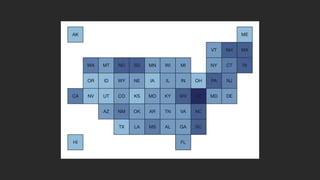
![GRID MAP
[ PROJECT ]](https://image.slidesharecdn.com/6thingstoexpectwhenyouarevisualizingv6-200408205651/85/6-things-to-expect-when-you-are-visualizing-2020-Edition-192-320.jpg)


![VX = REACT + D3
[ PROJECT ]](https://image.slidesharecdn.com/6thingstoexpectwhenyouarevisualizingv6-200408205651/85/6-things-to-expect-when-you-are-visualizing-2020-Edition-197-320.jpg)


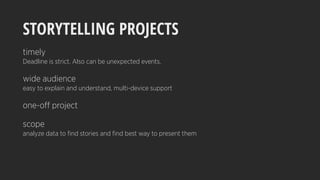
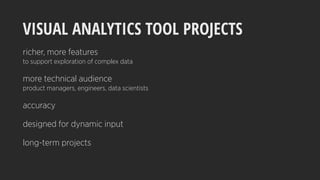
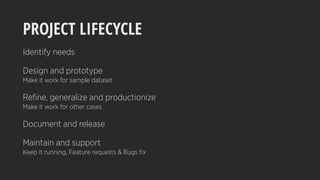
This document discusses expectations and challenges when visualizing data. The key points are: 1. Expect to find the real need by understanding the audience and goals better than the client. Expect to clean data, which can take a significant amount of time due to multiple sources and formats. 2. Prepare to iterate as the initial visualization may not meet needs or deadlines. Celebrate failures as learning opportunities. 3. Visualization projects include storytelling projects with strict deadlines and analytical tools to support data exploration by technical teams over the long term. The project lifecycle involves identifying needs, prototyping, refining, and maintaining the visualization.


![[DSC Europe 25] Predrag Maletic - Scaling AI in Banking – Our Strategic Journ...](https://cdn.slidesharecdn.com/ss_thumbnails/qu2onv0aruwlvqtygmxx-predrag-maletic-scaling-ai-in-banking-260123083019-6cf1da1d-thumbnail.jpg?width=640&height=640&fit=bounds)


