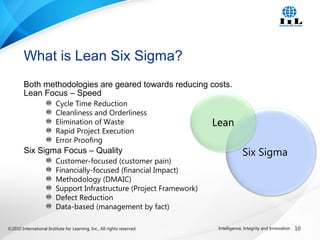
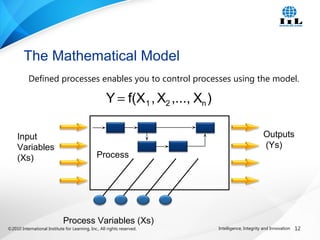
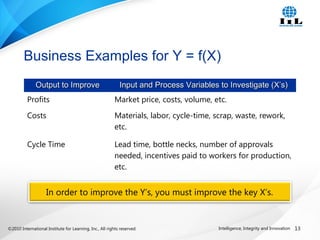
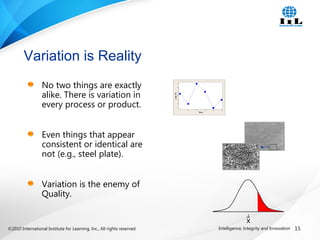
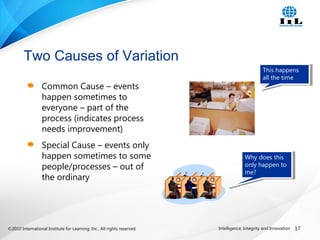
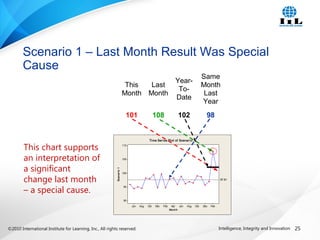
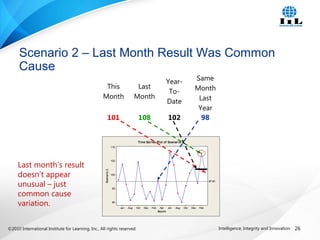
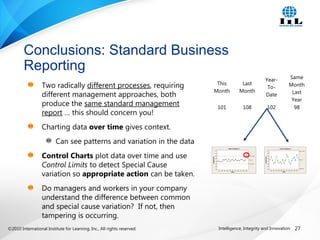
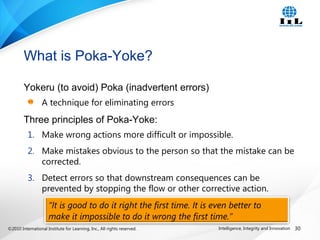
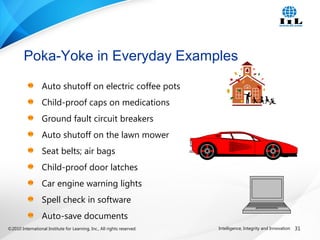
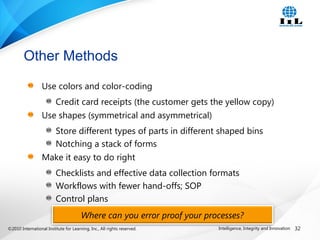
©2010 International Institute for Learning, Inc., All rights reserved. 1Intelligence, Integrity and Innovation©2010 International Institute for Learning, Inc., All rights reserved.
Thank you for joining us today.
This webinar is brought to you by IIL a global leader in:
Project, Program and Portfolio Management
Microsoft®
Project and Project Server
Lean Six Sigma | Business Analysis
PRINCE2®
| ITIL®
Improving Project Management Skills
with Lean Six Sigma
©2010 International Institute for Learning, Inc., All rights reserved. 2Intelligence, Integrity and Innovation
Global IIL Companies
IIL US
IIL Asia (Singapore)
IIL Australia
IIL Brasil
IIL Canada
IIL China
IIL Europe (United Kingdom)
IIL Finland
IIL France
IIL Germany
IIL Hong Kong
IIL Hungary
IIL India
IIL Japan
IIL Korea (Seoul)
IIL México
IIL Middle East (Dubai)
IIL Spain
©2010 International Institute for Learning, Inc., All rights reserved. 3Intelligence, Integrity and Innovation
Welcome to IIL’s Virtual Classroom
Click the Yes button to
answer “Yes”
Click the No button to
answer “No”
Click the Applaud button to
indicate “applause”
Click the Laugh button to
indicate “laughter”
©2010 International Institute for Learning, Inc., All rights reserved. 4Intelligence, Integrity and Innovation
Too loud? Too soft?
Use the slider to the right of the speaker to adjust the volume.
©2010 International Institute for Learning, Inc., All rights reserved. 5Intelligence, Integrity and Innovation
The goal of this webinar is
to provide participants with
three important
concepts/techniques from
Lean Six Sigma that every
project manager should
know and apply to improve
project and product quality.
Webinar Goal
©2010 International Institute for Learning, Inc., All rights reserved. 6Intelligence, Integrity and Innovation
At the end of this session, you should be able to:
Define Lean Six Sigma from a high level.
Identify vital inputs to improve outputs.
Determine the difference between Common Cause and Special
Cause Variation.
Error proof project processes using Poka Yoke.
Webinar Objectives
©2010 International Institute for Learning, Inc., All rights reserved. 7Intelligence, Integrity and Innovation©2010 International Institute for Learning, Inc., All rights reserved.
Lean Six Sigma Quality
TopicTopic
©2010 International Institute for Learning, Inc., All rights reserved. 8Intelligence, Integrity and Innovation
Take a minute to think of a
product or service that you
have purchased and
considered to be “high
quality.”
What are the attributes that
led you to that conclusion?
Please answer in Text Chat.
What is Quality?
©2010 International Institute for Learning, Inc., All rights reserved. 9Intelligence, Integrity and Innovation
Improvement of Results starts with improvement
of Quality.
Dr. Deming was a quality and process
improvement pioneer credited with helping the
Japanese industry recover after World War II.
1. Lean Six Sigma is about improving results by
improving the quality of products and services.
2. Improvement comes from managing the
process, not the results.
Deming’s Chain Reaction
©2010 International Institute for Learning, Inc., All rights reserved. 10Intelligence, Integrity and Innovation
Both methodologies are geared towards reducing costs.
Lean Focus – Speed
Cycle Time Reduction
Cleanliness and Orderliness
Elimination of Waste
Rapid Project Execution
Error Proofing
Six Sigma Focus – Quality
Customer-focused (customer pain)
Financially-focused (financial Impact)
Methodology (DMAIC)
Support Infrastructure (Project Framework)
Defect Reduction
Data-based (management by fact)
What is Lean Six Sigma?
Six Sigma
Lean
©2010 International Institute for Learning, Inc., All rights reserved. 11Intelligence, Integrity and Innovation©2010 International Institute for Learning, Inc., All rights reserved.
Improving Outcomes –
Management by Fact
TopicTopic
©2010 International Institute for Learning, Inc., All rights reserved. 12Intelligence, Integrity and Innovation
The Mathematical Model
Defined processes enables you to control processes using the model.
Input
Variables
(Xs)
Outputs
(Ys)
Process Variables (Xs)
Process
)X,...,X,f(XY n21=
©2010 International Institute for Learning, Inc., All rights reserved. 13Intelligence, Integrity and Innovation
Output to ImproveOutput to Improve Input and Process Variables to Investigate (X’s)Input and Process Variables to Investigate (X’s)
Profits Market price, costs, volume, etc.
Costs Materials, labor, cycle-time, scrap, waste, rework,
etc.
Cycle Time Lead time, bottle necks, number of approvals
needed, incentives paid to workers for production,
etc.
Business Examples for Y = f(X)
In order to improve the Y’s, you must improve the key X’s.
©2010 International Institute for Learning, Inc., All rights reserved. 14Intelligence, Integrity and Innovation©2010 International Institute for Learning, Inc., All rights reserved.
The Concept of Variation
TopicTopic
©2010 International Institute for Learning, Inc., All rights reserved. 15Intelligence, Integrity and Innovation
No two things are exactly
alike. There is variation in
every process or product.
Even things that appear
consistent or identical are
not (e.g., steel plate).
Variation is the enemy of
Quality.
Variation is Reality
_
x
Time
LoanCT
654321
9
8
7
6
5
4
3
©2010 International Institute for Learning, Inc., All rights reserved. 16Intelligence, Integrity and Innovation©2010 International Institute for Learning, Inc., All rights reserved.
Special Cause and
Common Cause Variation
TopicTopic
©2010 International Institute for Learning, Inc., All rights reserved. 17Intelligence, Integrity and Innovation
Common Cause – events
happen sometimes to
everyone – part of the
process (indicates process
needs improvement)
Special Cause – events only
happen sometimes to some
people/processes – out of
the ordinary
Two Causes of Variation
This happens
all the time
This happens
all the time
Why does this
only happen to
me?
Why does this
only happen to
me?
©2010 International Institute for Learning, Inc., All rights reserved. 18Intelligence, Integrity and Innovation
Common Cause Factors Special Cause Factors
Example: Work Commute
When you commute to work – the time it takes varies from day to day. Why?
©2010 International Institute for Learning, Inc., All rights reserved. 19Intelligence, Integrity and Innovation
Why it matters
Variation exists in all processes.
There are two fundamental causes of variation:
Special Cause & Common Cause.
Knowing the factors and the type of cause (Common versus
Special) will determine the action you should take.
Understanding Variation
©2010 International Institute for Learning, Inc., All rights reserved. 20Intelligence, Integrity and Innovation
Example: Responding to Variation
SituationSituation
All clerks make some mistakes from time
to time
Only one clerk is making mistakes
Type of VariationType of Variation Common Cause Special Cause
Appropriate ResponseAppropriate Response
Look at all the data and find out why
mistakes are being make (e.g. old clerks
not trained on new system). Make
fundamental process change (e.g., re-
train old clerks on new system).
Look at that one clerk and find out
what is different (e.g., sticky key on
keyboard). Address that specific
instance (e.g., buy new keyboard for
that clerk).
InappropriateInappropriate
ResponseResponse
Investigate each occurrence of a mistake
and try to change the process so it won’t
happen again.
Buy new keyboards for entire
department.
“Tampering” – treating Common Cause like
Special Cause – increases process variation,
wastes time trying to investigate and explain
random events, and frustrates workers
Treating Special Cause like Common –
wastes resources and may frustrate
workers
©2010 International Institute for Learning, Inc., All rights reserved. 21Intelligence, Integrity and Innovation©2010 International Institute for Learning, Inc., All rights reserved.
TopicTopic
Introduction to Control Charts
Distinguishing Common & Special Cause Variation
Example of Standard Business Reporting
©2010 International Institute for Learning, Inc., All rights reserved. 22Intelligence, Integrity and Innovation
Business Performance Report: Sales
Please assess our recent performance
1. Last month’s performance (108) is better than this month’s (101).
2. This month’s performance (101) isn’t even as good as YTD’s (102).
3. But this month’s performance (101) is better than the performance the
same month last year (98).
Let’s see if our interpretation changes when we plot our data over
time, where variation can be seen and taken into account…
©2010 International Institute for Learning, Inc., All rights reserved. 23Intelligence, Integrity and Innovation
Mean CL: 30.48
-2.68
63.65
-7.21
2.79
12.79
22.79
32.79
42.79
52.79
62.79
72.79
82.79
1
2
3
4
5
6
7
8
9
10
11
12
13
14
15
16
17
18
19
20
21
22
23
24
25
26
27
28
29
30
31
32
33
Individuals-InstallationTime
Control Chart
A picture of a process over time (e.g., Time Series Plot)
With Control Limits that help distinguish between Special Cause
variation (abnormal) and Common cause variation (normal or
systemic)
The control limits are based on the data, not customer or internal
requirements
Control Limits
©2010 International Institute for Learning, Inc., All rights reserved. 24Intelligence, Integrity and Innovation
A Control Chart helps distinguish
between Common Cause & Special
Cause Variation.
It is like a “pipeline” representing
typical, or Common Cause process
variation.
Points outside the “pipeline”, or control
limits, represent Special Cause
Variation.
The Control Limits are calculated from
the data. They do not come from the
customer, or internal requirements.
Control Charts: 50,000 Foot View
Mont h
IndividualValue
FebDecOctAugJunAprFebDecOctAugJun
115
110
105
100
95
90
85
80
_
X=97.61
UCL=104.96
LCL=90.26
1
I Char t of Scenar io 1
Mont h
IndividualValue
FebDecOctAugJunAprFebDecOctAugJun
115
110
105
100
95
90
85
80
_
X=97.61
UCL=104.96
LCL=90.26
1
I Chart of Scenario 1
Common
Cause
Special
Cause
©2010 International Institute for Learning, Inc., All rights reserved. 25Intelligence, Integrity and Innovation
Scenario 1 – Last Month Result Was Special
Cause
This chart supports
an interpretation of
a significant
change last month
– a special cause.
Mont h
Scenario1
FebDecOctAugJunAprFebDecOctAugJun
110
105
100
95
90
97.6197.61
Time Series Plot of Scenario 1
This
Month
Last
Month
Year-
To-
Date
Same
Month
Last
Year
101 108 102 98
©2010 International Institute for Learning, Inc., All rights reserved. 26Intelligence, Integrity and Innovation
Scenario 2 – Last Month Result Was Common
Cause
Last month’s result
doesn’t appear
unusual – just
common cause
variation.
Mont h
Scenario2
FebDecOctAugJunAprFebDecOctAugJun
110
105
100
95
90
97.6197.61
Time Series Plot of Scenario 2
This
Month
Last
Month
Year-
To-
Date
Same
Month
Last
Year
101 108 102 98
©2010 International Institute for Learning, Inc., All rights reserved. 27Intelligence, Integrity and Innovation
Two radically different processes, requiring
different management approaches, both
produce the same standard management
report … this should concern you!
Charting data over time gives context.
Can see patterns and variation in the data
Control Charts plot data over time and use
Control Limits to detect Special Cause
variation so appropriate action can be taken.
Do managers and workers in your company
understand the difference between common
and special cause variation? If not, then
tampering is occurring.
Conclusions: Standard Business
Reporting
Mont h
IndividualValue
FebDecOctAugJunAprFebDecOctAugJun
115
110
105
100
95
90
85
80
_
X=97.61
UCL=114.49
LCL=80.73
I Chart of Scenar io 2
Mont h
IndividualValue
FebDecOctAugJunAprFebDecOctAugJun
115
110
105
100
95
90
85
80
_
X=97.61
UCL=104.96
LCL=90.26
1
I Chart of Scenario 1
This
Month
Last
Month
Year-
To-
Date
Same
Month
Last
Year
101 108 102 98
©2010 International Institute for Learning, Inc., All rights reserved. 28Intelligence, Integrity and Innovation
Management takes a big step forward when it stops asking
workers to explain randomness.
Something to Think About…
©2010 International Institute for Learning, Inc., All rights reserved. 29Intelligence, Integrity and Innovation©2010 International Institute for Learning, Inc., All rights reserved.
TopicTopic
Poka Yoke (Error Proofing)
©2010 International Institute for Learning, Inc., All rights reserved. 30Intelligence, Integrity and Innovation
“It is good to do it right the first time. It is even better to
make it impossible to do it wrong the first time.”
Yokeru (to avoid) Poka (inadvertent errors)
A technique for eliminating errors
Three principles of Poka-Yoke:
1. Make wrong actions more difficult or impossible.
2. Make mistakes obvious to the person so that the mistake can be
corrected.
3. Detect errors so that downstream consequences can be
prevented by stopping the flow or other corrective action.
What is Poka-Yoke?
©2010 International Institute for Learning, Inc., All rights reserved. 31Intelligence, Integrity and Innovation
Auto shutoff on electric coffee pots
Child-proof caps on medications
Ground fault circuit breakers
Auto shutoff on the lawn mower
Seat belts; air bags
Child-proof door latches
Car engine warning lights
Spell check in software
Auto-save documents
Poka-Yoke in Everyday Examples
©2010 International Institute for Learning, Inc., All rights reserved. 32Intelligence, Integrity and Innovation
Use colors and color-coding
Credit card receipts (the customer gets the yellow copy)
Use shapes (symmetrical and asymmetrical)
Store different types of parts in different shaped bins
Notching a stack of forms
Make it easy to do right
Checklists and effective data collection formats
Workflows with fewer hand-offs; SOP
Control plans
Other Methods
Where can you error proof your processes?
©2010 International Institute for Learning, Inc., All rights reserved. 33Intelligence, Integrity and Innovation
Good management is about your ability to predict and improve
outcomes.
Predicting outcomes is very difficult without measurement – Y
= f x
Understanding the causes of variation will help you to make
better decisions on what to improve.
Quality comes from well defined, simple and standardized
processes with low margins for error.
In Summary
©2010 International Institute for Learning, Inc., All rights reserved. 34Intelligence, Integrity and Innovation
Questions?
All: sends text message to everyone in class
All Presenters: sends text message to each
presenter
Click drop down menu to select
All or All Presenters.
©2010 International Institute for Learning, Inc., All rights reserved. 35Intelligence, Integrity and Innovation
We invite you to get a closer look at what IIL can do for you and
your organization, including:
Virtual Classes (Public or Onsite)
Traditional Classes (Public or Onsite)
Assessments, Course Design/Development, Coaching,
Mentoring, and Consulting
Contact Wendy.Shields@iil.com and let us know how we can
meet your learning needs.
At IIL,
Our Greatest Accomplishments are Yours
©2010 International Institute for Learning, Inc., All rights reserved. 36Intelligence, Integrity and Innovation
Evaluations
Thank you for joining us today.
Please give us your feedback by completing our
webinar evaluation now.

Improving Project Management Skills with Lean Six Sigma

  • 1.
    ©2010 International Institutefor Learning, Inc., All rights reserved. 1Intelligence, Integrity and Innovation©2010 International Institute for Learning, Inc., All rights reserved. Thank you for joining us today. This webinar is brought to you by IIL a global leader in: Project, Program and Portfolio Management Microsoft® Project and Project Server Lean Six Sigma | Business Analysis PRINCE2® | ITIL® Improving Project Management Skills with Lean Six Sigma
  • 2.
    ©2010 International Institutefor Learning, Inc., All rights reserved. 2Intelligence, Integrity and Innovation Global IIL Companies IIL US IIL Asia (Singapore) IIL Australia IIL Brasil IIL Canada IIL China IIL Europe (United Kingdom) IIL Finland IIL France IIL Germany IIL Hong Kong IIL Hungary IIL India IIL Japan IIL Korea (Seoul) IIL México IIL Middle East (Dubai) IIL Spain
  • 3.
    ©2010 International Institutefor Learning, Inc., All rights reserved. 3Intelligence, Integrity and Innovation Welcome to IIL’s Virtual Classroom Click the Yes button to answer “Yes” Click the No button to answer “No” Click the Applaud button to indicate “applause” Click the Laugh button to indicate “laughter”
  • 4.
    ©2010 International Institutefor Learning, Inc., All rights reserved. 4Intelligence, Integrity and Innovation Too loud? Too soft? Use the slider to the right of the speaker to adjust the volume.
  • 5.
    ©2010 International Institutefor Learning, Inc., All rights reserved. 5Intelligence, Integrity and Innovation The goal of this webinar is to provide participants with three important concepts/techniques from Lean Six Sigma that every project manager should know and apply to improve project and product quality. Webinar Goal
  • 6.
    ©2010 International Institutefor Learning, Inc., All rights reserved. 6Intelligence, Integrity and Innovation At the end of this session, you should be able to: Define Lean Six Sigma from a high level. Identify vital inputs to improve outputs. Determine the difference between Common Cause and Special Cause Variation. Error proof project processes using Poka Yoke. Webinar Objectives
  • 7.
    ©2010 International Institutefor Learning, Inc., All rights reserved. 7Intelligence, Integrity and Innovation©2010 International Institute for Learning, Inc., All rights reserved. Lean Six Sigma Quality TopicTopic
  • 8.
    ©2010 International Institutefor Learning, Inc., All rights reserved. 8Intelligence, Integrity and Innovation Take a minute to think of a product or service that you have purchased and considered to be “high quality.” What are the attributes that led you to that conclusion? Please answer in Text Chat. What is Quality?
  • 9.
    ©2010 International Institutefor Learning, Inc., All rights reserved. 9Intelligence, Integrity and Innovation Improvement of Results starts with improvement of Quality. Dr. Deming was a quality and process improvement pioneer credited with helping the Japanese industry recover after World War II. 1. Lean Six Sigma is about improving results by improving the quality of products and services. 2. Improvement comes from managing the process, not the results. Deming’s Chain Reaction
  • 10.
    ©2010 International Institutefor Learning, Inc., All rights reserved. 10Intelligence, Integrity and Innovation Both methodologies are geared towards reducing costs. Lean Focus – Speed Cycle Time Reduction Cleanliness and Orderliness Elimination of Waste Rapid Project Execution Error Proofing Six Sigma Focus – Quality Customer-focused (customer pain) Financially-focused (financial Impact) Methodology (DMAIC) Support Infrastructure (Project Framework) Defect Reduction Data-based (management by fact) What is Lean Six Sigma? Six Sigma Lean
  • 11.
    ©2010 International Institutefor Learning, Inc., All rights reserved. 11Intelligence, Integrity and Innovation©2010 International Institute for Learning, Inc., All rights reserved. Improving Outcomes – Management by Fact TopicTopic
  • 12.
    ©2010 International Institutefor Learning, Inc., All rights reserved. 12Intelligence, Integrity and Innovation The Mathematical Model Defined processes enables you to control processes using the model. Input Variables (Xs) Outputs (Ys) Process Variables (Xs) Process )X,...,X,f(XY n21=
  • 13.
    ©2010 International Institutefor Learning, Inc., All rights reserved. 13Intelligence, Integrity and Innovation Output to ImproveOutput to Improve Input and Process Variables to Investigate (X’s)Input and Process Variables to Investigate (X’s) Profits Market price, costs, volume, etc. Costs Materials, labor, cycle-time, scrap, waste, rework, etc. Cycle Time Lead time, bottle necks, number of approvals needed, incentives paid to workers for production, etc. Business Examples for Y = f(X) In order to improve the Y’s, you must improve the key X’s.
  • 14.
    ©2010 International Institutefor Learning, Inc., All rights reserved. 14Intelligence, Integrity and Innovation©2010 International Institute for Learning, Inc., All rights reserved. The Concept of Variation TopicTopic
  • 15.
    ©2010 International Institutefor Learning, Inc., All rights reserved. 15Intelligence, Integrity and Innovation No two things are exactly alike. There is variation in every process or product. Even things that appear consistent or identical are not (e.g., steel plate). Variation is the enemy of Quality. Variation is Reality _ x Time LoanCT 654321 9 8 7 6 5 4 3
  • 16.
    ©2010 International Institutefor Learning, Inc., All rights reserved. 16Intelligence, Integrity and Innovation©2010 International Institute for Learning, Inc., All rights reserved. Special Cause and Common Cause Variation TopicTopic
  • 17.
    ©2010 International Institutefor Learning, Inc., All rights reserved. 17Intelligence, Integrity and Innovation Common Cause – events happen sometimes to everyone – part of the process (indicates process needs improvement) Special Cause – events only happen sometimes to some people/processes – out of the ordinary Two Causes of Variation This happens all the time This happens all the time Why does this only happen to me? Why does this only happen to me?
  • 18.
    ©2010 International Institutefor Learning, Inc., All rights reserved. 18Intelligence, Integrity and Innovation Common Cause Factors Special Cause Factors Example: Work Commute When you commute to work – the time it takes varies from day to day. Why?
  • 19.
    ©2010 International Institutefor Learning, Inc., All rights reserved. 19Intelligence, Integrity and Innovation Why it matters Variation exists in all processes. There are two fundamental causes of variation: Special Cause & Common Cause. Knowing the factors and the type of cause (Common versus Special) will determine the action you should take. Understanding Variation
  • 20.
    ©2010 International Institutefor Learning, Inc., All rights reserved. 20Intelligence, Integrity and Innovation Example: Responding to Variation SituationSituation All clerks make some mistakes from time to time Only one clerk is making mistakes Type of VariationType of Variation Common Cause Special Cause Appropriate ResponseAppropriate Response Look at all the data and find out why mistakes are being make (e.g. old clerks not trained on new system). Make fundamental process change (e.g., re- train old clerks on new system). Look at that one clerk and find out what is different (e.g., sticky key on keyboard). Address that specific instance (e.g., buy new keyboard for that clerk). InappropriateInappropriate ResponseResponse Investigate each occurrence of a mistake and try to change the process so it won’t happen again. Buy new keyboards for entire department. “Tampering” – treating Common Cause like Special Cause – increases process variation, wastes time trying to investigate and explain random events, and frustrates workers Treating Special Cause like Common – wastes resources and may frustrate workers
  • 21.
    ©2010 International Institutefor Learning, Inc., All rights reserved. 21Intelligence, Integrity and Innovation©2010 International Institute for Learning, Inc., All rights reserved. TopicTopic Introduction to Control Charts Distinguishing Common & Special Cause Variation Example of Standard Business Reporting
  • 22.
    ©2010 International Institutefor Learning, Inc., All rights reserved. 22Intelligence, Integrity and Innovation Business Performance Report: Sales Please assess our recent performance 1. Last month’s performance (108) is better than this month’s (101). 2. This month’s performance (101) isn’t even as good as YTD’s (102). 3. But this month’s performance (101) is better than the performance the same month last year (98). Let’s see if our interpretation changes when we plot our data over time, where variation can be seen and taken into account…
  • 23.
    ©2010 International Institutefor Learning, Inc., All rights reserved. 23Intelligence, Integrity and Innovation Mean CL: 30.48 -2.68 63.65 -7.21 2.79 12.79 22.79 32.79 42.79 52.79 62.79 72.79 82.79 1 2 3 4 5 6 7 8 9 10 11 12 13 14 15 16 17 18 19 20 21 22 23 24 25 26 27 28 29 30 31 32 33 Individuals-InstallationTime Control Chart A picture of a process over time (e.g., Time Series Plot) With Control Limits that help distinguish between Special Cause variation (abnormal) and Common cause variation (normal or systemic) The control limits are based on the data, not customer or internal requirements Control Limits
  • 24.
    ©2010 International Institutefor Learning, Inc., All rights reserved. 24Intelligence, Integrity and Innovation A Control Chart helps distinguish between Common Cause & Special Cause Variation. It is like a “pipeline” representing typical, or Common Cause process variation. Points outside the “pipeline”, or control limits, represent Special Cause Variation. The Control Limits are calculated from the data. They do not come from the customer, or internal requirements. Control Charts: 50,000 Foot View Mont h IndividualValue FebDecOctAugJunAprFebDecOctAugJun 115 110 105 100 95 90 85 80 _ X=97.61 UCL=104.96 LCL=90.26 1 I Char t of Scenar io 1 Mont h IndividualValue FebDecOctAugJunAprFebDecOctAugJun 115 110 105 100 95 90 85 80 _ X=97.61 UCL=104.96 LCL=90.26 1 I Chart of Scenario 1 Common Cause Special Cause
  • 25.
    ©2010 International Institutefor Learning, Inc., All rights reserved. 25Intelligence, Integrity and Innovation Scenario 1 – Last Month Result Was Special Cause This chart supports an interpretation of a significant change last month – a special cause. Mont h Scenario1 FebDecOctAugJunAprFebDecOctAugJun 110 105 100 95 90 97.6197.61 Time Series Plot of Scenario 1 This Month Last Month Year- To- Date Same Month Last Year 101 108 102 98
  • 26.
    ©2010 International Institutefor Learning, Inc., All rights reserved. 26Intelligence, Integrity and Innovation Scenario 2 – Last Month Result Was Common Cause Last month’s result doesn’t appear unusual – just common cause variation. Mont h Scenario2 FebDecOctAugJunAprFebDecOctAugJun 110 105 100 95 90 97.6197.61 Time Series Plot of Scenario 2 This Month Last Month Year- To- Date Same Month Last Year 101 108 102 98
  • 27.
    ©2010 International Institutefor Learning, Inc., All rights reserved. 27Intelligence, Integrity and Innovation Two radically different processes, requiring different management approaches, both produce the same standard management report … this should concern you! Charting data over time gives context. Can see patterns and variation in the data Control Charts plot data over time and use Control Limits to detect Special Cause variation so appropriate action can be taken. Do managers and workers in your company understand the difference between common and special cause variation? If not, then tampering is occurring. Conclusions: Standard Business Reporting Mont h IndividualValue FebDecOctAugJunAprFebDecOctAugJun 115 110 105 100 95 90 85 80 _ X=97.61 UCL=114.49 LCL=80.73 I Chart of Scenar io 2 Mont h IndividualValue FebDecOctAugJunAprFebDecOctAugJun 115 110 105 100 95 90 85 80 _ X=97.61 UCL=104.96 LCL=90.26 1 I Chart of Scenario 1 This Month Last Month Year- To- Date Same Month Last Year 101 108 102 98
  • 28.
    ©2010 International Institutefor Learning, Inc., All rights reserved. 28Intelligence, Integrity and Innovation Management takes a big step forward when it stops asking workers to explain randomness. Something to Think About…
  • 29.
    ©2010 International Institutefor Learning, Inc., All rights reserved. 29Intelligence, Integrity and Innovation©2010 International Institute for Learning, Inc., All rights reserved. TopicTopic Poka Yoke (Error Proofing)
  • 30.
    ©2010 International Institutefor Learning, Inc., All rights reserved. 30Intelligence, Integrity and Innovation “It is good to do it right the first time. It is even better to make it impossible to do it wrong the first time.” Yokeru (to avoid) Poka (inadvertent errors) A technique for eliminating errors Three principles of Poka-Yoke: 1. Make wrong actions more difficult or impossible. 2. Make mistakes obvious to the person so that the mistake can be corrected. 3. Detect errors so that downstream consequences can be prevented by stopping the flow or other corrective action. What is Poka-Yoke?
  • 31.
    ©2010 International Institutefor Learning, Inc., All rights reserved. 31Intelligence, Integrity and Innovation Auto shutoff on electric coffee pots Child-proof caps on medications Ground fault circuit breakers Auto shutoff on the lawn mower Seat belts; air bags Child-proof door latches Car engine warning lights Spell check in software Auto-save documents Poka-Yoke in Everyday Examples
  • 32.
    ©2010 International Institutefor Learning, Inc., All rights reserved. 32Intelligence, Integrity and Innovation Use colors and color-coding Credit card receipts (the customer gets the yellow copy) Use shapes (symmetrical and asymmetrical) Store different types of parts in different shaped bins Notching a stack of forms Make it easy to do right Checklists and effective data collection formats Workflows with fewer hand-offs; SOP Control plans Other Methods Where can you error proof your processes?
  • 33.
    ©2010 International Institutefor Learning, Inc., All rights reserved. 33Intelligence, Integrity and Innovation Good management is about your ability to predict and improve outcomes. Predicting outcomes is very difficult without measurement – Y = f x Understanding the causes of variation will help you to make better decisions on what to improve. Quality comes from well defined, simple and standardized processes with low margins for error. In Summary
  • 34.
    ©2010 International Institutefor Learning, Inc., All rights reserved. 34Intelligence, Integrity and Innovation Questions? All: sends text message to everyone in class All Presenters: sends text message to each presenter Click drop down menu to select All or All Presenters.
  • 35.
    ©2010 International Institutefor Learning, Inc., All rights reserved. 35Intelligence, Integrity and Innovation We invite you to get a closer look at what IIL can do for you and your organization, including: Virtual Classes (Public or Onsite) Traditional Classes (Public or Onsite) Assessments, Course Design/Development, Coaching, Mentoring, and Consulting Contact Wendy.Shields@iil.com and let us know how we can meet your learning needs. At IIL, Our Greatest Accomplishments are Yours
  • 36.
    ©2010 International Institutefor Learning, Inc., All rights reserved. 36Intelligence, Integrity and Innovation Evaluations Thank you for joining us today. Please give us your feedback by completing our webinar evaluation now.

Editor's Notes

  • #4 Your instructor will walk you through the Key Features of the Virtual Classroom in the first session and as needed throughout the class. This page will serve as a reminder for the most frequently used features. The Centra Virtual Classroom has been designed to transfer knowledge to large groups of participants or smaller groupings of individuals that the instructor will put into breakout rooms. If you class will utilize breakout rooms, the instructor will provide instructions as to how they are used.
  • #29 Quote from Wayne Fuller.
  • #35 If you still have questions, now would be a good time to ask them.
  • #37 We really appreciate your attendance and participation in this course. If you found this to be a valuable experience, please recommend the course to your friends and coworkers! The instructor will now solicit your feedback by handing out a course evaluation sheet. Please complete the evaluation and place it on the instructor’s table as you leave the classroom. If you are taking this class in IIL’s virtual eLearning environment, complete the evaluation form online.