Downloaded 89 times
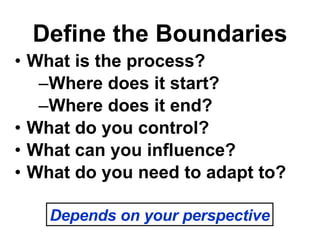
![Process Improvement Workshop Scott Miller [email_address] 937-781-1068 Dan Dupree [email_address] 937-781-1061 Learn. Perform. Succeed.](https://image.slidesharecdn.com/2007stlacqinsday-processimprovement-090422194229-phpapp02/85/Process-Improvement-Workshop-1-320.jpg)
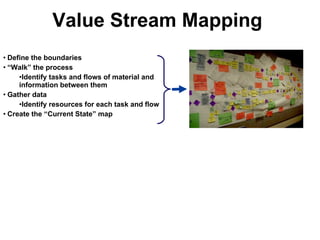
![Process Improvement Workshop Scott Miller [email_address] 937-781-1068 Dan Dupree [email_address] 937-781-1061 Learn. Perform. Succeed.](https://image.slidesharecdn.com/2007stlacqinsday-processimprovement-090422194229-phpapp02/75/Process-Improvement-Workshop-1-2048.jpg)

![Thank you for Participating Scott Miller [email_address] 937-781-1068 Dan Dupree [email_address] 937-781-1061 Learn. Perform. Succeed.](https://image.slidesharecdn.com/2007stlacqinsday-processimprovement-090422194229-phpapp02/85/Process-Improvement-Workshop-28-320.jpg)

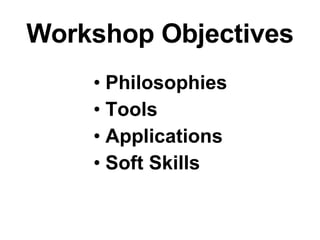
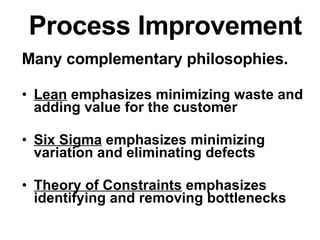
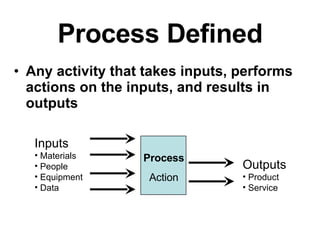
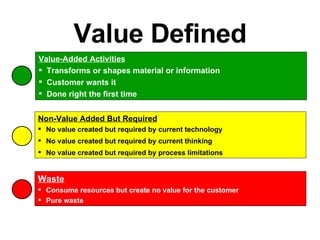
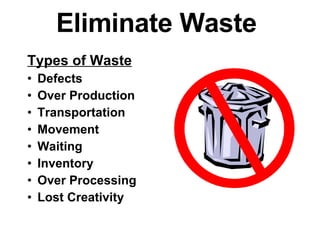
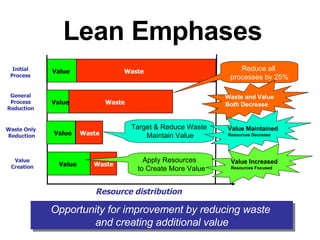
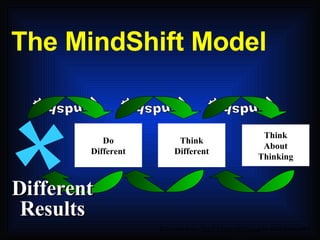
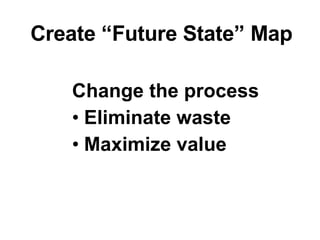
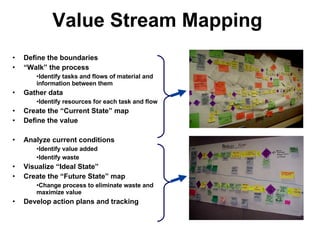
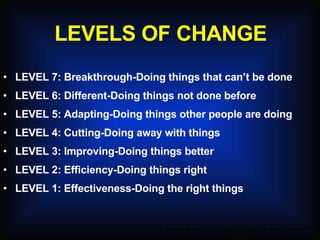
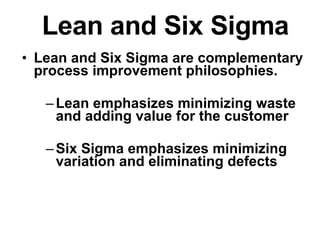
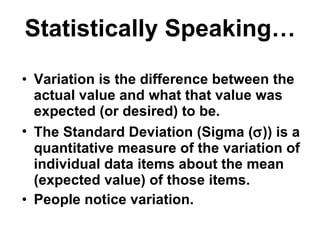
1) The document outlines objectives and tools for a process improvement workshop including Lean, Six Sigma, and Theory of Constraints methodologies. 2) It discusses defining and mapping current and future process states to identify waste and maximize value using tools like value stream mapping. 3) The goal is to eliminate waste and variation to improve processes by 25% or more and support continuous learning.