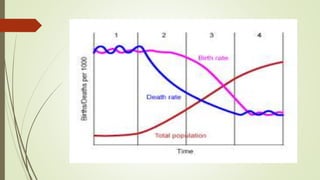
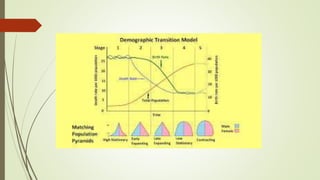
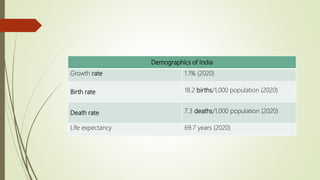
India has experienced rapid population growth and currently has a large, young population. It entered the second stage of demographic transition in the early 20th century, resulting in high birth rates and declining death rates. Currently, India's population is over 1.3 billion with a growth rate of around 1.1% annually and a population density of over 400 people per square kilometer. While India has made progress increasing food production and literacy rates, its population size has put pressure on resources and the economy, with many Indians still facing issues like poverty, unemployment and low standards of living.
How people can be used as resource.Initiaves of government .programs of governement.quality of population in terms of health and education.rising population of india an asset of rthe country how? hurdles in making rising population an asset . conclusion
Demographic profile of INDIA - Opportunity or ThreatVijeth Karthik
Demographic change in India is opening up new economic opportunities. As in many countries, declining infant and child mortality helped to spark lower fertility, effectively resulting in a temporary baby boom. As this cohort moves into working
ages, India finds itself with a potentially higher share of workers as compared with dependent. If working-age people can be productively employed, India’s economic growth stands to accelerate. Theoretical and empirical literature on the effect of demographics on labour supply, savings, and economic growth underpins this effort to understand and forecast economic growth in India. Policy choices can potentiate India’s realisation of economic benefits stemming from demographic change. Failure to take advantage of the opportunities inherent in demographic change can lead to economic stagnation.
The Human Development Index is is a composite index measuring average achievement in three basic dimensions of human development that tracks progress in providing a long and healthy life, improved knowledge and a decent standard of living.
these slides are according to Pakistan HDI and covering the aspects and some important details of HDI.
Little bit description and introduction of HDI as well.
Human Resources and Economic DevelopmentAyesha Arshad
INTRODUCTION TO HUMAN RESOURCES & ECONOMIC DEVELOPMENT
INDICATORS OF HUMAN RESOURCES
IMPORTANCE OF HR DEVELOPMENT
COMPONENTS OF HUMAN RESOURCE DEVELOPMENT
SOCIAL/ NON-ECONOMIC FACTORS OF ECONOMIC GROWTH
Small assignment I did to investigate Human Development Indicators of Pakistan V Srilanka V UAE and couple more.
All data is available from UNDP Website
Human Development Index presentation - SlideshareAditiTewari4
Human Devlopment Index or HDi measures the well - being of a countries people Both Growth and Development refer to changes over a period of time:-
Growth:-
Quantitative and neutral change.
Positive or a negative .
Development:-
Qualitative change which is value positive.
Development occurs when positive growth takes place
HDI emphasizes that people and their capabilities should be the ultimate criteria for assessing the development of a country, not economic growth alone.
HDI measures average achievement of a country in three basic dimensions of human development:
A long and healthy life,
Access to knowledge, and
A decent standard of living.
Presentation of website project that introduces the concept of Human Development Index, which includes an interactive visualization (choropleth and cartogram) and a table with sparklines (of some selected countries).
Human capital refers to the stock of skill, ability, expertise, education, and knowledge in a nation at a point of time. We need investment in human capital to produce more human capital out of human resources.Nations require adequate human capital who are educated and qualified as educators and other specialists. In other words, we need great human capital to create other human capital like doctors, engineers, professors, etc., which will later become a human asset and contribute to the economy of the country.Human resources are the people who are part of the workforce and contribute to the productivity of a country. The quality and efficiency of human resources depend on factors such as health, education, skills, and motivation. Different countries have different levels of human resource development and potential. For example, India has a large and young population that can provide a demographic dividend if properly educated and employedThe term human resources refers to the size of the population of a country along with its efficiency, educational qualities, productivity, organisational abilities and farsightedness. It is the ultimate resource, but not equally distributed over the worldIndia has 62.5% of its population in the age group of 15-59 years which is ever increasing and will be at the peak around 2036 when it will reach approximately 65%.These population parameters indicate an availability of demographic dividend in India, which started in 2005-06 and will last till 2055-56.According to Economic Survey 2018-19,India’s Demographic Dividend will peak around 2041, when the share of working-age,i.e. 20-59 years, population is expected to hit 59%.India has one of the youngest populations in an aging world. By 2020, the median age in India will be just 28, compared to 37 in China and the US, 45 in Western Europe, and 49 in Japan.Since 2018, India’s working-age population (people between 15 and 64 years of age) has grown larger than the dependents population — children aged 14 or below as well as people above 65 years of age. This bulge in the working-age population is going to last till 2055, or 37 years from its beginning.This transition happens largely because of a decrease in the total fertility rate(TFR, which is the number of births per woman) after the increase in life expectancy gets stabilised.A study on demographic dividend in India by United Nations Population Fund (UNFPA) throws up two interesting facts.The window of demographic dividend opportunity in India is available for five decades from 2005-06 to 2055-56, longer than any other country in the world.This demographic dividend window is available at different times in different states because of differential behaviour of the population parameter.
This PPT is made to increase the knowledge of a person on the topic Population mainly India's Population and all things related to it in a single presentation.
India’s wealth and poverty levelsThis study will focus on the ec.docxdirkrplav
India’s wealth and poverty levels
This study will focus on the economic standards of India and the factors that have lead India to have a wealth and poor population at the same time. India over the last couple of year, it has experienced an increased per capita income due to its increased work force. Also, India has been known as one of the countries with a large population languishing over poverty.
India has been experiencing an increase in its economic growth rate over the last four years. In the fiscal year 2014 - 2015 the country had a 7.4% economic increase compared to a 6.9% increase in the fiscal year 2013 - 2014. The country is projecting an economic increase in the fiscal year 2015- 2016 of 7.5%. India was listed the 19th largest merchandise in the year 2013 and with a large export of services which saw India in the 6th position worldwide. The country is not only in the top service export list but also in the import list it was ranked 7th importing merchandise of worthy of $616.7 billion in a total.
In fact, this increase in India’s economic growth has been due to an increased output and high performance of two industries that are the agriculture industry and manufacturing industries. These industries the largest India’s economic growth shareholders and their performance influence the country’s economic growth rate in every fiscal year (Maddison, 2013).
Moreover, India has been among the best known manufacturing industry in the world. This has in turn led the government to allow investors in the country to invest in the sector. The fast growing and large population has provided force labor to the upcoming industries (Maddison, 2013). A large percentage of India’s population is comprised of poor citizens who in turn provide cheap labor to the industries, hence low input which gives the companies large marginal profits.
In addition, the large Indian population has also been a target for the manufacturing industries whose final products are consumed locally in the country before they are exported to other countries. India’s large population has been in the service that also has contributed to the county’s economic growth (Maddison, 2013). The service sector offers services like the tourism, heath care; telecommunication and trade travel services between other many services. These statistics shows that India has been experiencing an increase in its economy.
Furthermore, India is one of the countries that are known to poses both a rich group of individuals and at the same time a large population in poverty. The number of poor in India is reducing significantly over the past four years. Though there are different methods to measure poverty a conclusion has been achieved that India has a large population living under the poverty line. India’s population has been increasing yearly at a rate of 1.8 million people (Krishna, 2006). This has led to their population reaching 1.28 billion people. According to a research curried out by the wo.
Essay India’s Aging Population
Essay On Growth Of India
India Essays
India A Developing Country
Essay On Expo 2020
Essay On Nationalism In India
Essay on Geography of India
Migrant Workers Essay
It deals features of Indian Economy - Indicators - Poverty - Unemployment - Population growth - Economic development - Agriculture Sectors - Industrial Sectors - Service Sectors - Economic Reforms
Falcon stands out as a top-tier P2P Invoice Discounting platform in India, bridging esteemed blue-chip companies and eager investors. Our goal is to transform the investment landscape in India by establishing a comprehensive destination for borrowers and investors with diverse profiles and needs, all while minimizing risk. What sets Falcon apart is the elimination of intermediaries such as commercial banks and depository institutions, allowing investors to enjoy higher yields.
how to sell pi coins in all Africa Countries.DOT TECH
Yes. You can sell your pi network for other cryptocurrencies like Bitcoin, usdt , Ethereum and other currencies And this is done easily with the help from a pi merchant.
What is a pi merchant ?
Since pi is not launched yet in any exchange. The only way you can sell right now is through merchants.
A verified Pi merchant is someone who buys pi network coins from miners and resell them to investors looking forward to hold massive quantities of pi coins before mainnet launch in 2026.
I will leave the telegram contact of my personal pi merchant to trade with.
@Pi_vendor_247
how can I sell my pi coins for cash in a pi APPDOT TECH
You can't sell your pi coins in the pi network app. because it is not listed yet on any exchange.
The only way you can sell is by trading your pi coins with an investor (a person looking forward to hold massive amounts of pi coins before mainnet launch) .
You don't need to meet the investor directly all the trades are done with a pi vendor/merchant (a person that buys the pi coins from miners and resell it to investors)
I Will leave The telegram contact of my personal pi vendor, if you are finding a legitimate one.
@Pi_vendor_247
#pi network
#pi coins
#money
If you are looking for a pi coin investor. Then look no further because I have the right one he is a pi vendor (he buy and resell to whales in China). I met him on a crypto conference and ever since I and my friends have sold more than 10k pi coins to him And he bought all and still want more. I will drop his telegram handle below just send him a message.
@Pi_vendor_247
how to sell pi coins on Bitmart crypto exchangeDOT TECH
Yes. Pi network coins can be exchanged but not on bitmart exchange. Because pi network is still in the enclosed mainnet. The only way pioneers are able to trade pi coins is by reselling the pi coins to pi verified merchants.
A verified merchant is someone who buys pi network coins and resell it to exchanges looking forward to hold till mainnet launch.
I will leave the telegram contact of my personal pi merchant to trade with.
@Pi_vendor_247
how to sell pi coins effectively (from 50 - 100k pi)DOT TECH
Anywhere in the world, including Africa, America, and Europe, you can sell Pi Network Coins online and receive cash through online payment options.
Pi has not yet been launched on any exchange because we are currently using the confined Mainnet. The planned launch date for Pi is June 28, 2026.
Reselling to investors who want to hold until the mainnet launch in 2026 is currently the sole way to sell.
Consequently, right now. All you need to do is select the right pi network provider.
Who is a pi merchant?
An individual who buys coins from miners on the pi network and resells them to investors hoping to hang onto them until the mainnet is launched is known as a pi merchant.
debuts.
I'll provide you the Telegram username
@Pi_vendor_247
Introduction to Indian Financial System ()Avanish Goel
The financial system of a country is an important tool for economic development of the country, as it helps in creation of wealth by linking savings with investments.
It facilitates the flow of funds form the households (savers) to business firms (investors) to aid in wealth creation and development of both the parties
NO1 Uk Divorce problem uk all amil baba in karachi,lahore,pakistan talaq ka m...Amil Baba Dawood bangali
Contact with Dawood Bhai Just call on +92322-6382012 and we'll help you. We'll solve all your problems within 12 to 24 hours and with 101% guarantee and with astrology systematic. If you want to take any personal or professional advice then also you can call us on +92322-6382012 , ONLINE LOVE PROBLEM & Other all types of Daily Life Problem's.Then CALL or WHATSAPP us on +92322-6382012 and Get all these problems solutions here by Amil Baba DAWOOD BANGALI
#vashikaranspecialist #astrologer #palmistry #amliyaat #taweez #manpasandshadi #horoscope #spiritual #lovelife #lovespell #marriagespell#aamilbabainpakistan #amilbabainkarachi #powerfullblackmagicspell #kalajadumantarspecialist #realamilbaba #AmilbabainPakistan #astrologerincanada #astrologerindubai #lovespellsmaster #kalajaduspecialist #lovespellsthatwork #aamilbabainlahore#blackmagicformarriage #aamilbaba #kalajadu #kalailam #taweez #wazifaexpert #jadumantar #vashikaranspecialist #astrologer #palmistry #amliyaat #taweez #manpasandshadi #horoscope #spiritual #lovelife #lovespell #marriagespell#aamilbabainpakistan #amilbabainkarachi #powerfullblackmagicspell #kalajadumantarspecialist #realamilbaba #AmilbabainPakistan #astrologerincanada #astrologerindubai #lovespellsmaster #kalajaduspecialist #lovespellsthatwork #aamilbabainlahore #blackmagicforlove #blackmagicformarriage #aamilbaba #kalajadu #kalailam #taweez #wazifaexpert #jadumantar #vashikaranspecialist #astrologer #palmistry #amliyaat #taweez #manpasandshadi #horoscope #spiritual #lovelife #lovespell #marriagespell#aamilbabainpakistan #amilbabainkarachi #powerfullblackmagicspell #kalajadumantarspecialist #realamilbaba #AmilbabainPakistan #astrologerincanada #astrologerindubai #lovespellsmaster #kalajaduspecialist #lovespellsthatwork #aamilbabainlahore #Amilbabainuk #amilbabainspain #amilbabaindubai #Amilbabainnorway #amilbabainkrachi #amilbabainlahore #amilbabaingujranwalan #amilbabainislamabad
The European Unemployment Puzzle: implications from population agingGRAPE
We study the link between the evolving age structure of the working population and unemployment. We build a large new Keynesian OLG model with a realistic age structure, labor market frictions, sticky prices, and aggregate shocks. Once calibrated to the European economy, we quantify the extent to which demographic changes over the last three decades have contributed to the decline of the unemployment rate. Our findings yield important implications for the future evolution of unemployment given the anticipated further aging of the working population in Europe. We also quantify the implications for optimal monetary policy: lowering inflation volatility becomes less costly in terms of GDP and unemployment volatility, which hints that optimal monetary policy may be more hawkish in an aging society. Finally, our results also propose a partial reversal of the European-US unemployment puzzle due to the fact that the share of young workers is expected to remain robust in the US.
Latino Buying Power - May 2024 Presentation for Latino CaucusDanay Escanaverino
Unlock the potential of Latino Buying Power with this in-depth SlideShare presentation. Explore how the Latino consumer market is transforming the American economy, driven by their significant buying power, entrepreneurial contributions, and growing influence across various sectors.
**Key Sections Covered:**
1. **Economic Impact:** Understand the profound economic impact of Latino consumers on the U.S. economy. Discover how their increasing purchasing power is fueling growth in key industries and contributing to national economic prosperity.
2. **Buying Power:** Dive into detailed analyses of Latino buying power, including its growth trends, key drivers, and projections for the future. Learn how this influential group’s spending habits are shaping market dynamics and creating opportunities for businesses.
3. **Entrepreneurial Contributions:** Explore the entrepreneurial spirit within the Latino community. Examine how Latino-owned businesses are thriving and contributing to job creation, innovation, and economic diversification.
4. **Workforce Statistics:** Gain insights into the role of Latino workers in the American labor market. Review statistics on employment rates, occupational distribution, and the economic contributions of Latino professionals across various industries.
5. **Media Consumption:** Understand the media consumption habits of Latino audiences. Discover their preferences for digital platforms, television, radio, and social media. Learn how these consumption patterns are influencing advertising strategies and media content.
6. **Education:** Examine the educational achievements and challenges within the Latino community. Review statistics on enrollment, graduation rates, and fields of study. Understand the implications of education on economic mobility and workforce readiness.
7. **Home Ownership:** Explore trends in Latino home ownership. Understand the factors driving home buying decisions, the challenges faced by Latino homeowners, and the impact of home ownership on community stability and economic growth.
This SlideShare provides valuable insights for marketers, business owners, policymakers, and anyone interested in the economic influence of the Latino community. By understanding the various facets of Latino buying power, you can effectively engage with this dynamic and growing market segment.
Equip yourself with the knowledge to leverage Latino buying power, tap into their entrepreneurial spirit, and connect with their unique cultural and consumer preferences. Drive your business success by embracing the economic potential of Latino consumers.
**Keywords:** Latino buying power, economic impact, entrepreneurial contributions, workforce statistics, media consumption, education, home ownership, Latino market, Hispanic buying power, Latino purchasing power.
what is the best method to sell pi coins in 2024DOT TECH
The best way to sell your pi coins safely is trading with an exchange..but since pi is not launched in any exchange, and second option is through a VERIFIED pi merchant.
Who is a pi merchant?
A pi merchant is someone who buys pi coins from miners and pioneers and resell them to Investors looking forward to hold massive amounts before mainnet launch in 2026.
I will leave the telegram contact of my personal pi merchant to trade pi coins with.
@Pi_vendor_247
2. The following are features of India’s population:
Large Size and Fast Growth
3. 2. Second Stage of Demographic Transition:
According to the theory of demographic transition, the population growth of a country
passes through three different stages as development proceeds. The first stage is characterised
by high birth rate and high death rate. So in this stage the net growth of population is zero. Till
1921, India was in the 1st stage of demographic transition.
The second stage is featured by high birth rate and declining death rate leading to the rapid
growth of population. India entered the second stage of demographic transition after 1921
4.
5.
6. Demographics of India
Growth rate 1.1% (2020)
Birth rate 18.2 births/1,000 population (2020)
Death rate 7.3 deaths/1,000 population (2020)
Life expectancy 69.7 years (2020)
7. Rapidly Rising Density:
India occupies 2.4 per-cent of the total land area of the world but supports 17.7 per-cent of
the total world population.
Population Density 464 per sq km
In 2011,325 persons per sq km
The density of population in India was 117 per square km. in 1951
8. Sex Ratio
Sex Ratio of India is 108.176, i.e., 108.176 males per 100 females in 2020. It
means that India has 924 females per 1000 males.
9. India has more than 50% of its population below the age of 25 and more than
65% below the age of 35.
10. Population Pyramid
A population pyramid is a graphical representation of the age and sex composition
of a specific population.
• It consists of two histograms, one for each gender (by convention, men on the
left and women on the right) where the numbers are shown horizontally and
the ages vertically.
• The numbers by gender and by age depend on interactions between fertility,
mortality and migrations.
• The shape of the pyramid and its variations over the years depend, above all, on
the variations in fertility.
• The pyramid can also assume a columnar shape (with vertical sides rather than
sloped sides), or have an irregular profile.
14. • India’s pyramid is bottom heavy i.e. the Indian population has a larger proportion of children,
teenagers and young adults compared to China’s.
• Population Distribution
• India
• The country’s population for the age cohorts of 0-4, 5-9, 10-14 and 15-19 is roughly equal, whereas the numbers for
older groups become progressively smaller.
• This means that the country’s younger age groups have stopped growing in numbers now and are likely to shrink slightly
soon.
• This, however, does not mean that India’s population will also start shrinking soon.
• Except for the oldest groups, India seems to have more males than females for every cohort.
• China
• The country’s largest cohort is in its late 40s, although it is more gender balanced than its younger cohorts,
suggesting that sex-selective abortions are likely to have taken off in the last few decades.
15. • Working Age Population
In 25-65 age group, India currently has around 650 million people and China 830
million.
• By 2040, India is likely to reach 900 million, whereas China will have around 730
million.
• In other words, India will go from having 180 million less working-age people
than China today to about 170 million more—a net gain of a third of a billion in
20 years.
16. Way Forward
• Just having people in the working age is not enough. How many are in the labour
force and their productivity are important. The government needs to focus on
the same.
• India needs to invest more, and efficiently, in human capital and infrastructure.
• For the former, investments in health and sanitation have to be sustained and
more Public Private Partnership (PPP) models are required to ensure basic education.
• For the latter, a bigger push for affordable rental housing in cities has to be
considered, along with more investments in rail connectivity.
17. 6. Predominance of Rural Population:
Another feature of Indian population is the dominance of rural population. In 1951, rural
population was 82.7% and urban population was 17.3%.
Current 35 % urban 65% rural
18. Low Quality Population:
The quality of population can be judged from life expectancy, the level of literacy and level
of training of people. Keeping these parameters in mind, quality of population in India is low.
HDI index ranking 129
Low Literacy Level:
Literacy Level in India is low. Literacy level in 1991 was 52.2% while male-female
literacy ratio was 64.1 and 39.3 percent. In 2001, the literacy rate improved to 65.4 percent
out of which made literacy was 75.8 and female literacy was 52.1 percent.
As per NSO, India's average literacy rate is 77.7%(current)
19. Education level
Education in India is primarily provided by public schools (controlled and funded by the
government at three levels: central, state and local) and private schools. Under various articles of
the Indian Constitution, free and compulsory education is provided as a fundamental right to
children aged 6 to 14. The approximate ratio of public schools to private schools in India is 7:5.
India has made progress in increasing the attainment rate of primary education.
In 2011, Approximately 75% of the population, aged between 7 and 10 years, was literate.
India's improved education system is often cited as one of the main contributors to its economic
development.
Much of the progress, especially in higher education and scientific research, has been credited to
various public institutions.
While enrollment in higher education has increased steadily over the past decade, reaching a gross
enrollment ratio of 24% in 2013,
there still remains a significant distance to catch up with tertiary education enrolment levels of
developed nations, a challenge that will be necessary to overcome in order to continue to reap a
demographic dividend from India's comparatively young population.
21. Low Life Expectancy:
By life expectancy we mean the average number of years a person is expected to live. Life
expectancy in India was 33 years. It was increased to 59 in 1991 and in 2001, life
expectancy increased to 63.9.
Current 69.27 years
22. Work Participation rate-49.8%
The labour force participation rate stood at 49.8% in 2017-18, falling sharply
from 55.9% in 2011-12. Half of India's working-age population (15 years and
above), for the first time, is not contributing to any economic activity, according to
the National Sample Survey Office's (NSSO's) latest jobs survey
25. Symptoms of Over-population:
The concept of over-population is essentially a quantitative concept. When the population
size of the country exceeds the ideal size, we call it over-population. According to T.R.
Malthus, the father of demography, when the population of a country exceeds the means of
substance available, the country faces the problem of over-population.
26. No doubt, food production has increased substantially but problems like poverty, hunger,
malnutrition are still acute.
Agriculture is overcrowded in rural areas of the country which is characterized by
diminishing returns.
This fact leads to the conclusion that India has symptoms of over-population
. Indian low per capita income, low standard of living, wide spread unemployment and
under-employment etc. indicate that our population size has crossed the optimum limit.
27. As per Second Advance Estimates for 2019-20, total foodgrain production in the
country is estimated at record 291.95 million tonnes which is higher by 6.74 million
tonnes than the production of foodgrain of 285.21 million tonnes achieved during
2018-19.
However, the production during 2019-20 is higher by 26.20 million tonnes than the
previous five years’ (2013-14 to 2017-18) average production of foodgrain.
28. Total production of rice during 2019-20 is estimated at record 117.47 million
tonnes. It is higher by 9.67 million tonnes than the five years’ average production of
107.80 million tonnes.
Production of wheat during 2019-20 is estimated at record 106.21 million tonnes. It
is higher by 2.61 million tonnes as compared to wheat production during 2018-19
and is higher by 11.60 million tonnes than the average wheat production of 94.61
million tonnes.
29. Production of Nutri / Coarse Cereals estimated at 45.24 million tonnes, which is
higher by 2.18 million tonnes than the production of 43.06 million tonnes achieved
during 2018-19. Further, it is also higher by 2.16 million tonnes than the average
production.
Total Pulses production during 2019-20 is estimated at 23.02 million tonnes which
is higher by 2.76 million tonnes than the Five years’ average production of 20.26
million tonnes.