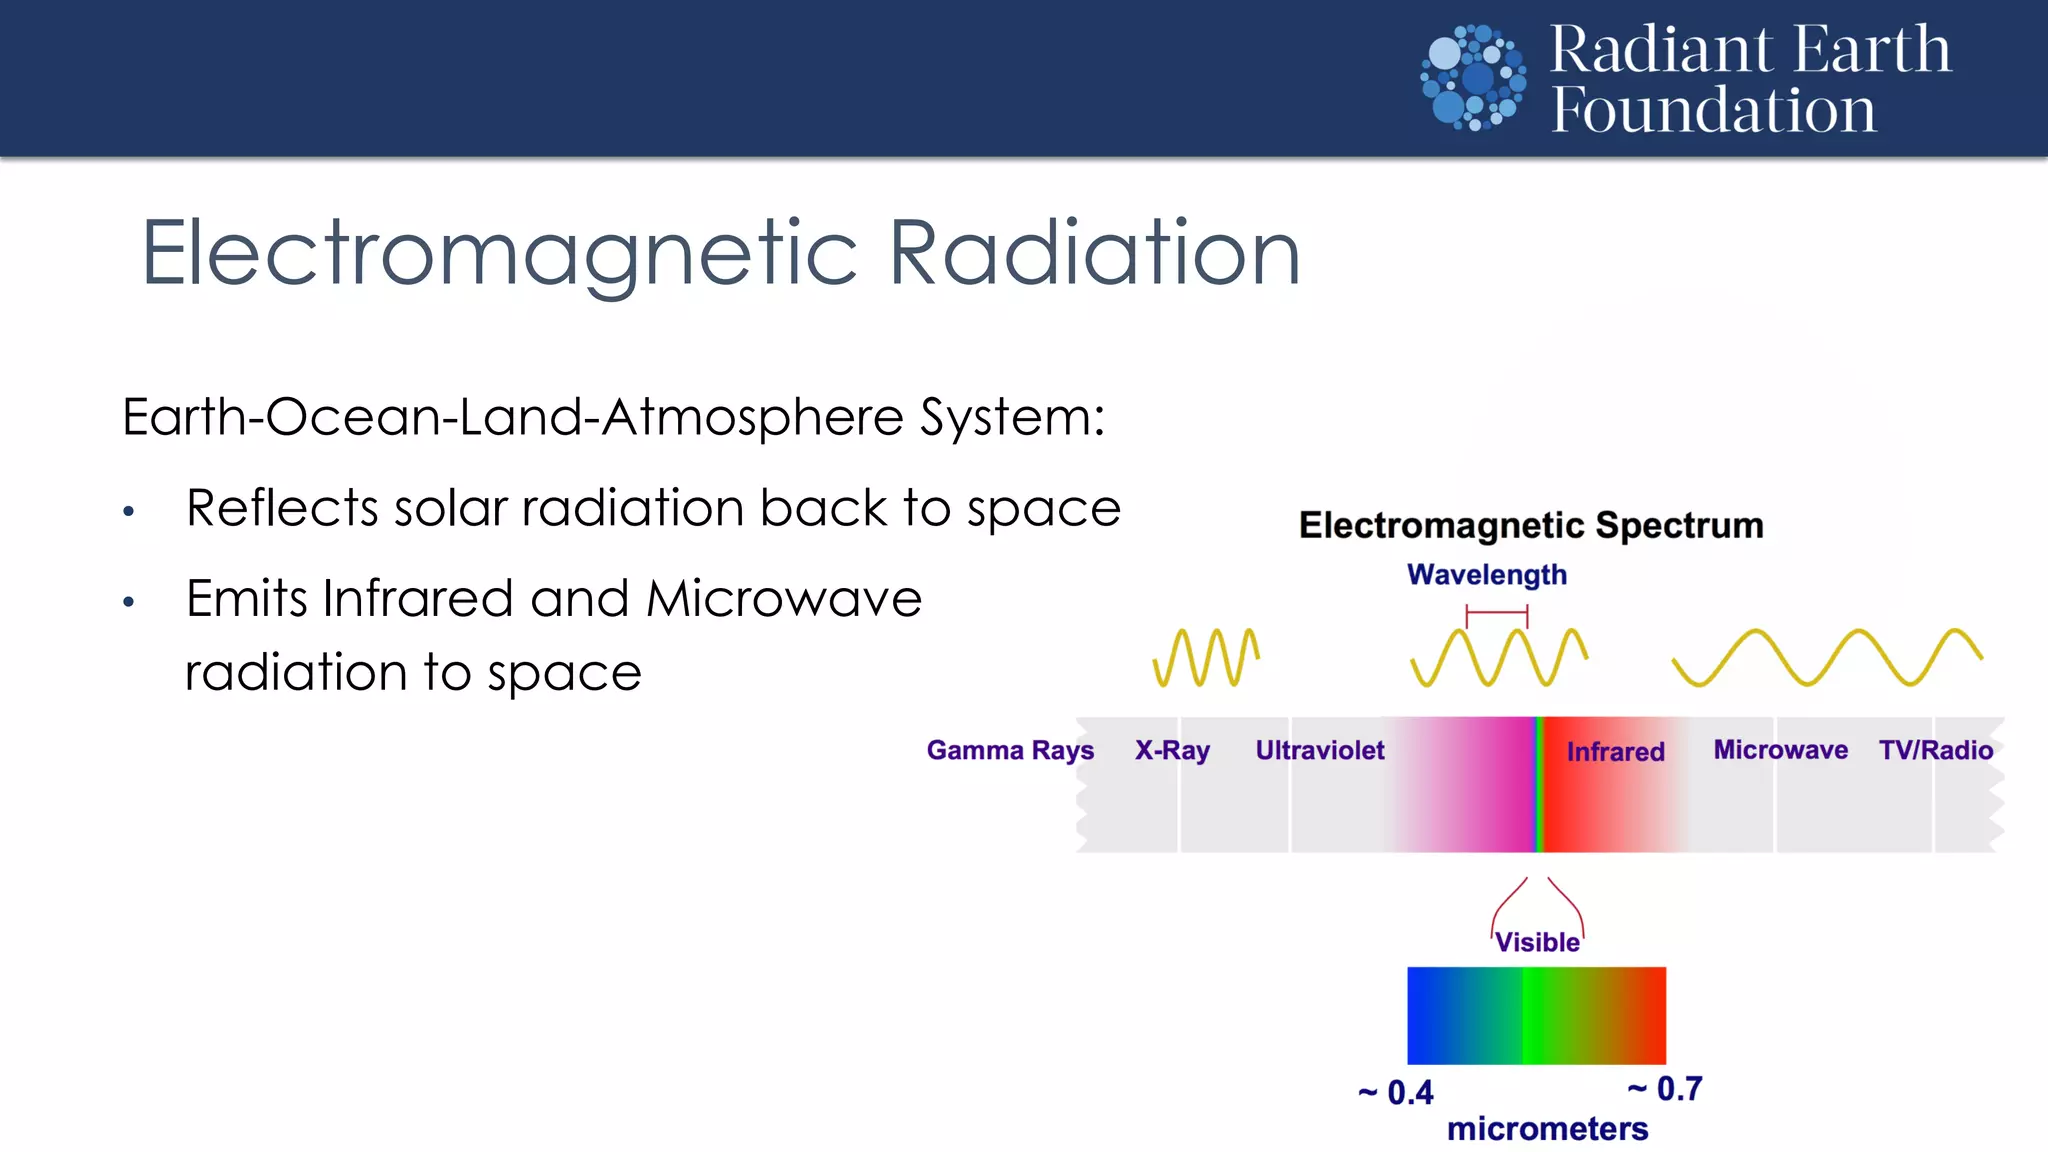
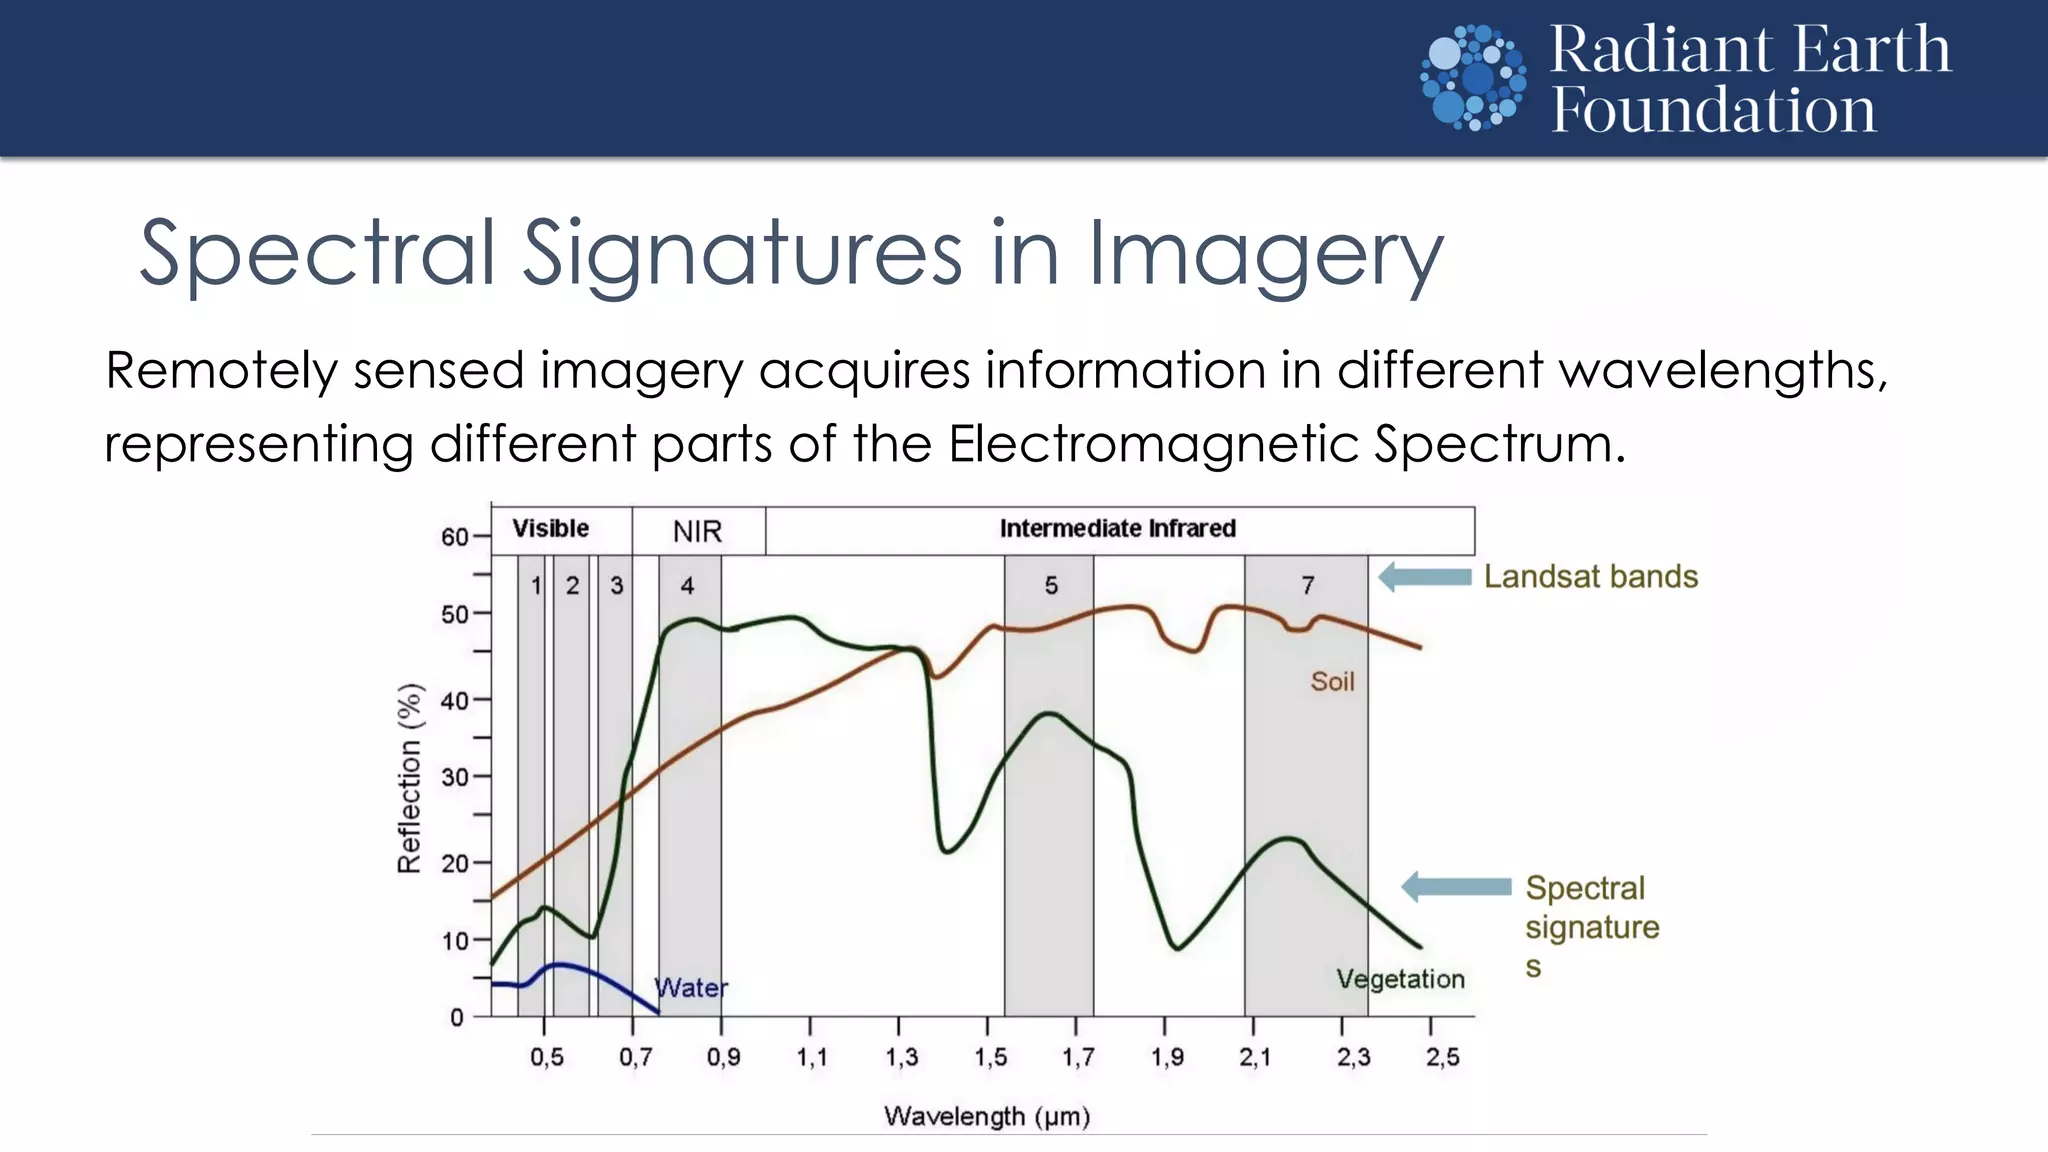
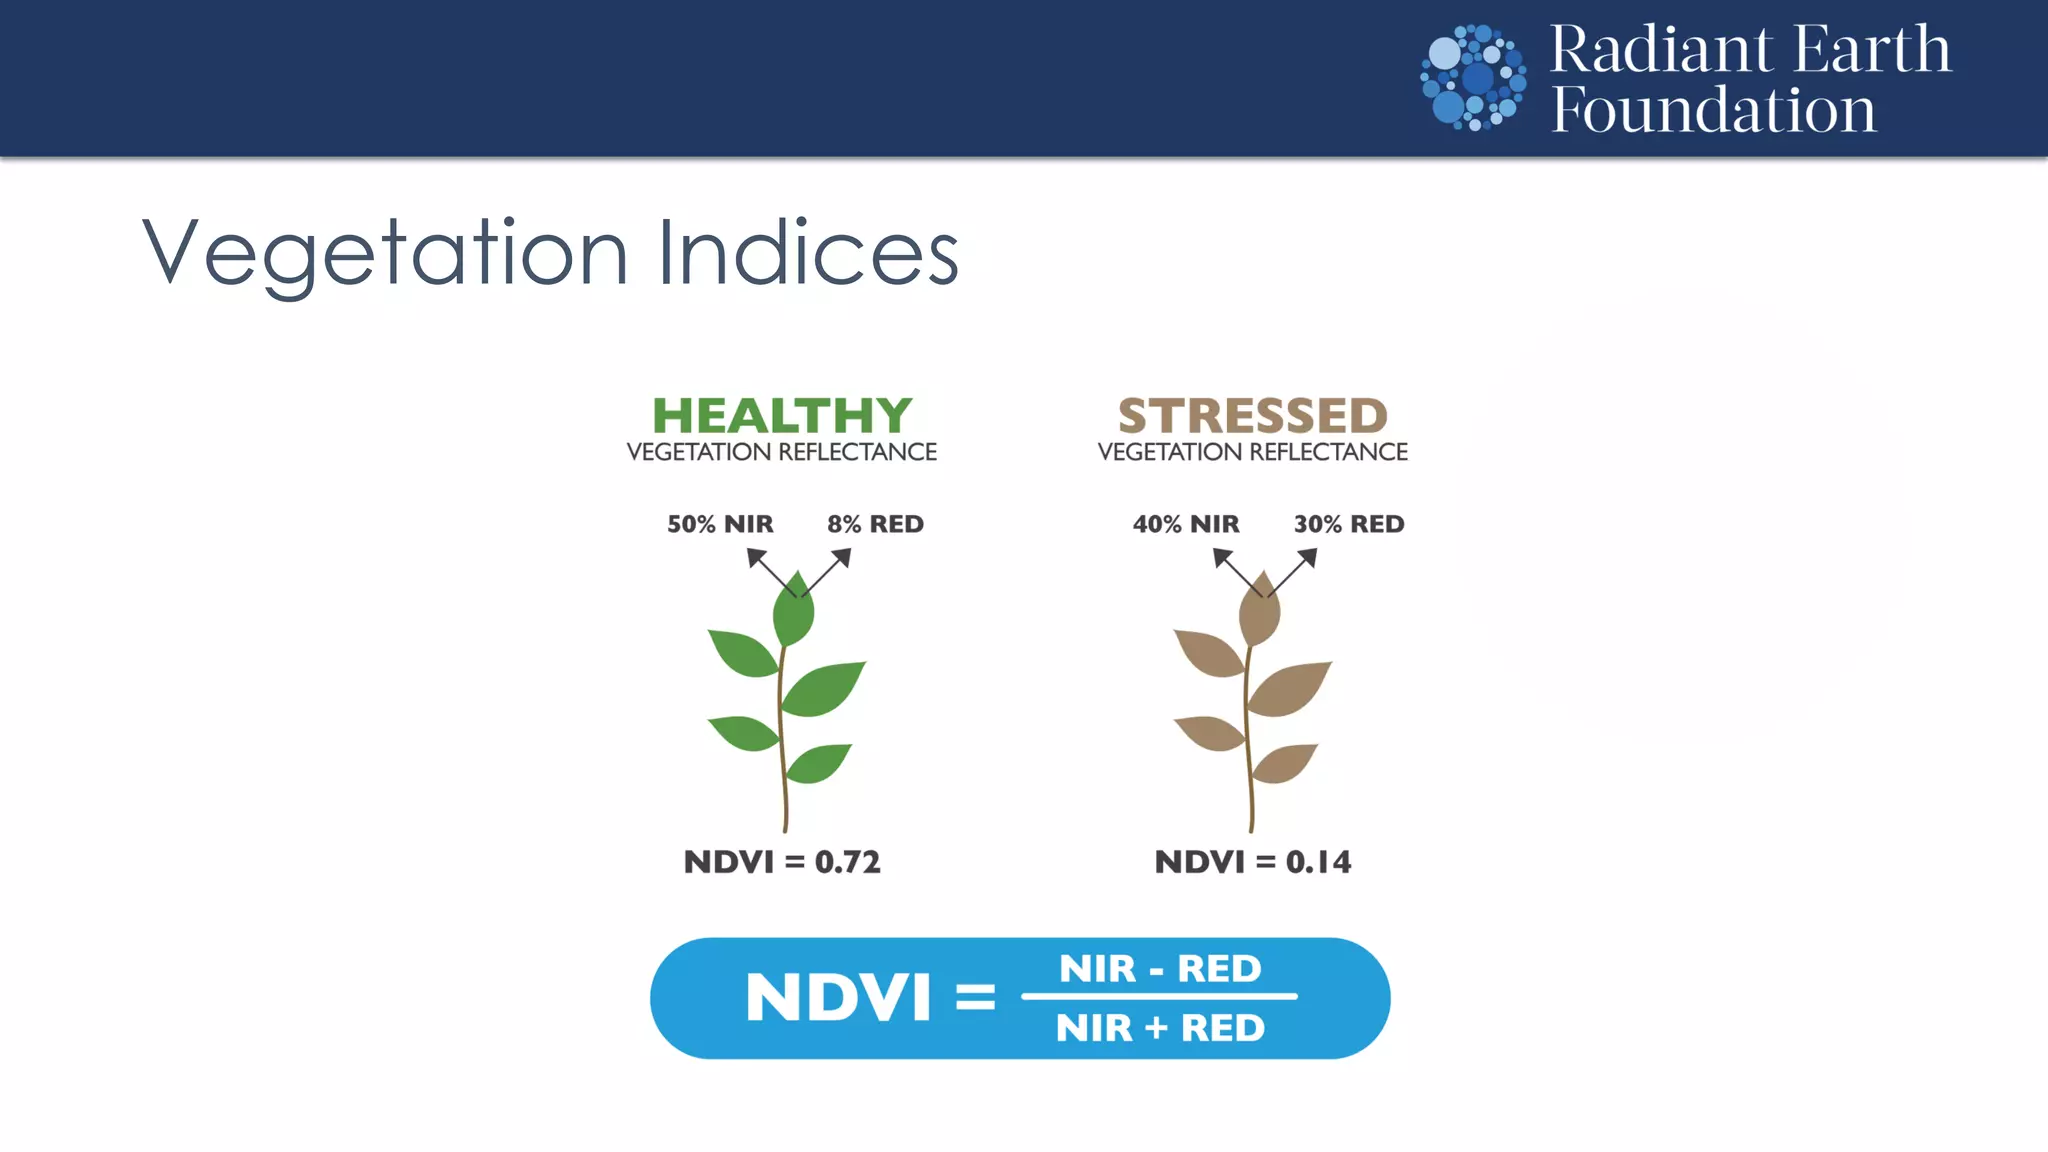
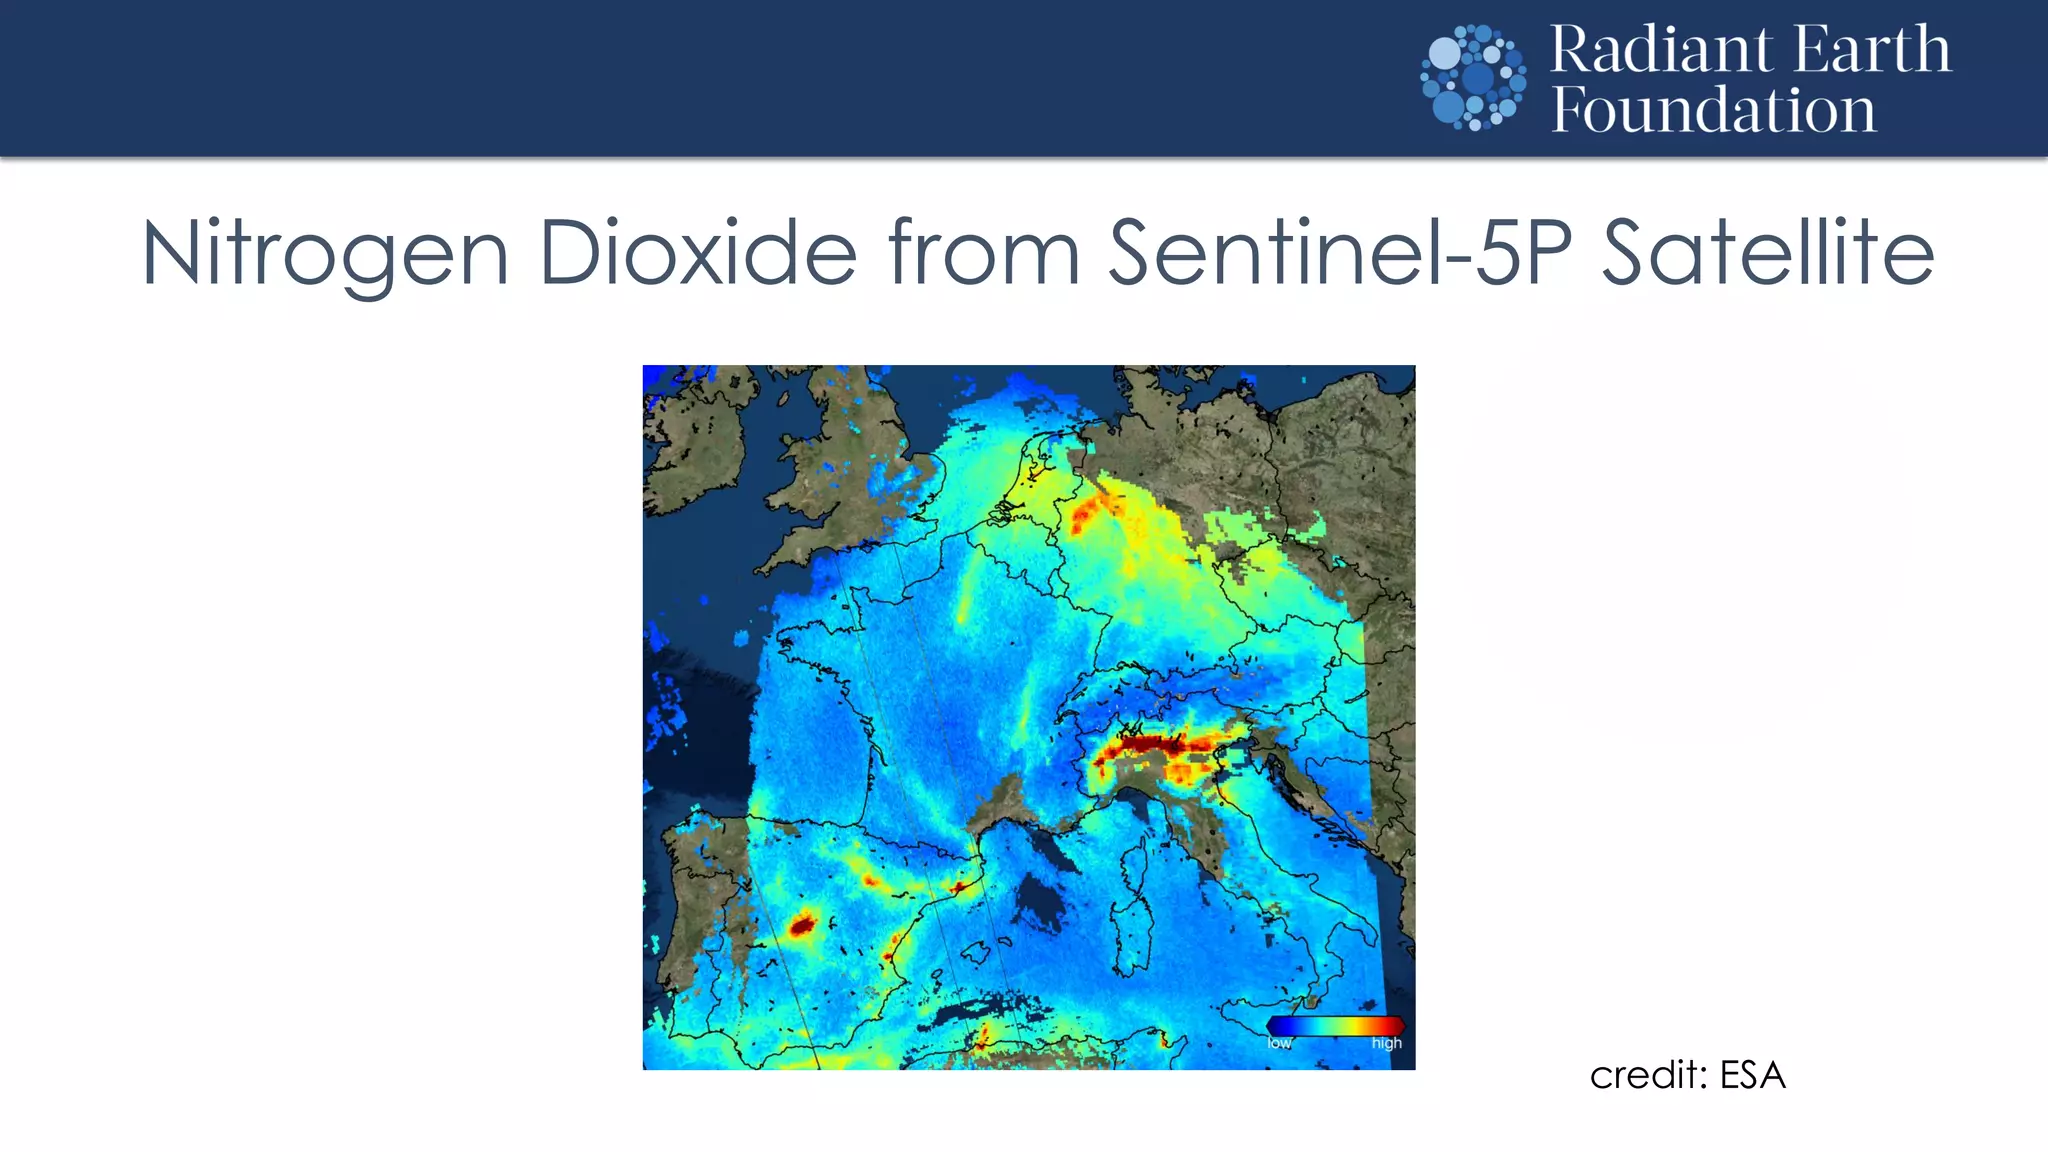
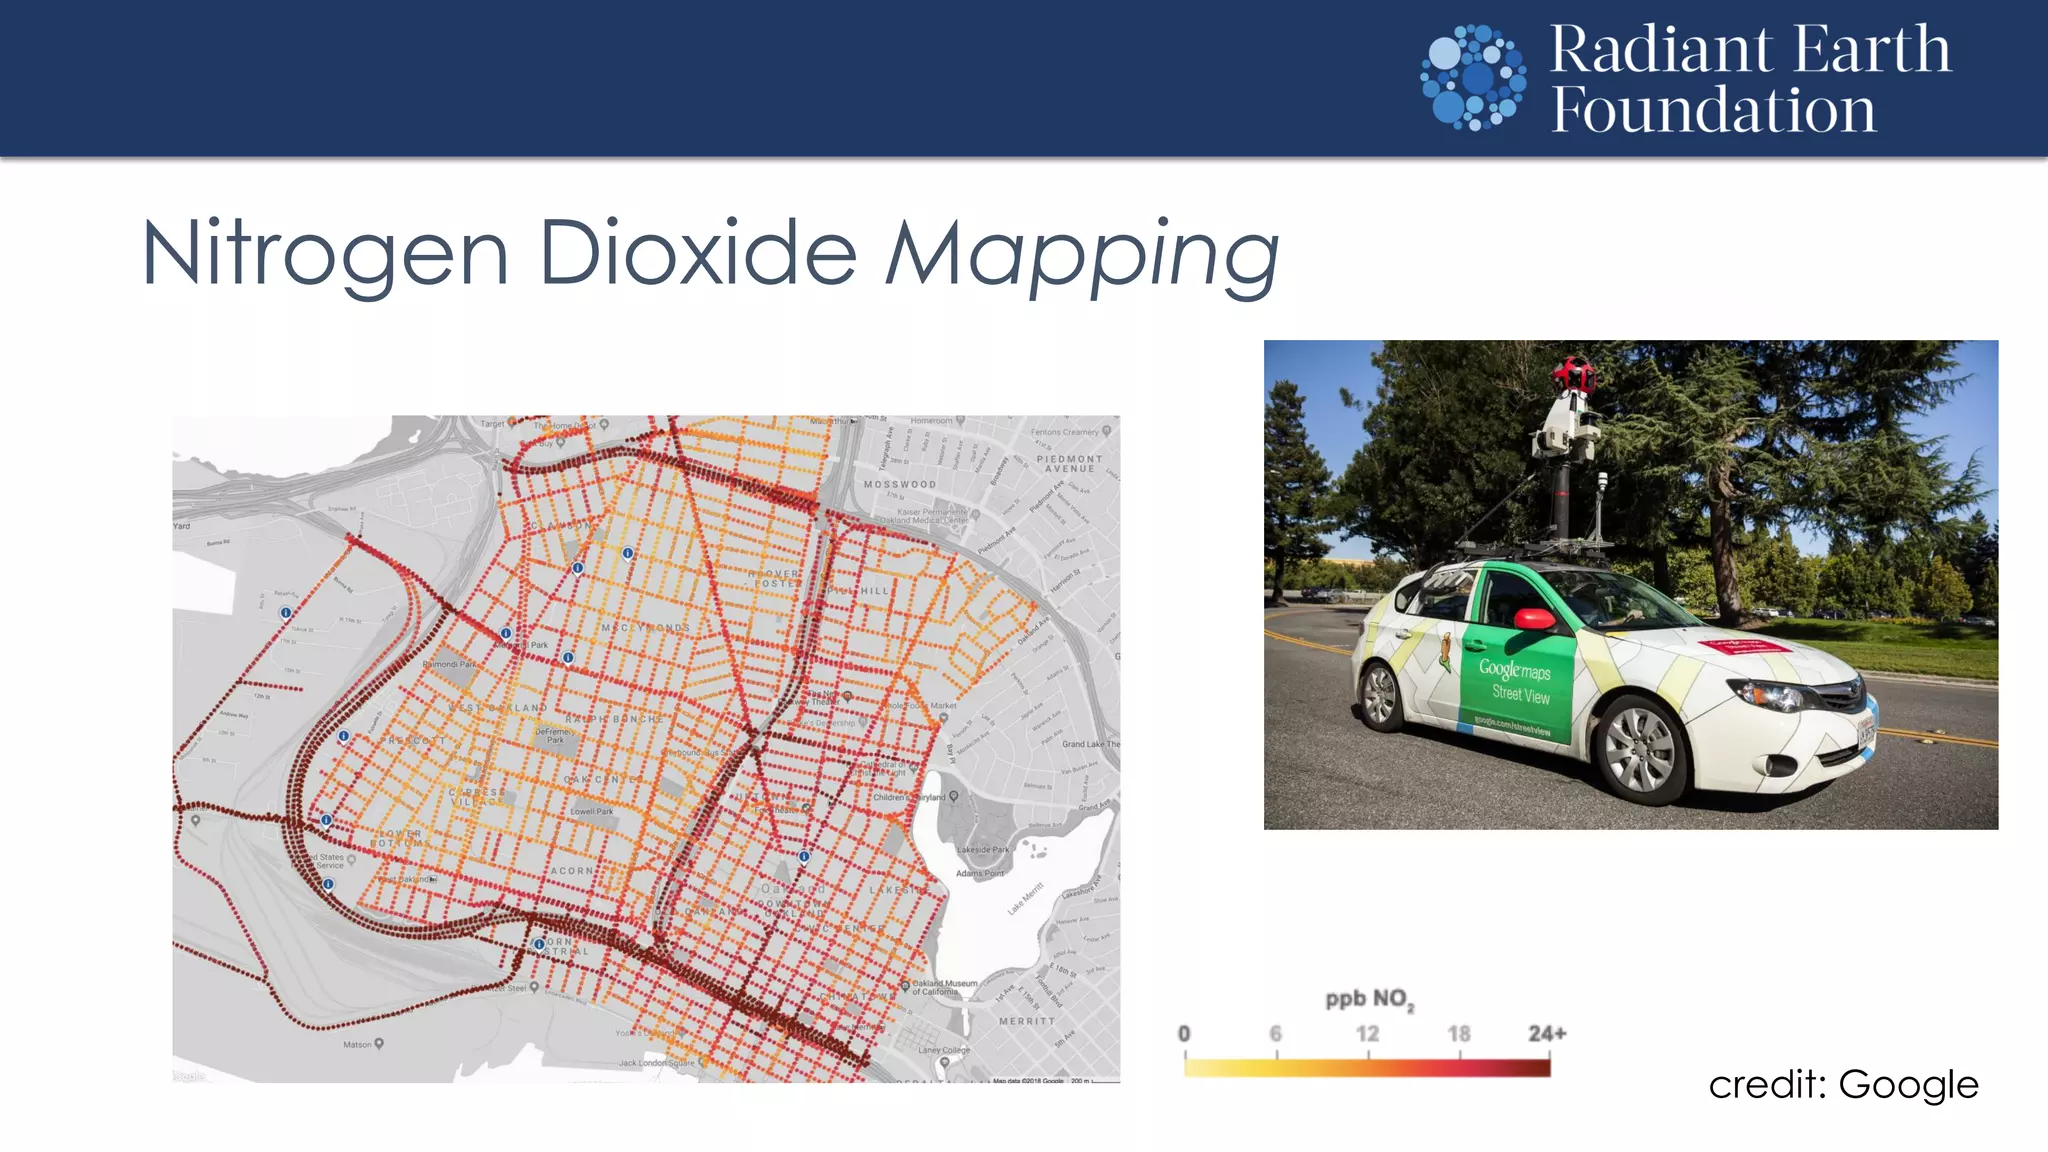
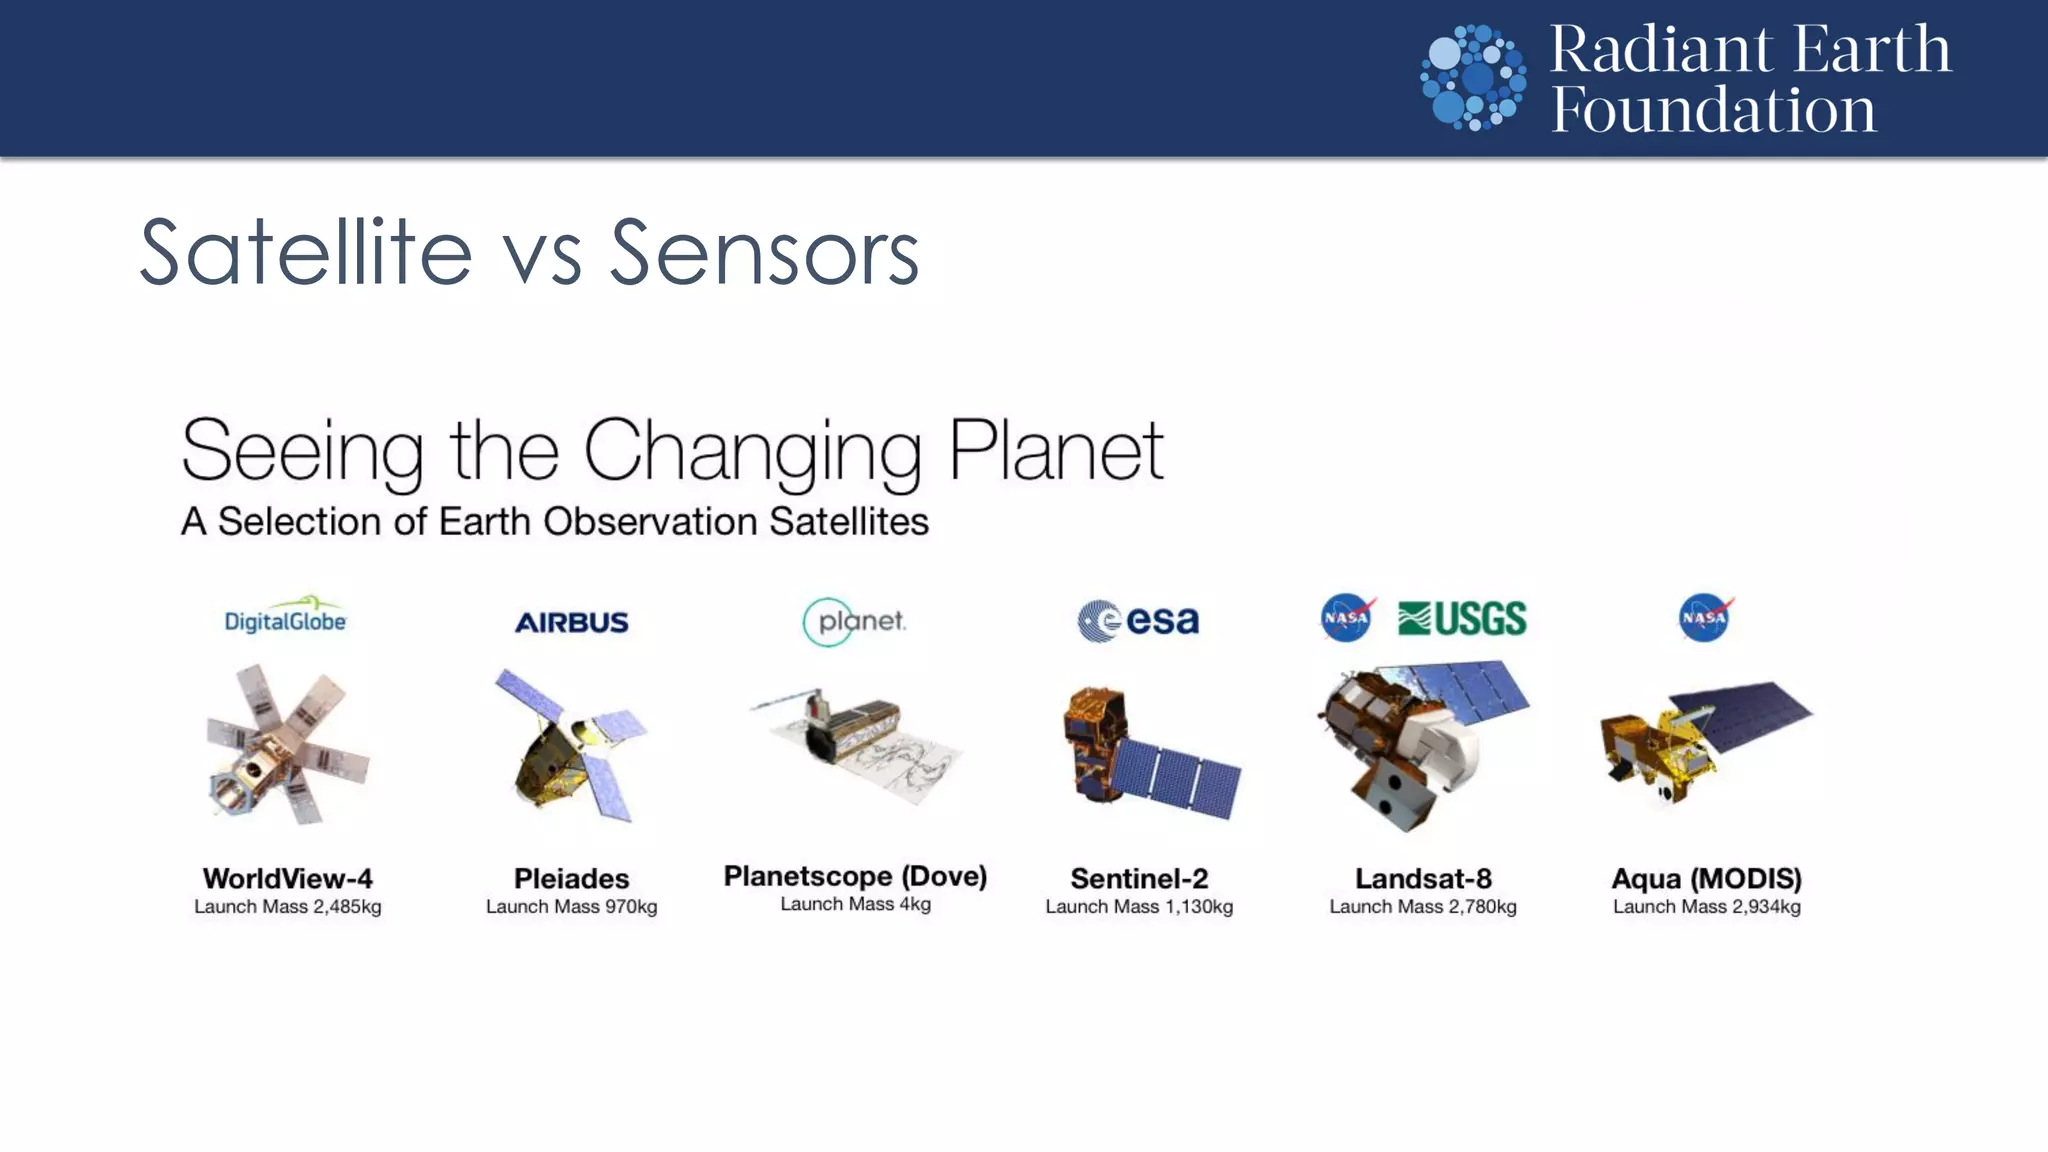
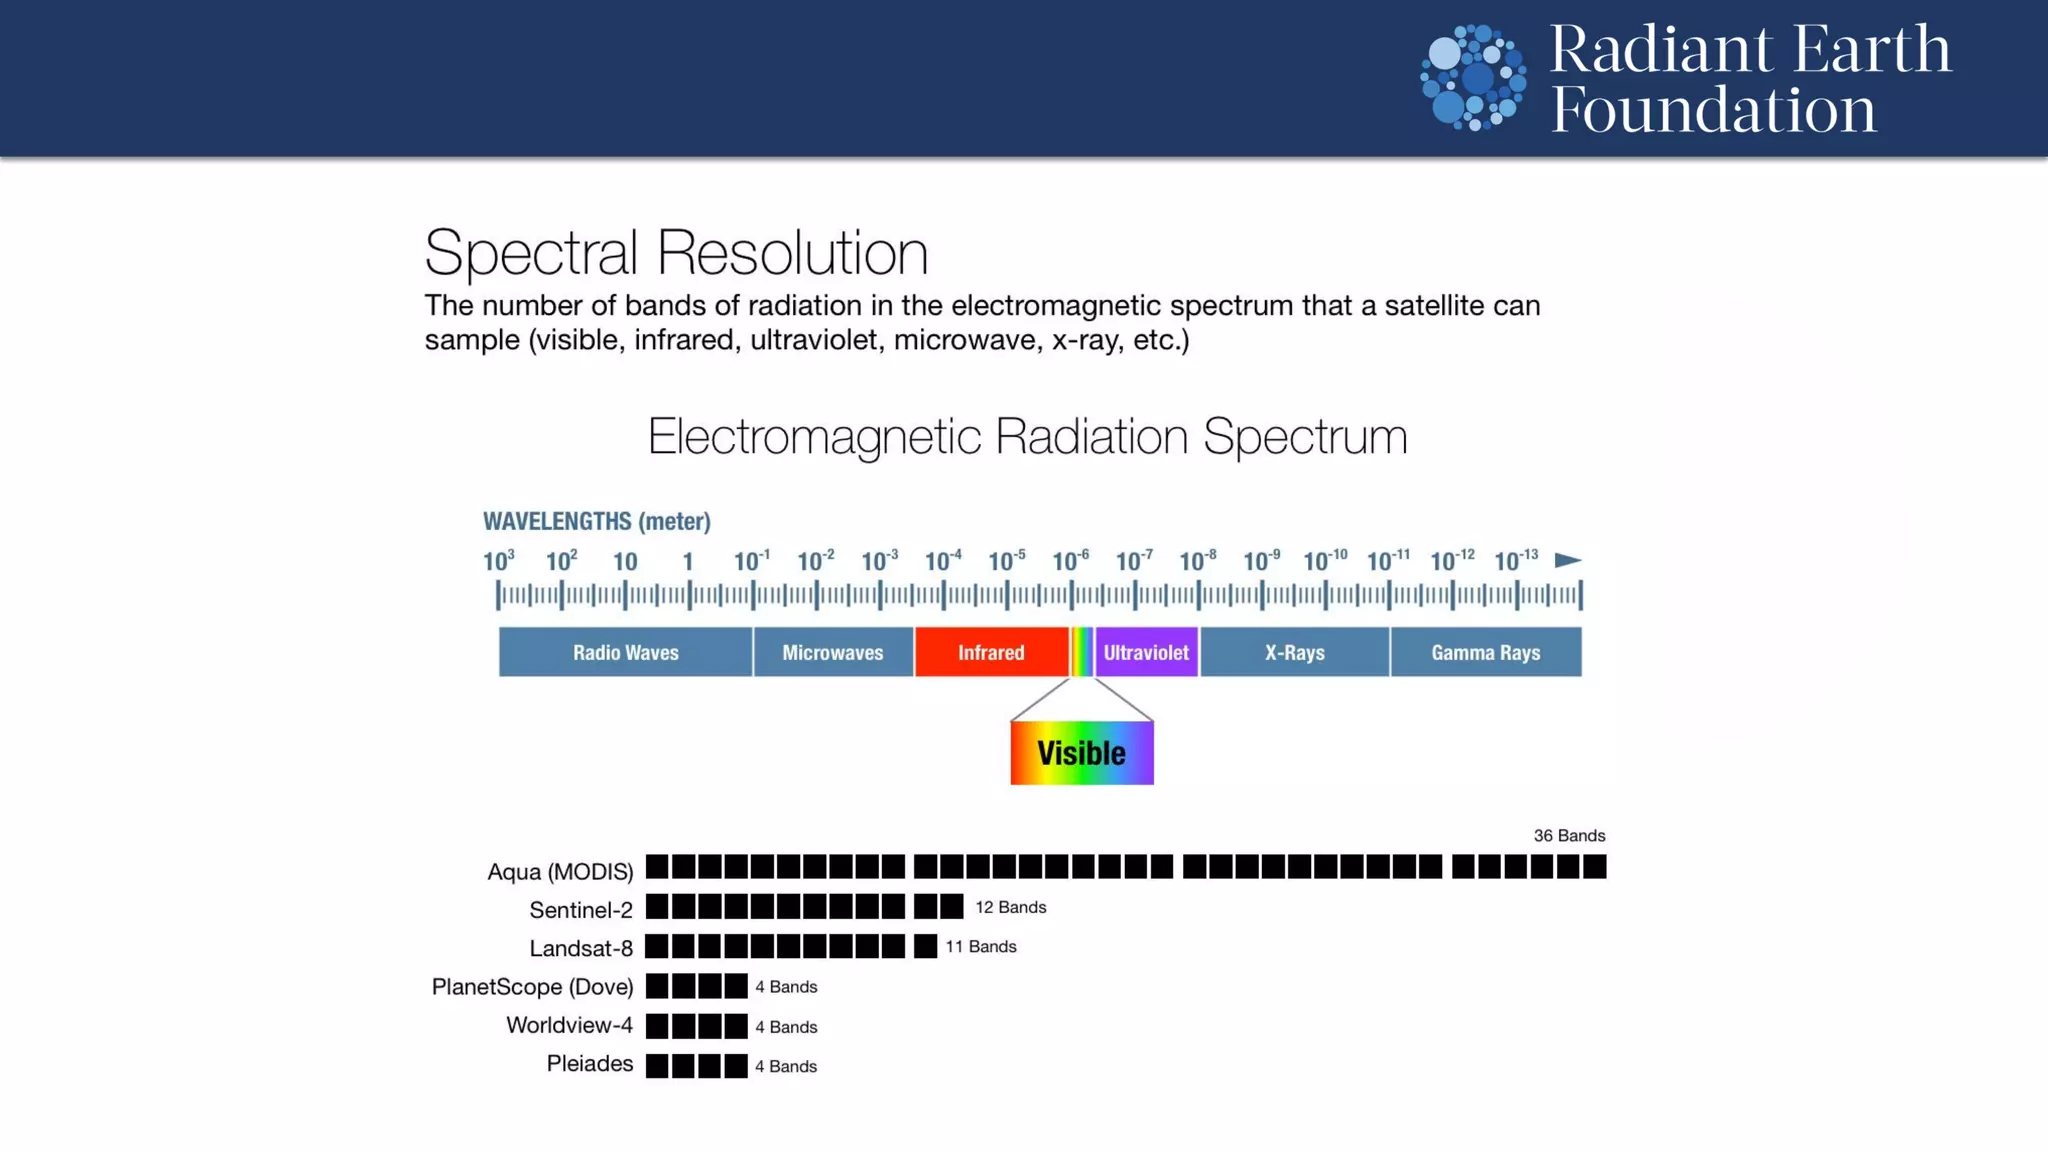
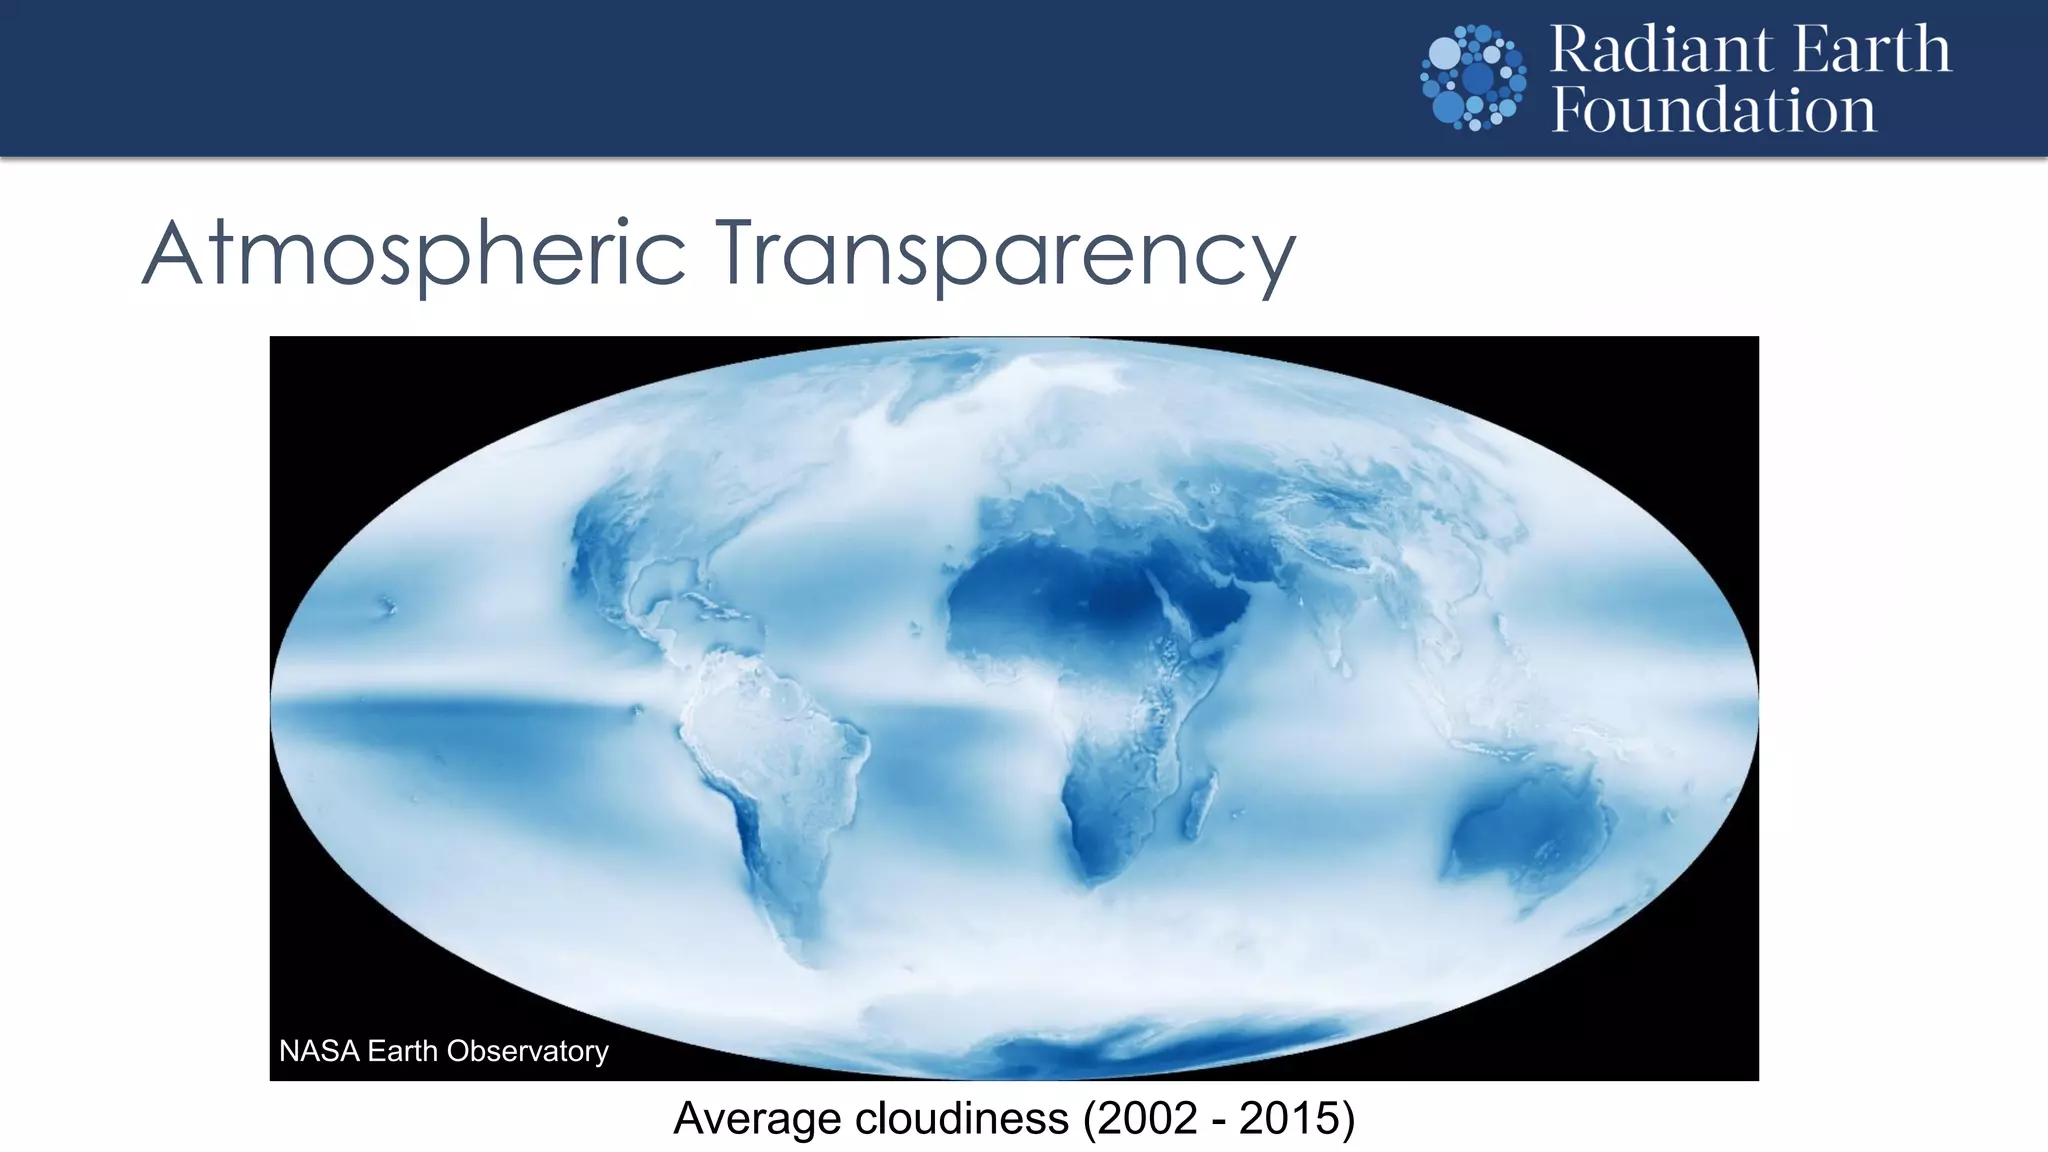
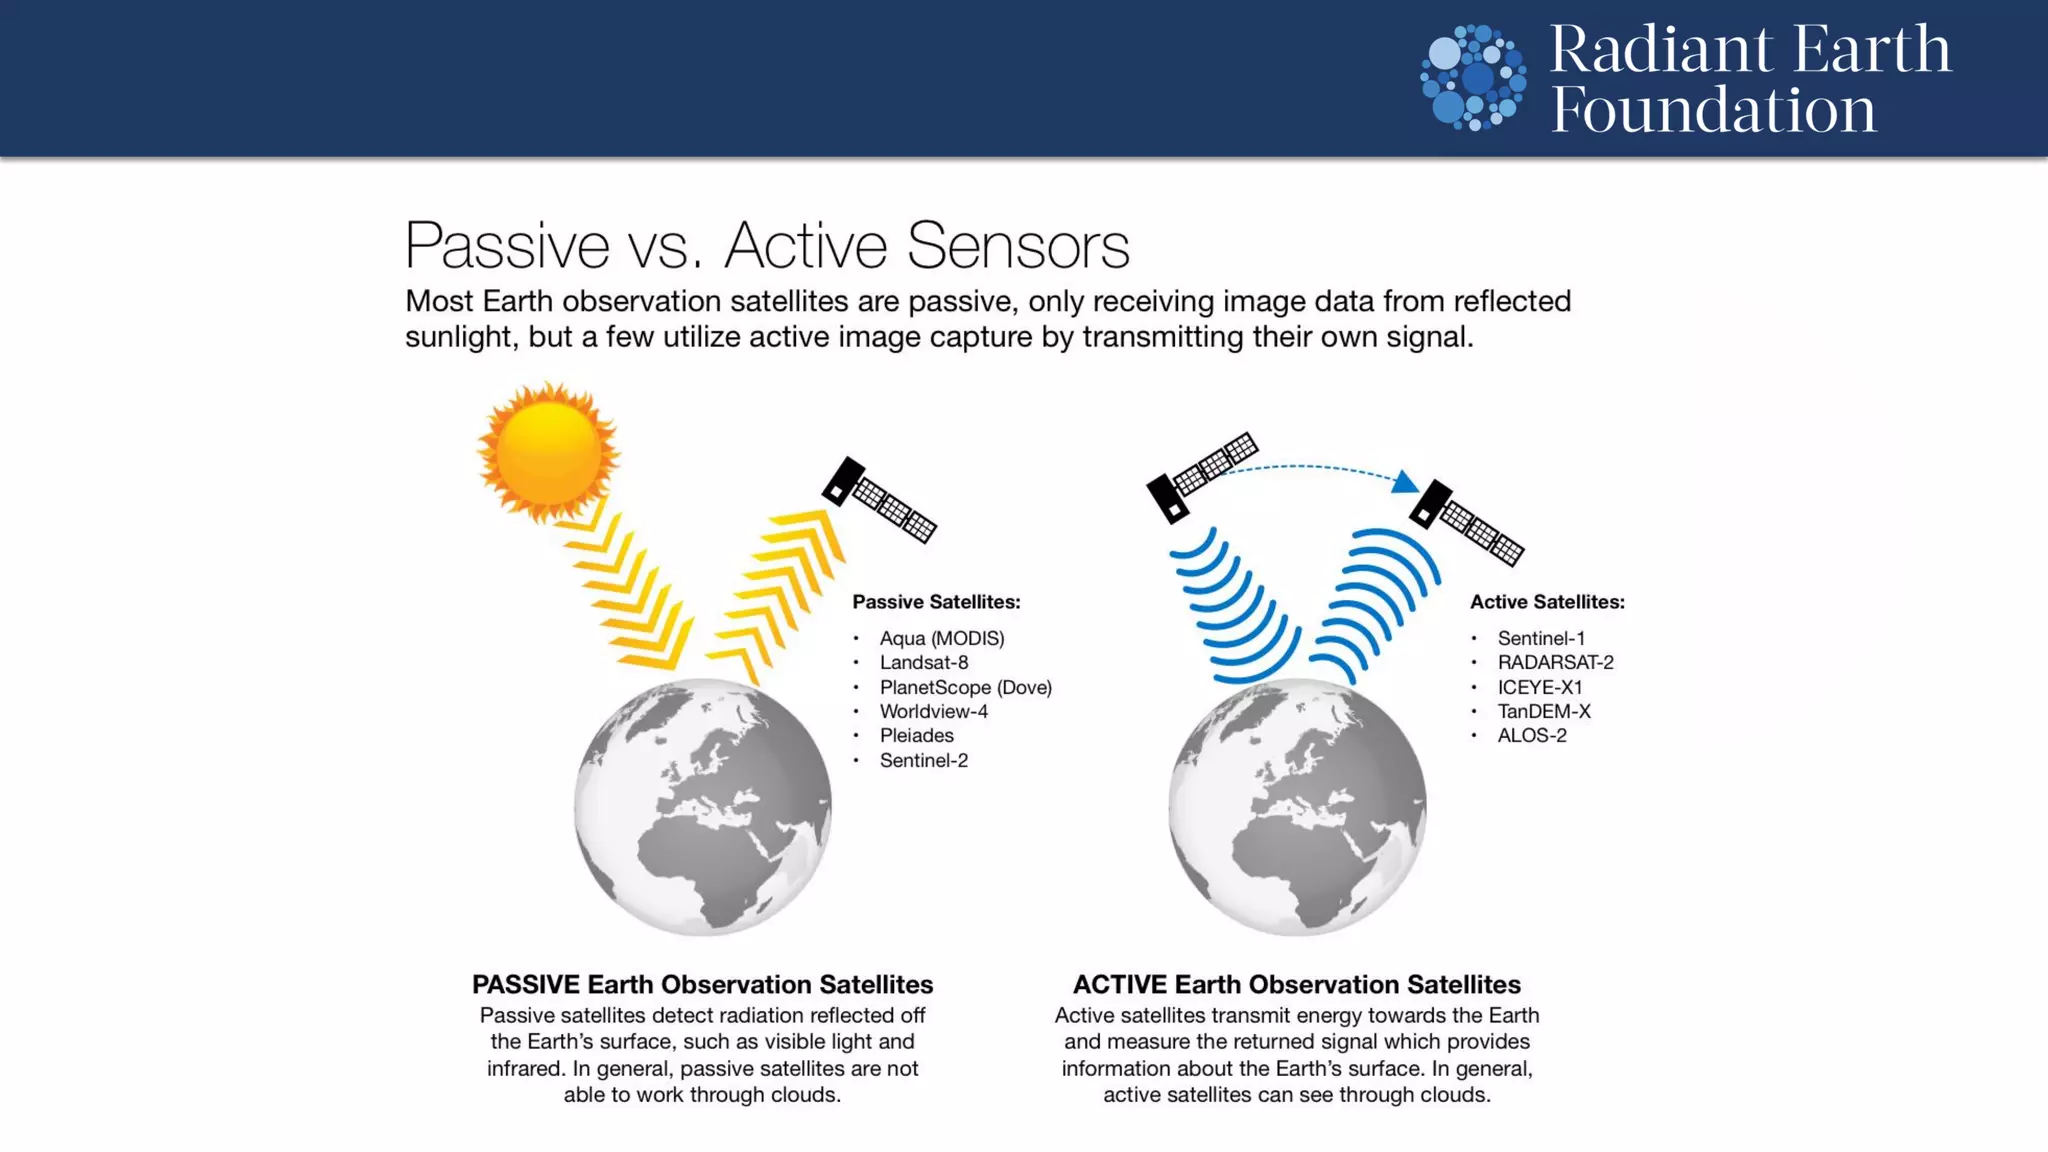
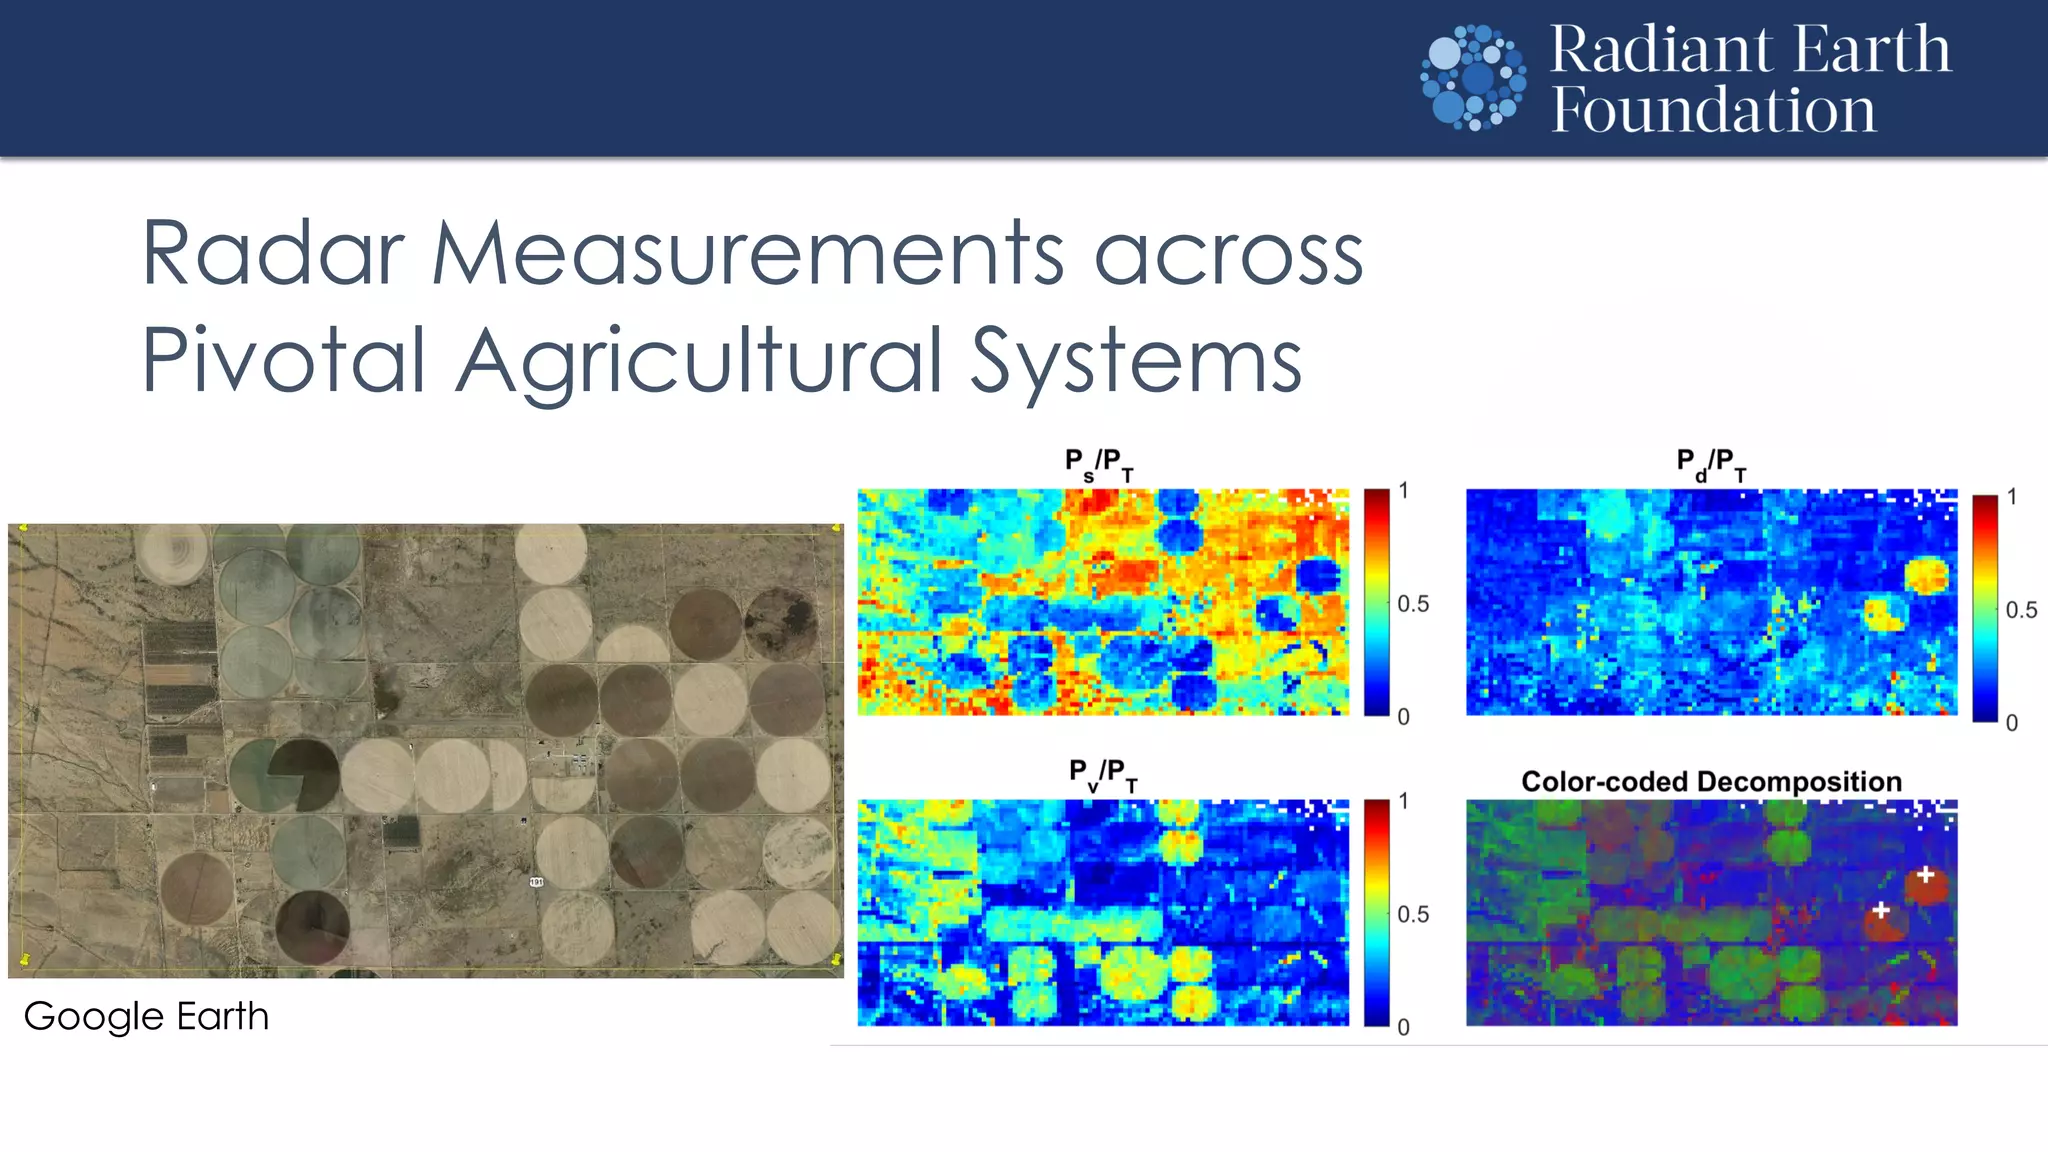
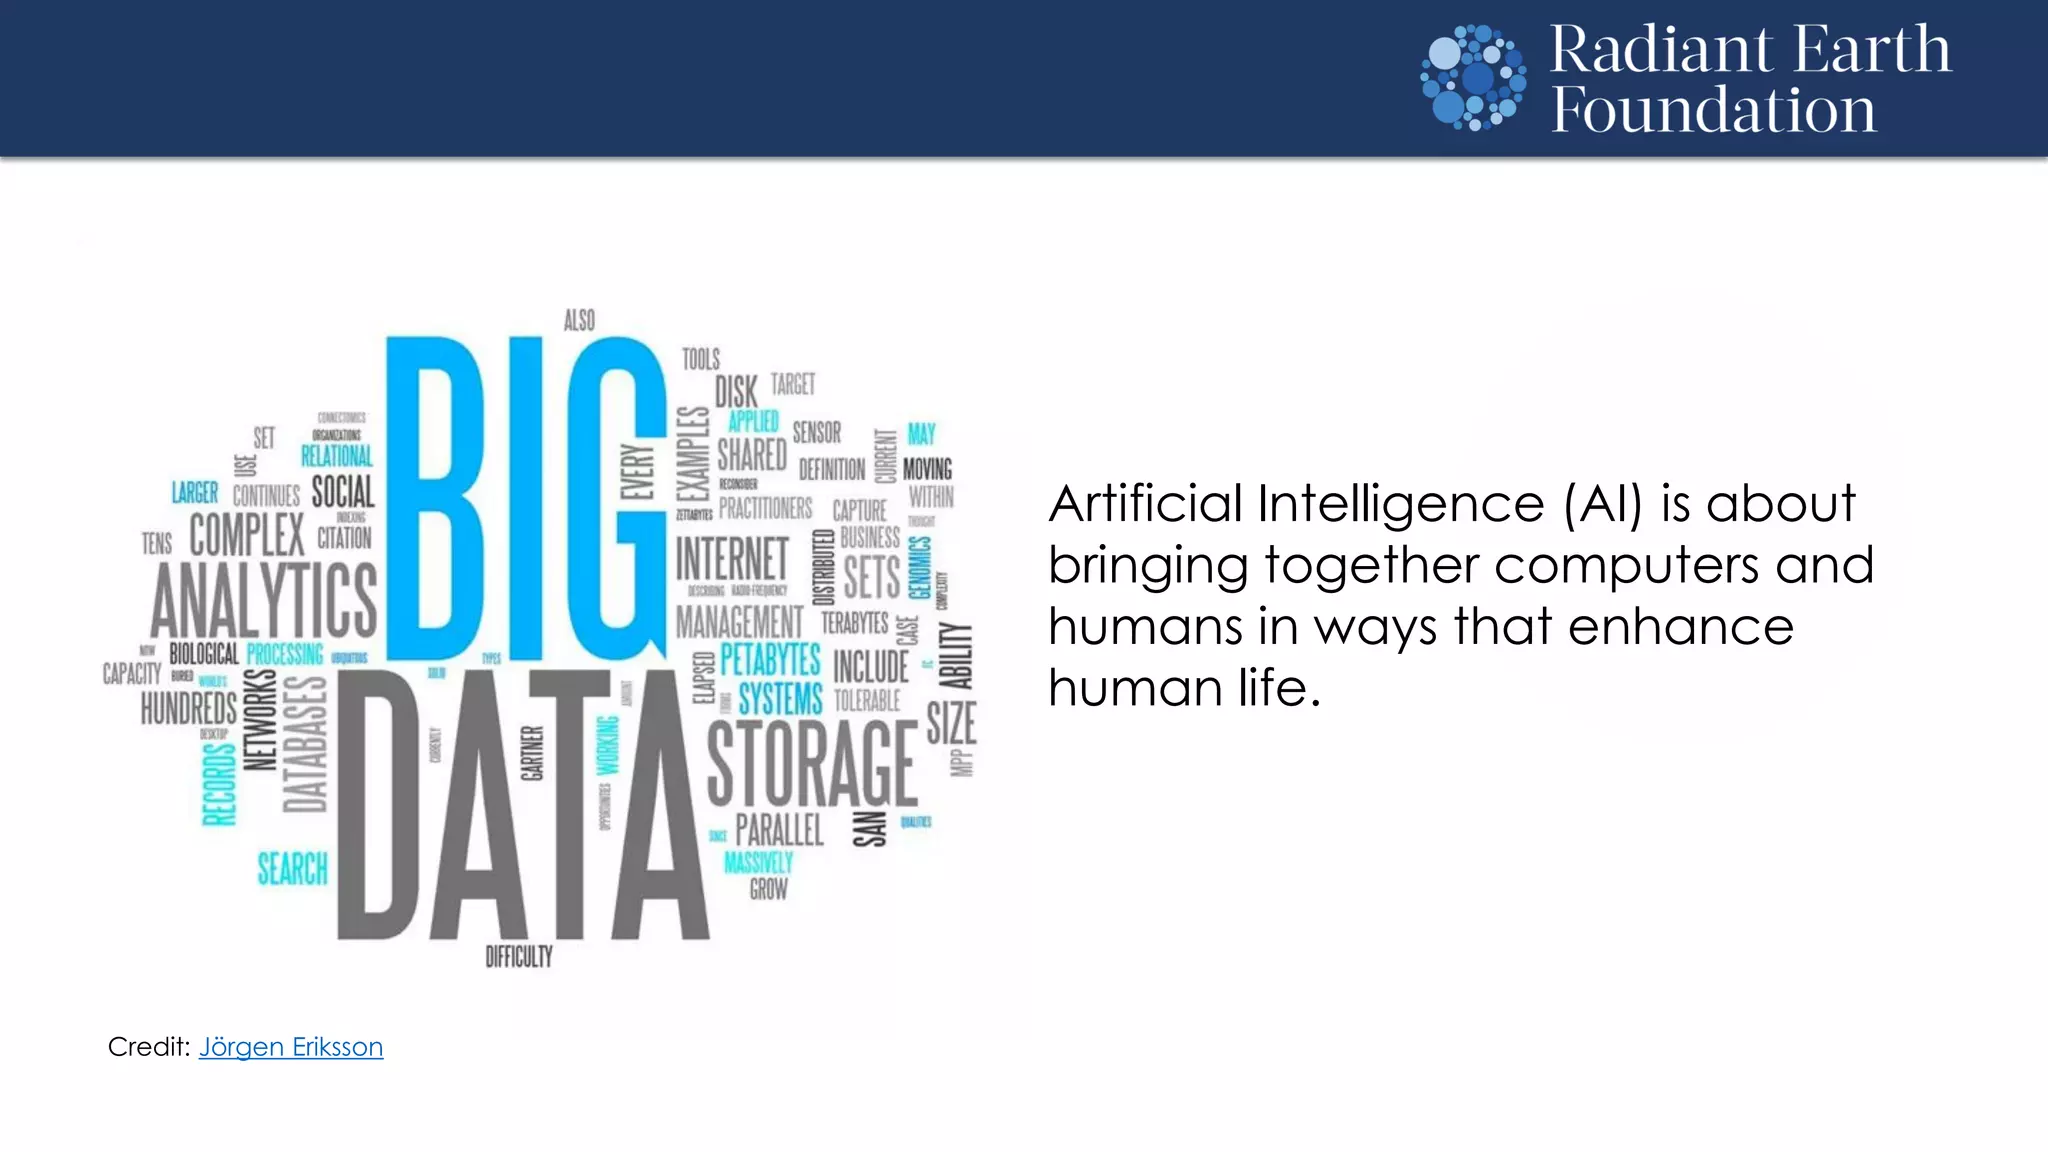
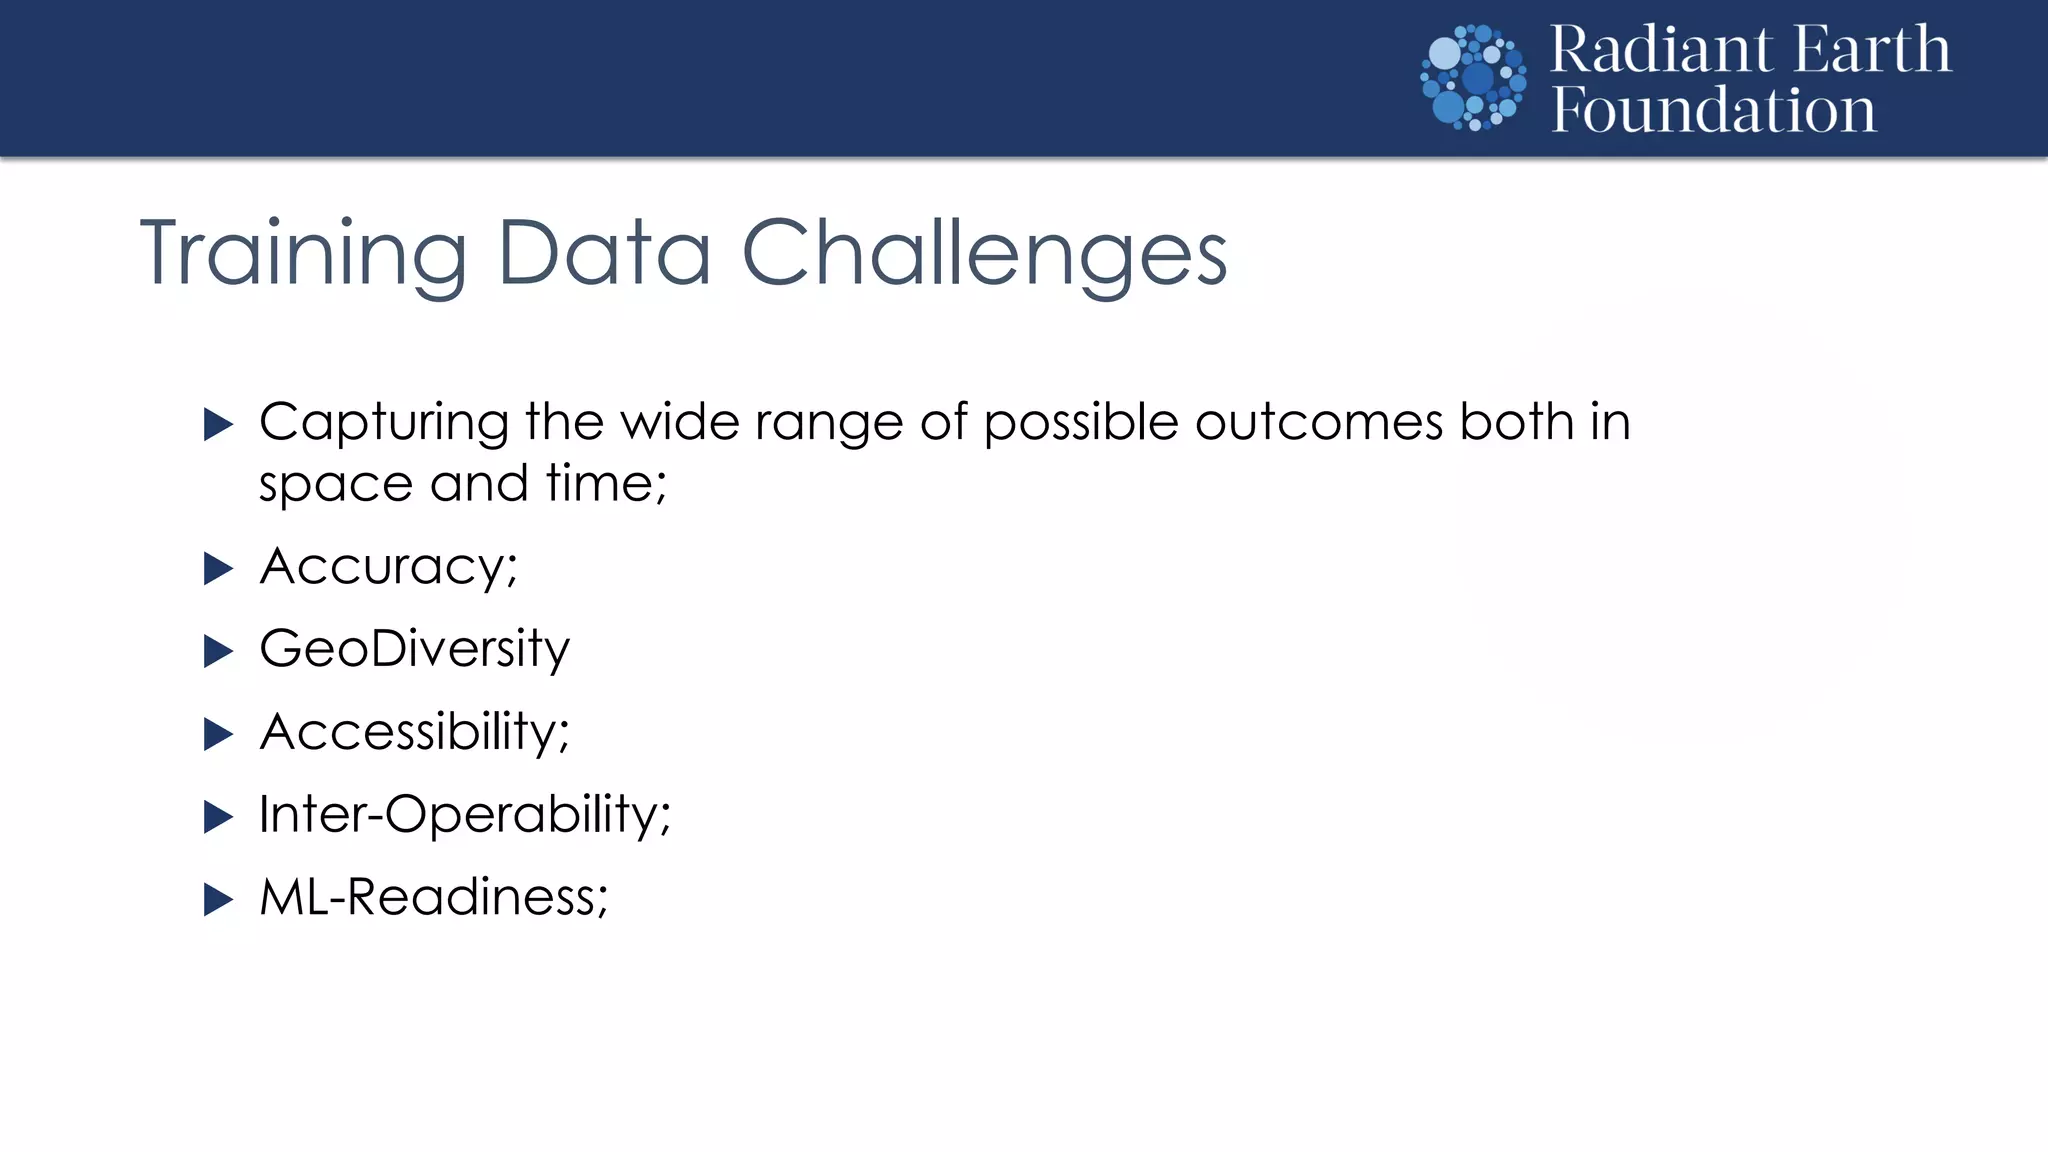
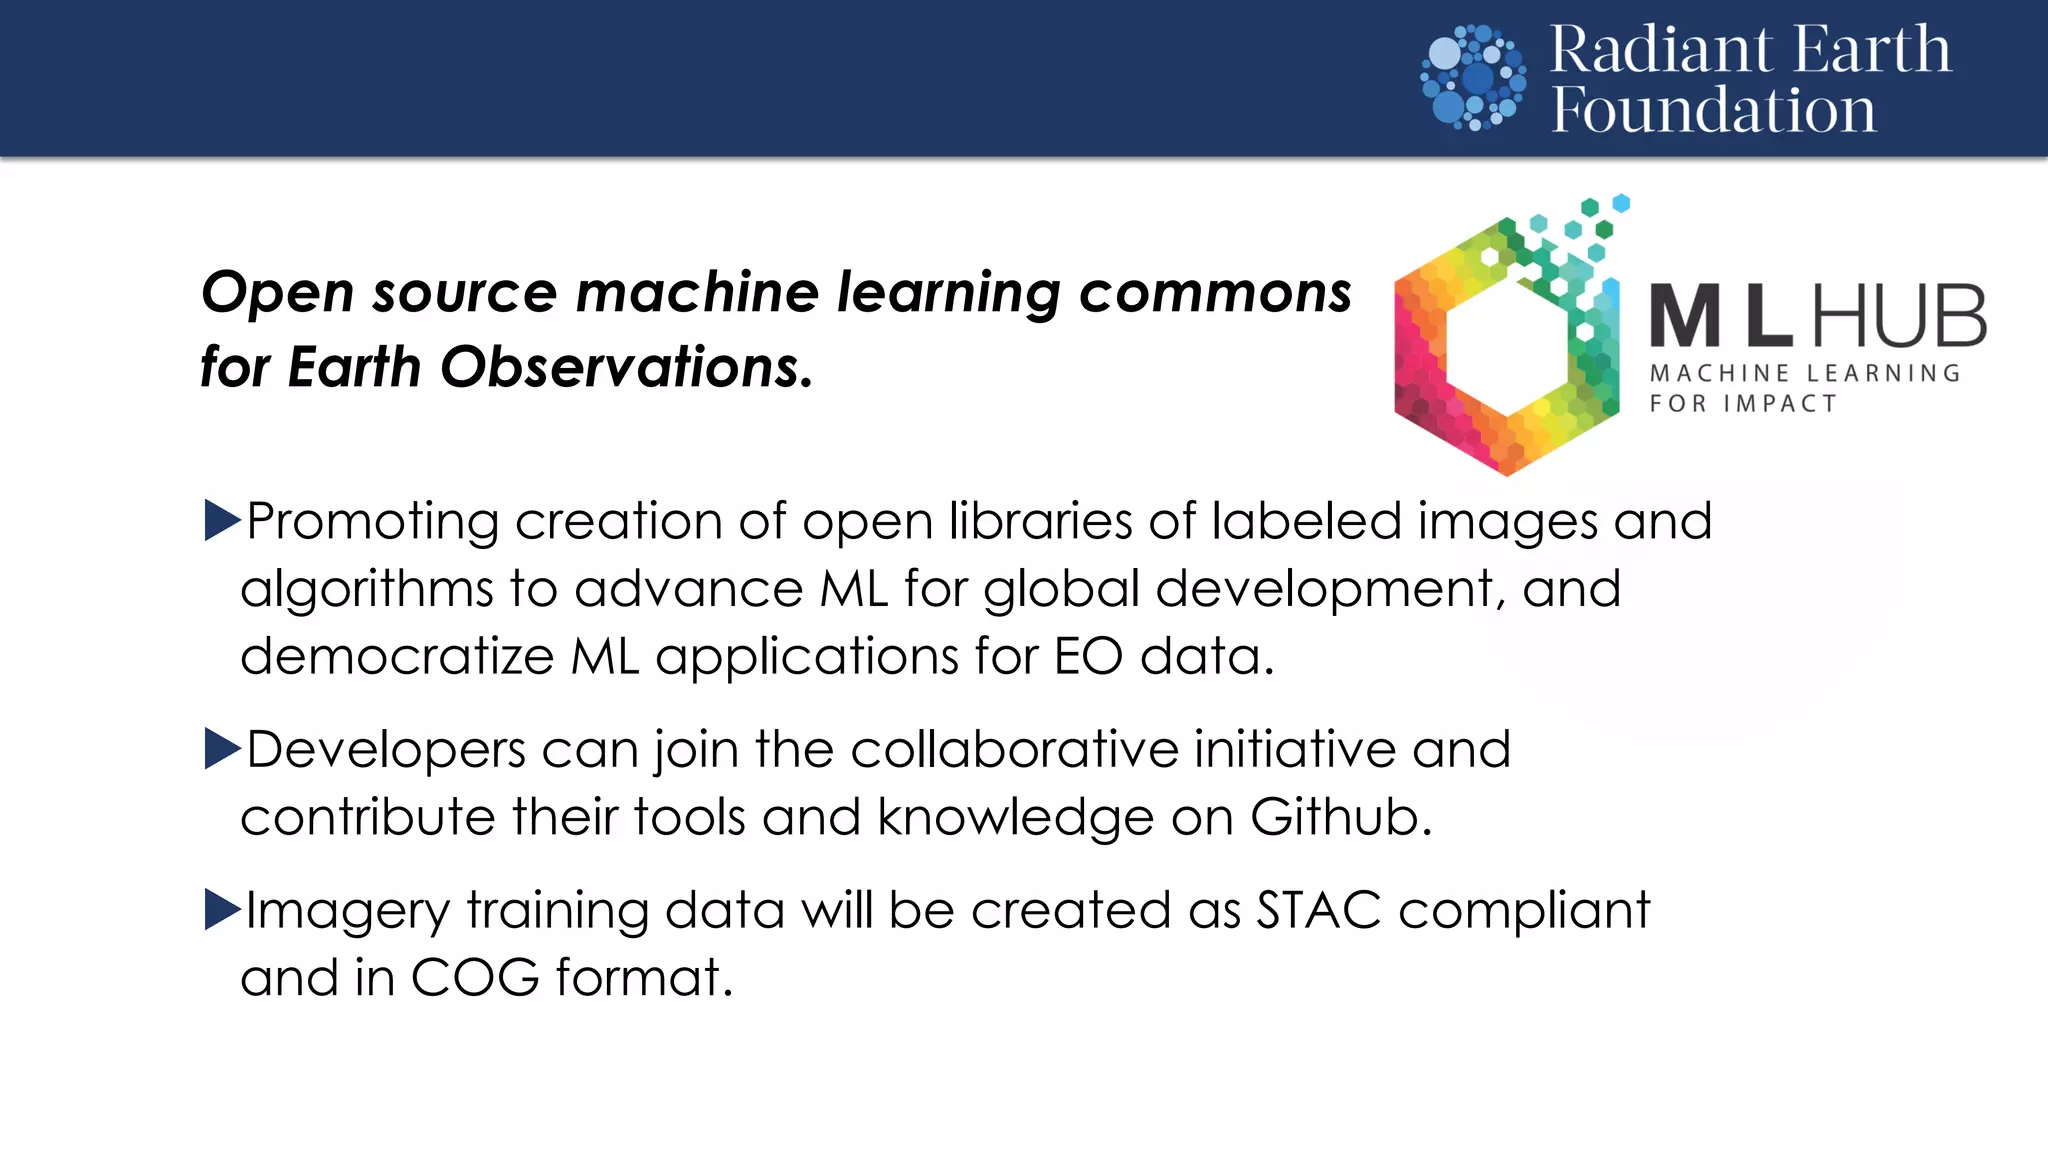
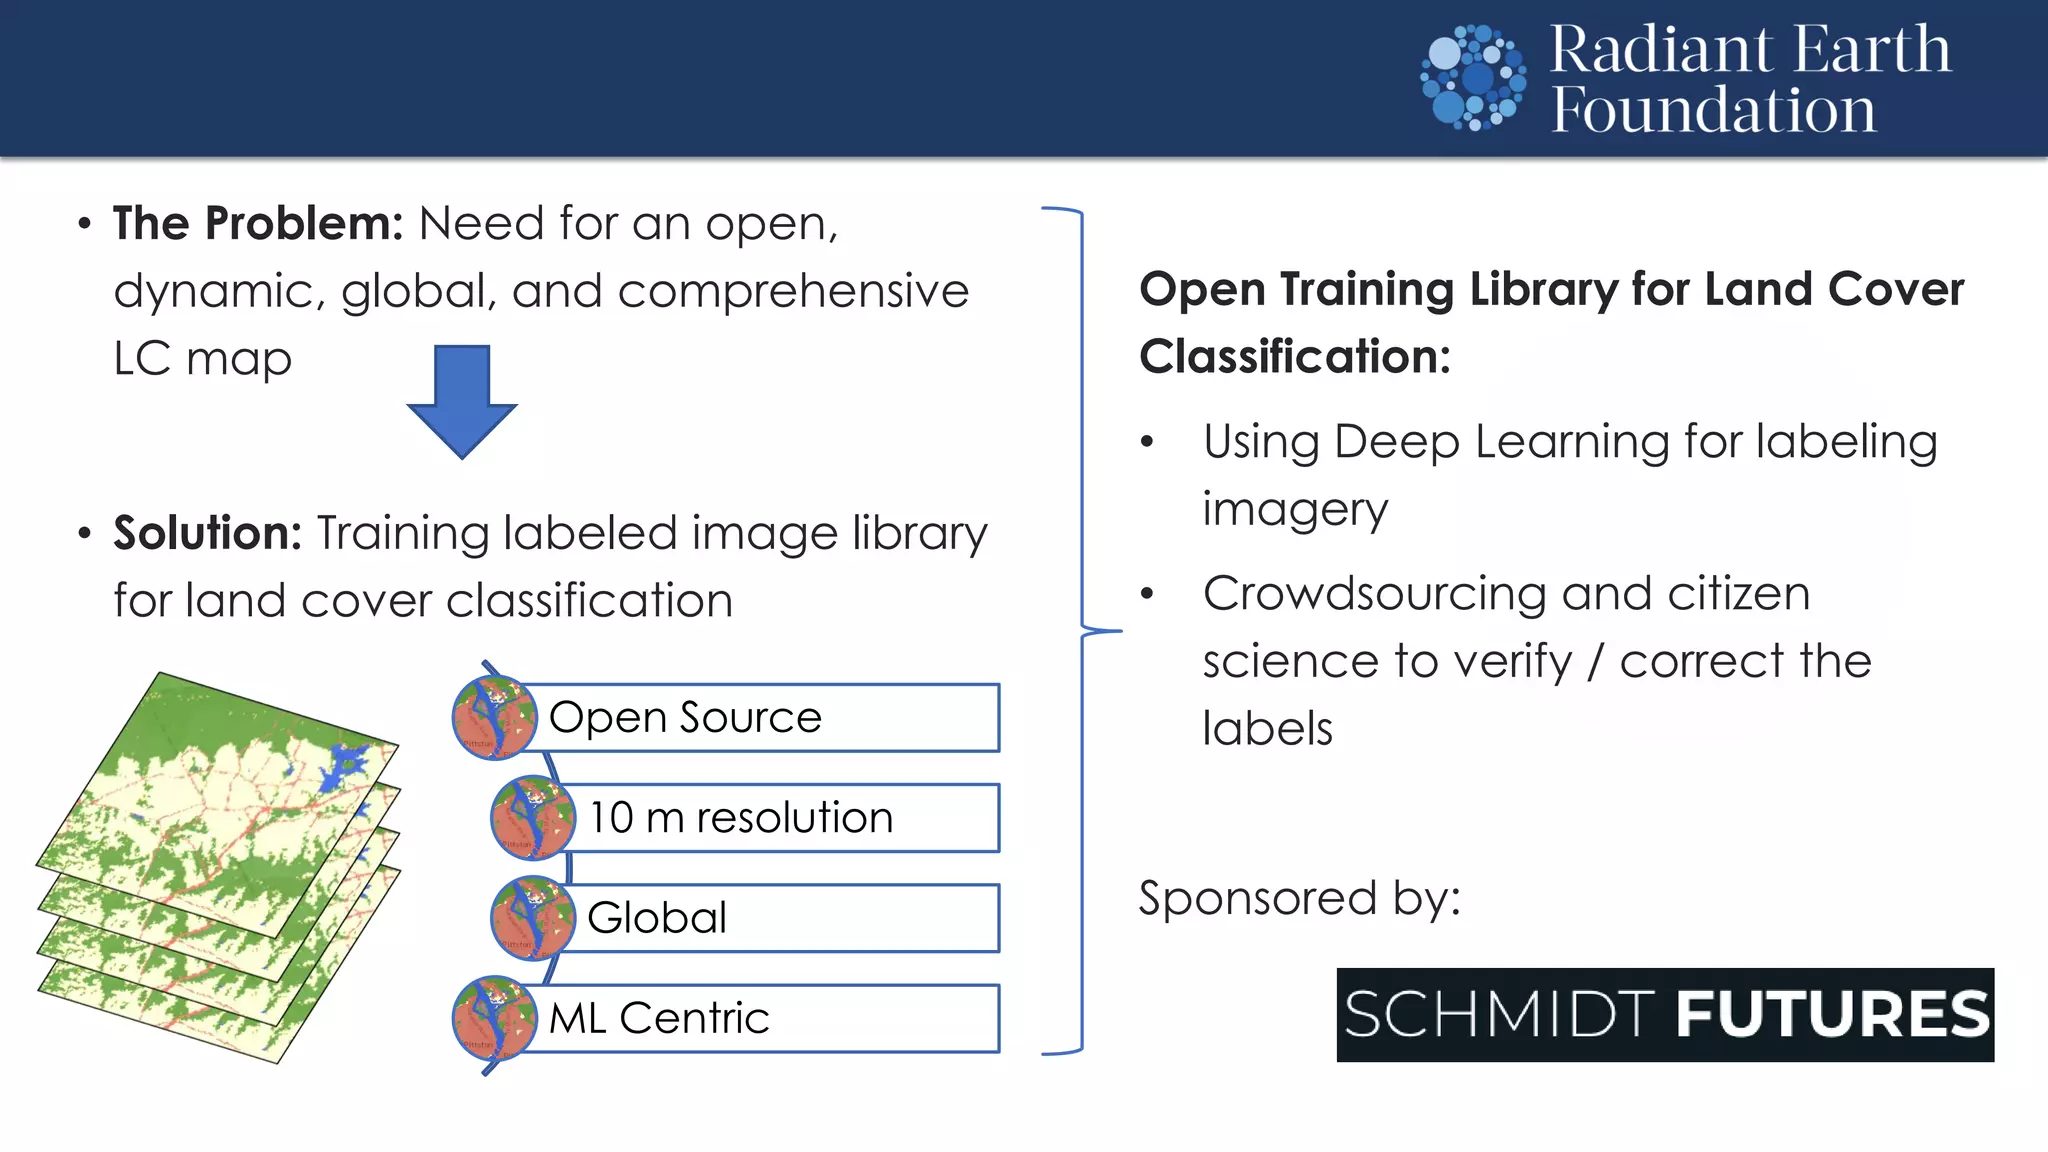
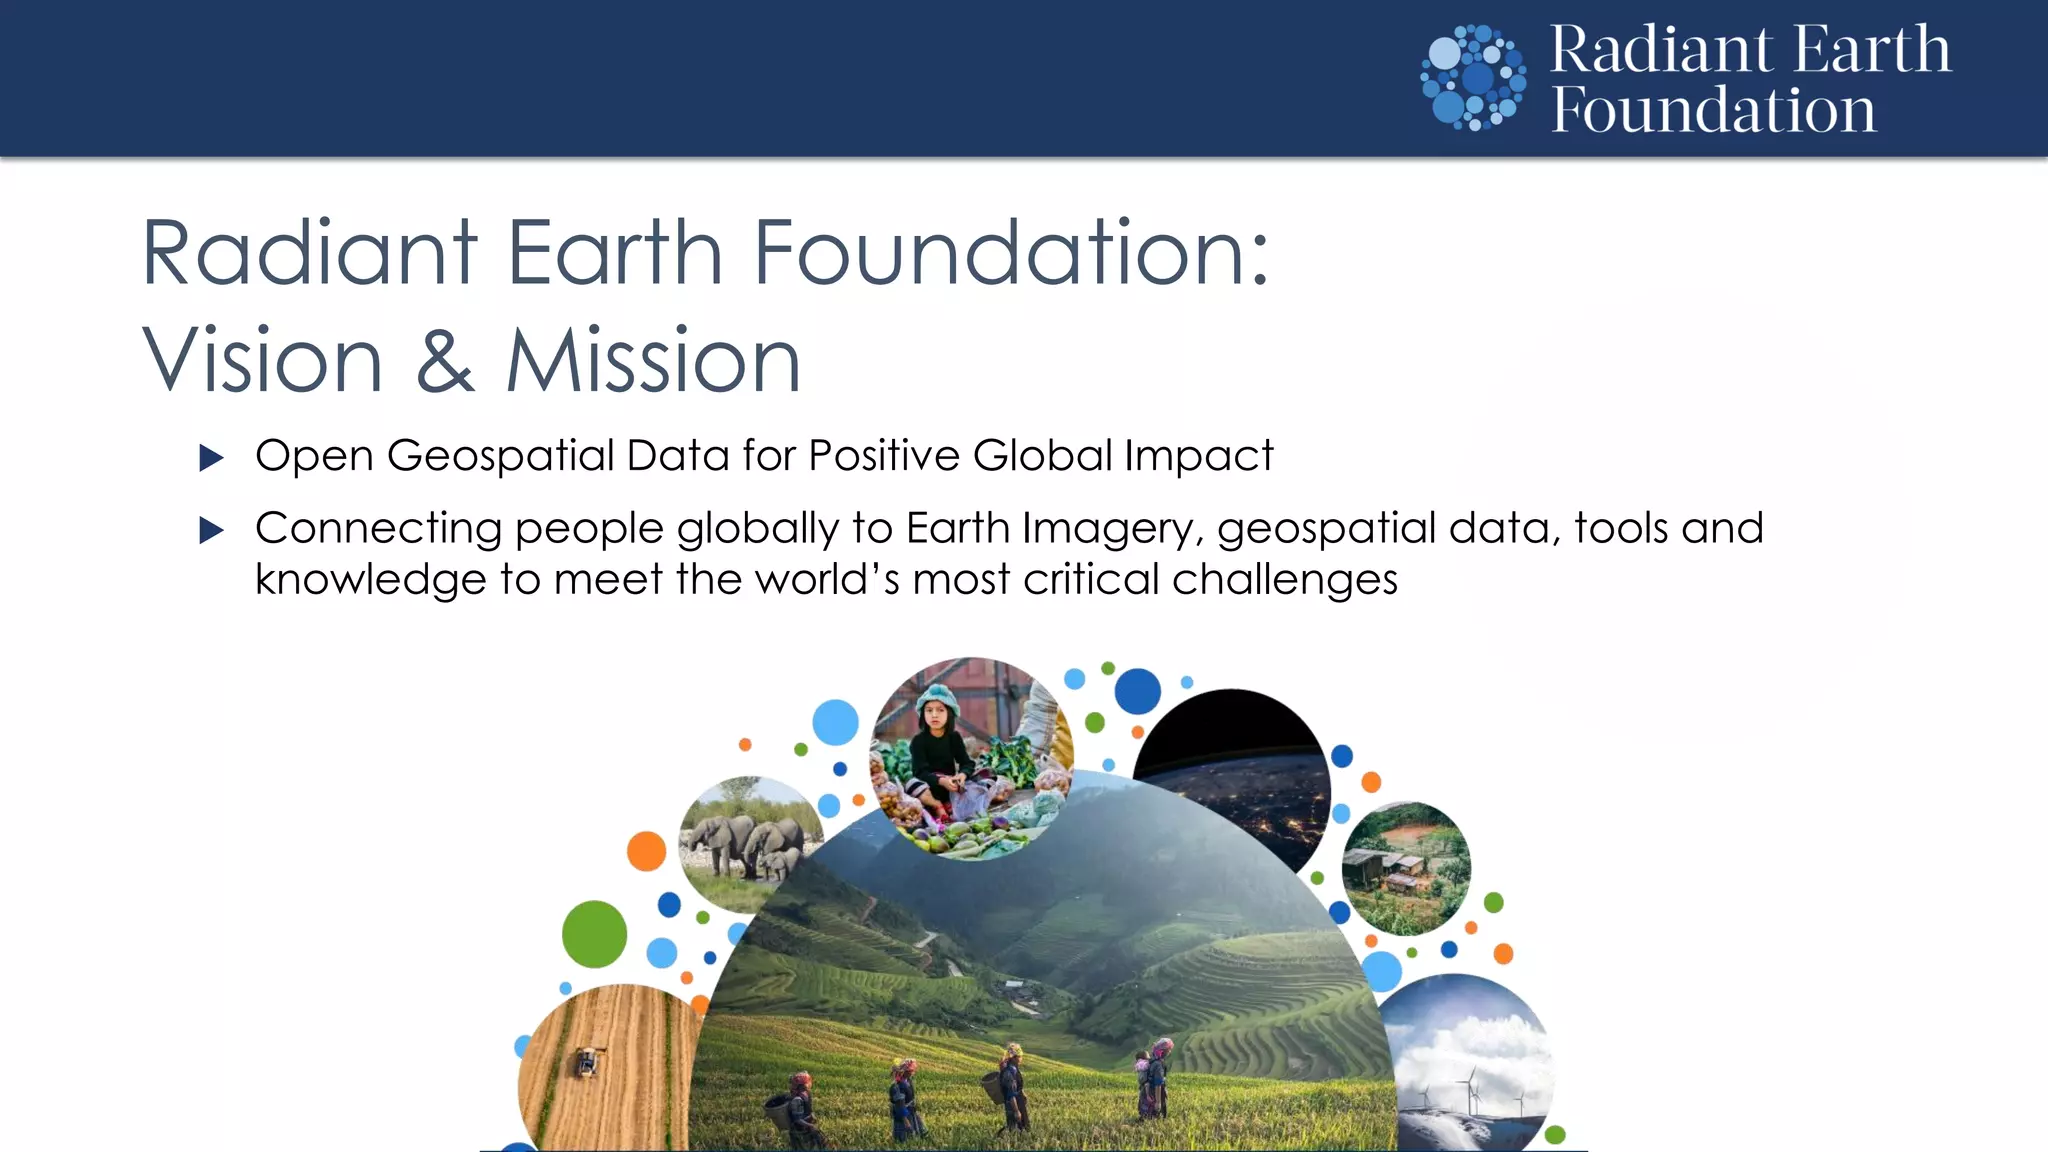
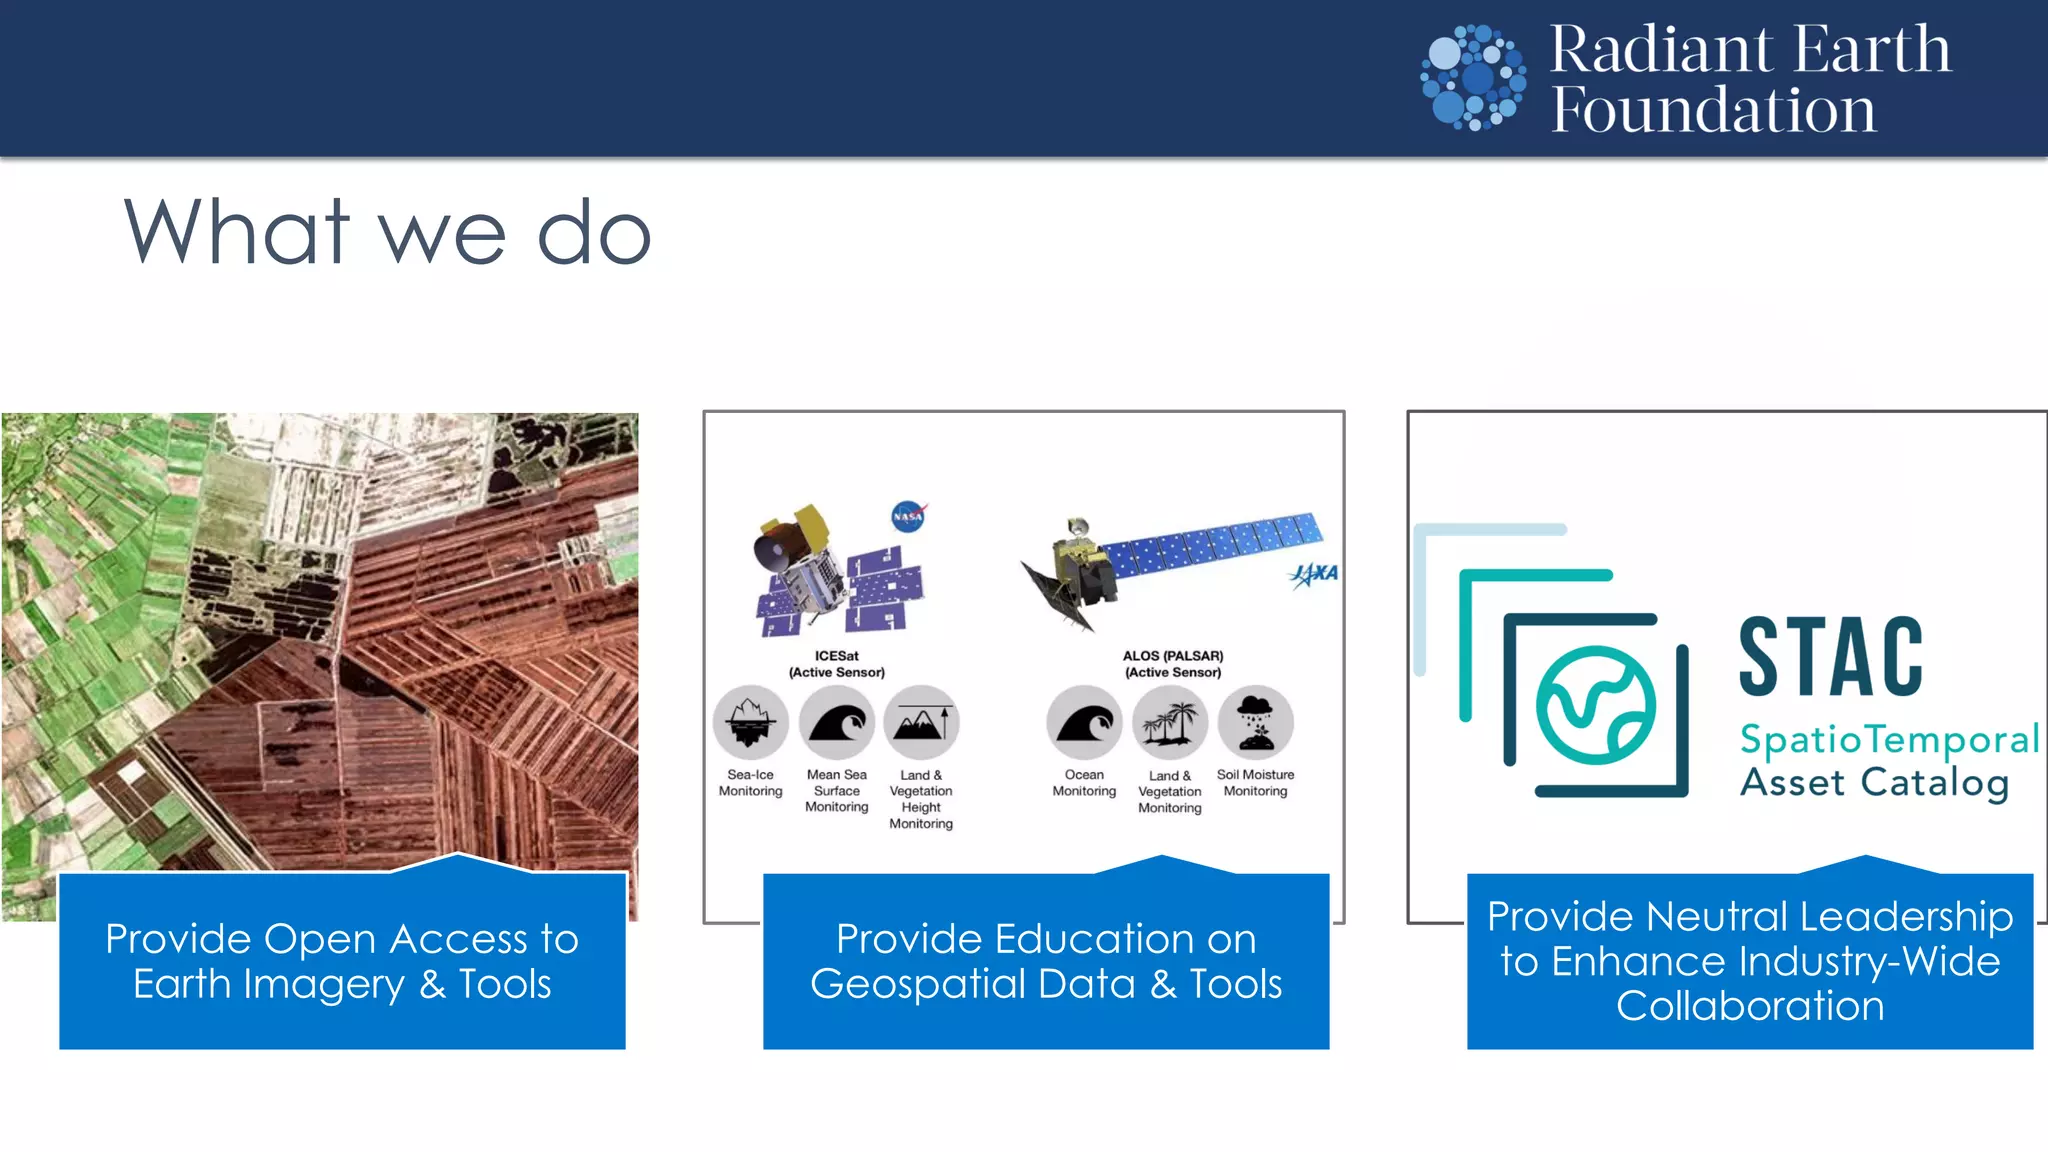
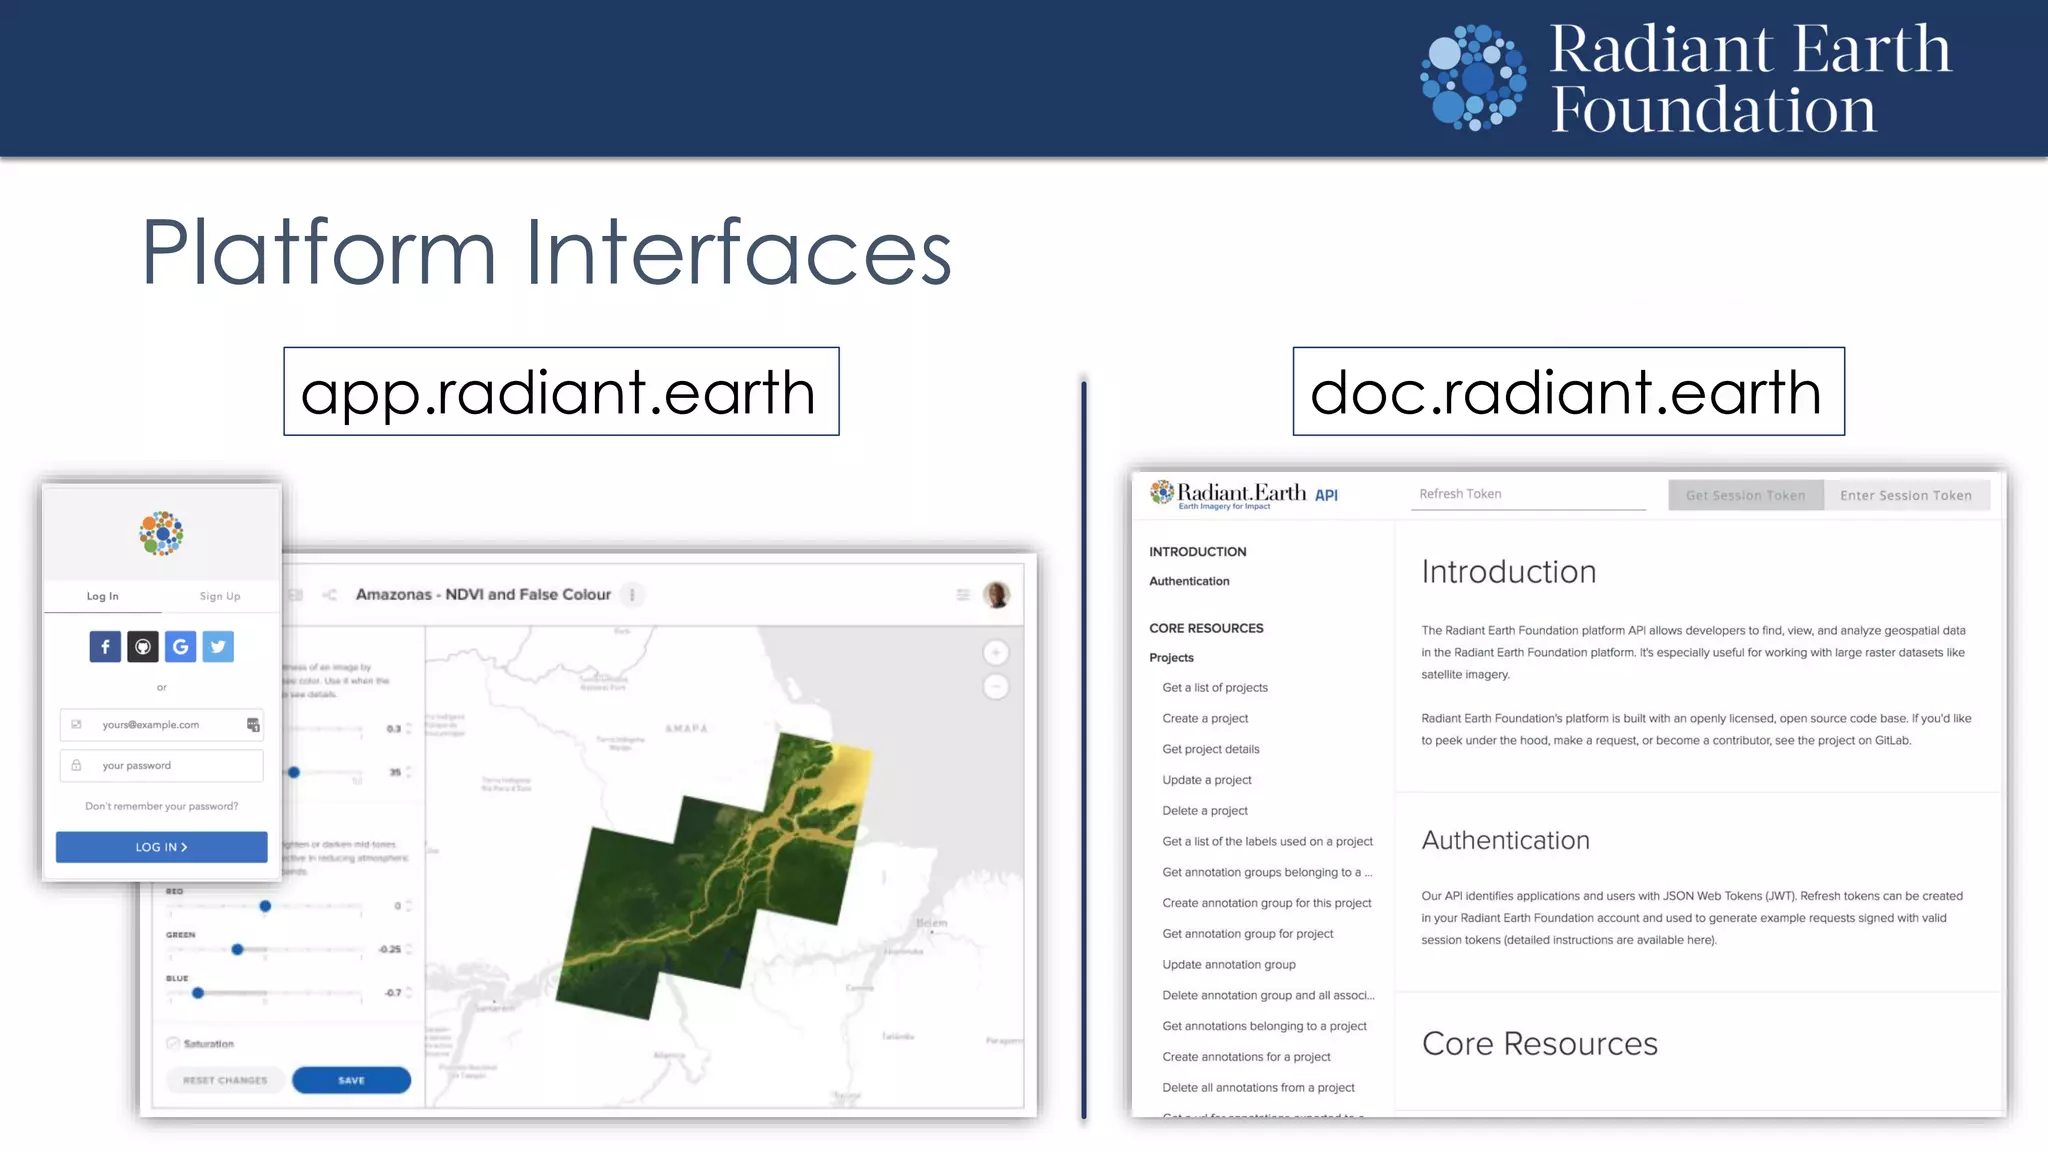
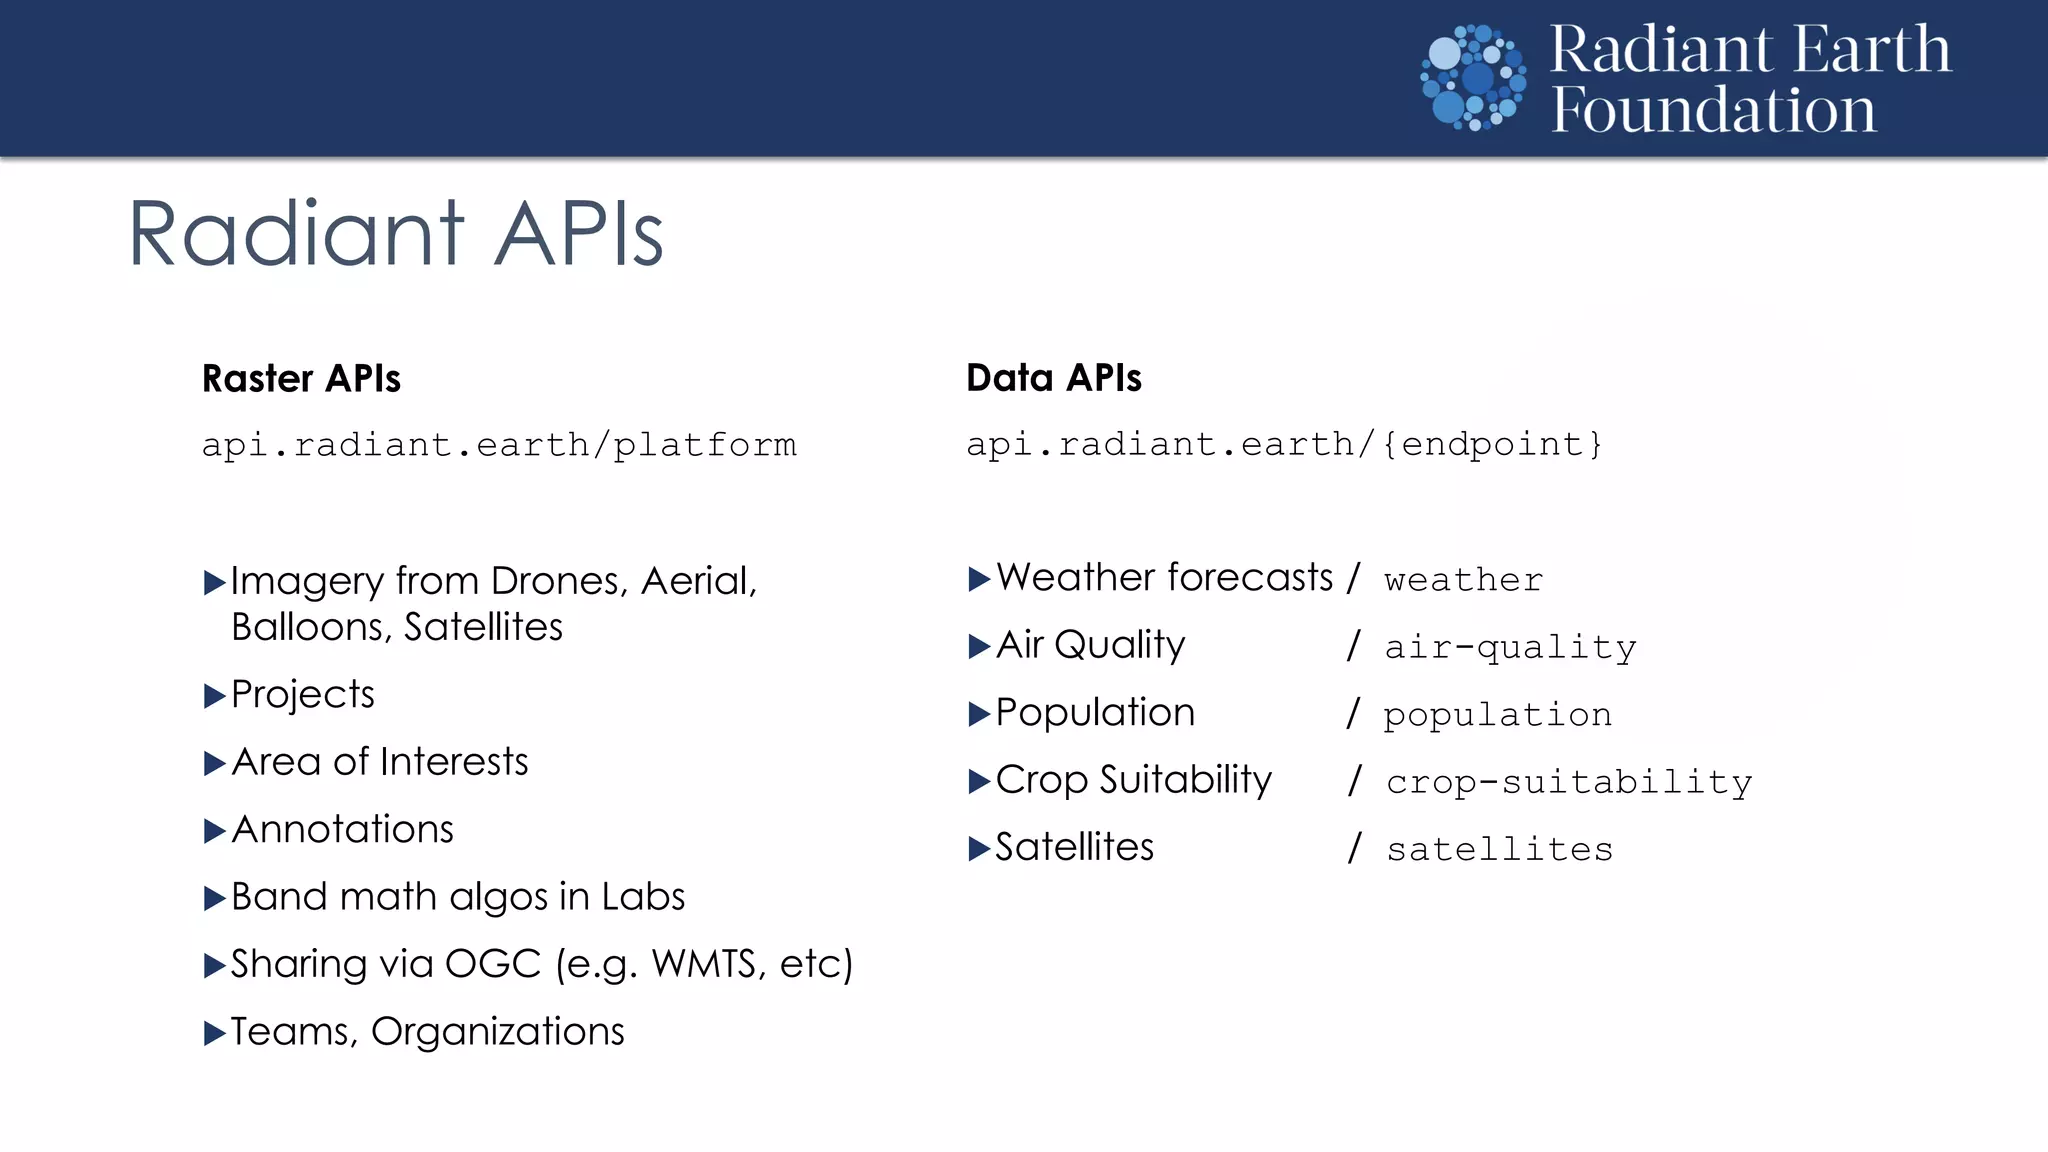
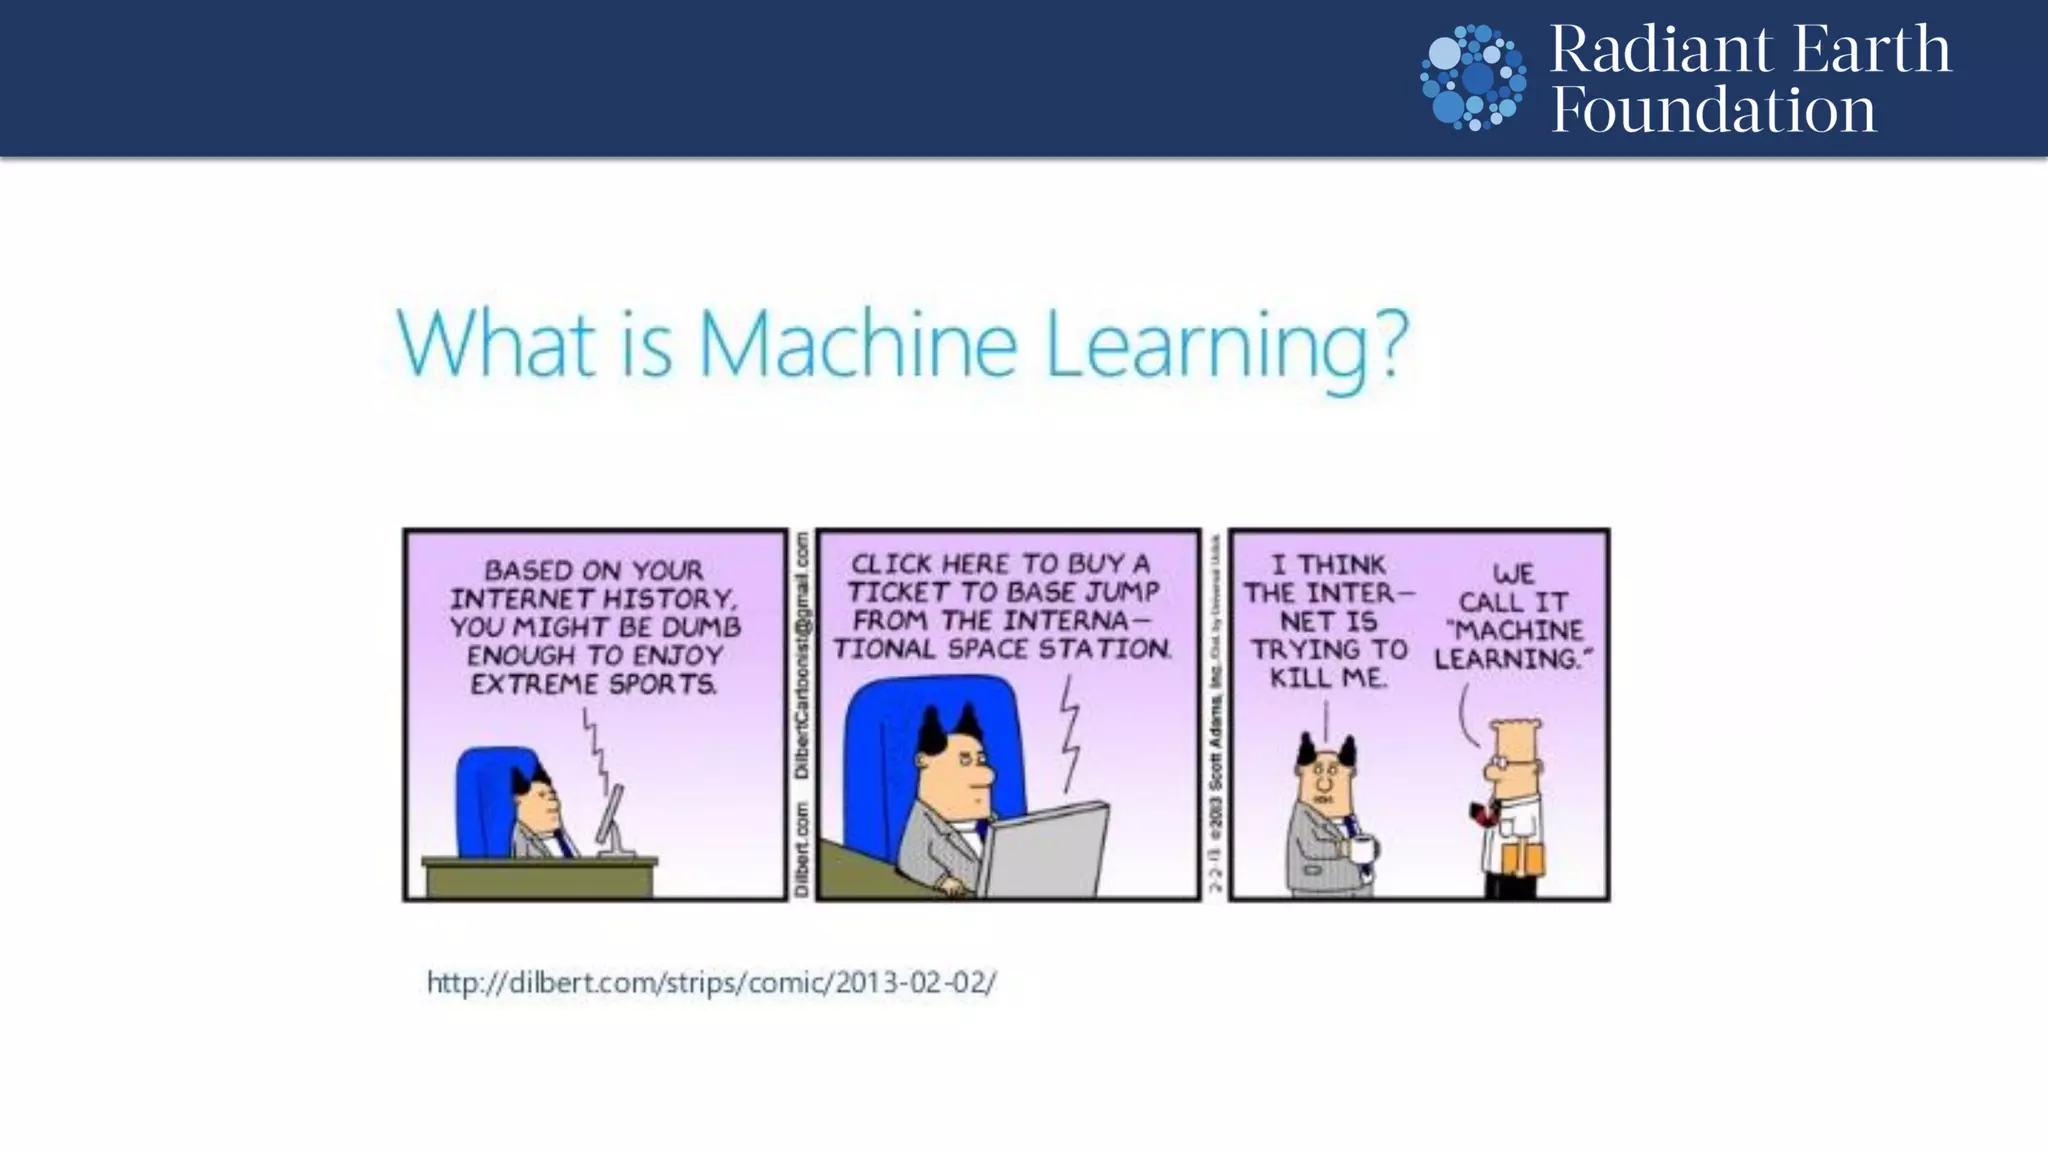
The following presentation was delivered by Robert Morrison, Principal Consultant at Esri Ireland, at the 2019 NICS ICT Conference in October 2019.
The presentation focuses on taking a geographic approach to machine learning to help you "see what other's can't".
Imagery and remotely sensed data is a valuable resource for many organisations who have made substantial investment obtaining the data. The field of Machine Learning is both broad and deep and is constantly evolving. Using ArcGIS and Machine Learning allows organisations to derive valuable new content.
ArcGIS is an open, interoperable platform that allows for the integration of complementary methods and techniques that empower ArcGIS users to solve complex, real-world problems in a fundamentally spatial way.
Learn how by combining powerful built-in Image analysis tools with any machine learning package users can benefit from the spatial validation, geo-enrichment and visualisation. See how this Machine Learning is being applied in real world use-cases from marine farming and crime analysis to agriculture and sustainability.
Presentation on applications of AI in the geospatial domain at the Fourth Edition of AI in Practice (6th November 2019, Startup Village, Amsterdam, The Netherlands)
Erik Van Der Zee, Enterprise Architect, Geodan
We show how deep learning can be effectively applied to remote sensing. Many problems we faced, solutions we have had discovered were highlighted too. Remotely sensed data, unlike other vision tasks are very challenging and posses extra difficulties. Objects are very small compared to the image size, and even small pixel sizes of 8*10 pixel can contain huge amount of informations.
To the best of our knowledge there is no automated or simi-automated tool that uses deep learning to detect features from satellite imagery.
Remote Sensing Based Soil Moisture DetectionCIMMYT
Remote sensing –Beyond images
Mexico 14-15 December 2013
The workshop was organized by CIMMYT Global Conservation Agriculture Program (GCAP) and funded by the Bill & Melinda Gates Foundation (BMGF), the Mexican Secretariat of Agriculture, Livestock, Rural Development, Fisheries and Food (SAGARPA), the International Maize and Wheat Improvement Center (CIMMYT), CGIAR Research Program on Maize, the Cereal System Initiative for South Asia (CSISA) and the Sustainable Modernization of the Traditional Agriculture (MasAgro)
Satellite Image Processing technique to enhance raw images received from cameras or sensors placed on satellites, space probes and aircrafts or pictures taken in normal day to day life in various applications.
Iirs overview -Remote sensing and GIS application in Water Resources ManagementTushar Dholakia
Remote sensing and GIS application in Water Resources Management- By S.P. Aggarval spa@iirs.gov.in Indian Institute of Remote sensing ISRO, Department of space, Dehradun
Multispectral remote sensors such as the Landsat Thematic Mapper and SPOT XS produce
images with a few relatively broad wavelength bands. Hyperspectral remote sensors, on the
other hand, collect image data simultaneously in dozens or hundreds of narrow, adjacent
spectral bands. These measurements make it possible to derive a continuous spectrum for each
image cell, as shown in the illustration below. After adjustments for sensor, atmospheric, and
terrain effects are applied, these image spectra can be compared with field or laboratory
reflectance spectra in order to recognize and map surface materials such as particular types of
vegetation or diagnostic minerals associated with ore deposits.
this presentation briefly describes the digital image processing and its various procedures and techniques which include image correction or rectification with remote sensing data/ images. it also contains various image classification techniques.
Taking a Geographic Approach to Machine Learning - Esri Ireland 'Do One Thing...Esri Ireland
Discover how you can take a geographic approach to machine learning to help you "See What Others Can't".
Imagery and remotely sensed data is a valuable resource for many organisations who have made substantial investment obtaining the data. The field of machine learning is both broad and deep and is constantly evolving. Using ArcGIS and machine learning allows organisations to derive valuable new content. ArcGIS is an open, interoperable platform that allows for the integration of complementary methods and techniques that empower ArcGIS users to solve complex, real-world problems in a fundamentally spatial way.
These slides were used as part of episode 6 of the Esri Ireland 'Do One Thing Well' Webinar Series. You can watch the webinar recording here: https://youtu.be/zAzNqw4KZRk
For any questions relating to the contents of this webinar or other GIS related inquiries, you can contact our team via mapsmakesense@esri-ireland.ie.
by the examples of FLARECAST and jHelioviewer.
Presentation held on the occasion of a Taiwanese delegation visiting the School of Engineering, FHNW Windisch, Switzerland.
André Csillaghy, October 2015
REMOTE SENSING AND GEOGRAPHIC INFORMATION SYSTEMS AM Publications
Remote sensing technology's increasing accessibility helps us observe research and learn about our globe in ways we could only imagine a generation ago. Guides to profound knowledge of historical, conceptual and practical uses of remote sensing which is increasing GIS technology. This paper will go briefly through remote sensing benefits, history, technology and the GIS and remote sensing integration and their applications. Remote sensing (RS) is used in mapping the predicted and actual species and dominates the ecosystem canopy.
National Highway Alignment from Namakkal to Erode Using GISIJERA Editor
The vision of the Highway Alignment is to increase the capacity, connectivity, efficiency and safety of the Highways System so as to enable balanced socioeconomic development of all sections of the people and all regions from NAMAKKAL to ERODE via and to reduce the traffic and travelling of the state. It is to establish shortest path for road network time in the roads which provide a better and comfortable base for updating the traffic and other related information in road administration. It is to identify the short route for the vehicles traveling from NAMAKKAL to ERODE and to reduce the time travel for the vehicles with possible paths or routes or places for laying eco-friendly highway. To optimize the route for the vehicles traveling from NAMAKKAL to ERODE using GIS with Network analysis tools. From this we can find the suitable route for peoples to carry out without any traffic disturbances and protecting the environment. It also took advantages of GIS capabilities that offer the ability to overlay maps, merge them, and perform spatial analysis on various layers of information in either two or three dimensions
by the examples of two European research projects JHelioviewer and FLARECAST. Talk given for a Taiwanese delegation at the University of Applied Sciences FHNW, Switzerland.
Module 10 - Section 4: ICTs for understanding and monitoring the environment ...Richard Labelle
Slide presentations developed to demonstrate how Information and Communication Technologies (ICTs) be used to address climate change, and why ICTs are a crucial part of the solution – i.e. in promoting efficiency, Green Growth & sustainable development, in dealing with climate change and for climate and environmental action. These slide presentations were delivered in February 2011 in Seongnam, near Seoul in Korea.
These presentations were developed and delivered over 2.5 days on the occasion of a Regional Training of Trainers Workshop for upcoming Academy modules on ICT for Disaster Risk Management and Climate Change Abatement. These modules were developed as part of the Academy of ICT Essentials for Government leaders developed by the United Nations (UN) Asia Pacific Centre for ICT Training (APCICT), based in Songdo City, in the Republic of South Korea.
These presentations were developed in 2011, and are somewhat out of date, but most of the principles still apply. Module 10, which has been published, does not include much of the information outlined in these presentations, which are fairly technical. They were developed to address a significant gap in understanding of the technical basis of using ICTs for climate action and because there is a clear bias in development circles against the importance of dealing with climate change mitigation in developing countries. These presentations are an attempt to redress this lack and are published here with this purpose in mind.
The author, Richard Labelle, is presently working on updating these presentations to further highlight the importance of addressing climate change and the important role that technology including ICTs, play in this effort.
Space research : space research projects under the 7th framework programme for research (5th call)
Civilisations have always wondered what is beyond the sky. But it is only recently that the limitless possibilities provided by space science and technology came into stronger spotlight and started to be used to the full. The EU has been playing a significant role in this process, in particular through the FP7 space research programme. The 5th FP7 space call brochure – through presentation of 50 projects divided into four categories (Copernicus applications and data; space technologies; space science and data exploitation; cross-cutting issues) – aims at giving a comprehensive overview of Europe's endeavours to fully, yet sustainably, use space for purposes ranging from excellent reception of TV signal to helping victims of earthquakes and other natural disasters
Similar to IMED 2018: An intro to Remote Sensing and Machine Learning (20)
Workshop: Quantifying Error in Training Data for Mapping and Monitoring the E...Louisa Diggs
Quantifying Error in Training Data for Mapping and Monitoring the Earth System - A Workshop on “Quantifying Error in Training Data for Mapping and Monitoring the Earth System” was held on January 8-9, 2019 at Clark University, with support from Omidyar Network’s Property Rights Initiative, now PlaceFund.
Using Active Learning to Quantify how Training Data Errors Impact Classificat...Louisa Diggs
Quantifying Error in Training Data for Mapping and Monitoring the Earth System - A Workshop on “Quantifying Error in Training Data for Mapping and Monitoring the Earth System” was held on January 8-9, 2019 at Clark University, with support from Omidyar Network’s Property Rights Initiative, now PlaceFund.
Generating Training Data from Noisy MeasrementsLouisa Diggs
Quantifying Error in Training Data for Mapping and Monitoring the Earth System - A Workshop on “Quantifying Error in Training Data for Mapping and Monitoring the Earth System” was held on January 8-9, 2019 at Clark University, with support from Omidyar Network’s Property Rights Initiative, now PlaceFund.
Cropped Field Boundaries, Food Systems, & FireLouisa Diggs
Quantifying Error in Training Data for Mapping and Monitoring the Earth System - A Workshop on “Quantifying Error in Training Data for Mapping and Monitoring the Earth System” was held on January 8-9, 2019 at Clark University, with support from Omidyar Network’s Property Rights Initiative, now PlaceFund.
Challenges to Large Scale Mapping: Can Data Geometry Help?Louisa Diggs
Quantifying Error in Training Data for Mapping and Monitoring the Earth System - A Workshop on “Quantifying Error in Training Data for Mapping and Monitoring the Earth System” was held on January 8-9, 2019 at Clark University, with support from Omidyar Network’s Property Rights Initiative, now PlaceFund.
A Random Walk of Issues Related to Training Data and Land Cover MappingLouisa Diggs
Quantifying Error in Training Data for Mapping and Monitoring the Earth System - A Workshop on “Quantifying Error in Training Data for Mapping and Monitoring the Earth System” was held on January 8-9, 2019 at Clark University, with support from Omidyar Network’s Property Rights Initiative, now PlaceFund.
Assessing Land Cover Change using Uncertain DataLouisa Diggs
Quantifying Error in Training Data for Mapping and Monitoring the Earth System - A Workshop on “Quantifying Error in Training Data for Mapping and Monitoring the Earth System” was held on January 8-9, 2019 at Clark University, with support from Omidyar Network’s Property Rights Initiative, now PlaceFund.
Informal Settlements and Cadastral MappingLouisa Diggs
Quantifying Error in Training Data for Mapping and Monitoring the Earth System - A Workshop on “Quantifying Error in Training Data for Mapping and Monitoring the Earth System” was held on January 8-9, 2019 at Clark University, with support from Omidyar Network’s Property Rights Initiative, now PlaceFund.
Sources of Map Error in Public Health Activities and Operations ResearchLouisa Diggs
Quantifying Error in Training Data for Mapping and Monitoring the Earth System - A Workshop on “Quantifying Error in Training Data for Mapping and Monitoring the Earth System” was held on January 8-9, 2019 at Clark University, with support from Omidyar Network’s Property Rights Initiative, now PlaceFund.
Measuring the impact of label noise on semantic segmentation using rastervisionLouisa Diggs
Quantifying Error in Training Data for Mapping and Monitoring the Earth System - A Workshop on “Quantifying Error in Training Data for Mapping and Monitoring the Earth System” was held on January 8-9, 2019 at Clark University, with support from Omidyar Network’s Property Rights Initiative, now PlaceFund.
Mapping Smallholder Yields Using Micro-Satellite DataLouisa Diggs
Quantifying Error in Training Data for Mapping and Monitoring the Earth System - A Workshop on “Quantifying Error in Training Data for Mapping and Monitoring the Earth System” was held on January 8-9, 2019 at Clark University, with support from Omidyar Network’s Property Rights Initiative, now PlaceFund.
Crowdsourcing Land Cover and Land Use Data: Experiences from IIASALouisa Diggs
Quantifying Error in Training Data for Mapping and Monitoring the Earth System - A Workshop on “Quantifying Error in Training Data for Mapping and Monitoring the Earth System” was held on January 8-9, 2019 at Clark University, with support from Omidyar Network’s Property Rights Initiative, now PlaceFund.
IMED 2018: The use of remote sensing, geostatistical and machine learning met...Louisa Diggs
Kebede Deribe, Ph.D., MPH, Wellcome Trust Brighton and Sussex Centre for Global Health Research, Brighton and Sussex Medical School, Brighton, UK and School of Public Health, Addis Ababa University, Addis Ababa, Ethiopia: The use of remote sensing, geostatistical and machine learning methods in neglected tropical diseases surveillance — the case of podoconiosis and lymphatic filariasis.
IMED 2018: Predicting the environmental suitability of podoconiosis in EthiopiaLouisa Diggs
Kebede Deribe, Ph.D., MPH, Brighton, and Sussex Medical School, and, School of Public Health, Addis Ababa University: Predicting the environmental suitability of podoconiosis in Ethiopia
IMED 2018: Modeled Population Estimates from Satellite Imagery and Microcensu...Louisa Diggs
Vincent Seaman Ph.D., Senior Program Officer, Polio Eradication Program, Bill and Melinda Gates Foundation: Modeled Population Estimates from Satellite Imagery and Microcensus Data.
IMED 2018: Predicting spatiotemporal risk of yellow fever using a machine lea...Louisa Diggs
RajReni Kaul, Doctoral candidate, Odum School of Ecology, University of Georgia: Predicting spatiotemporal risk of yellow fever using a machine learning approach.
Chatty Kathy - UNC Bootcamp Final Project Presentation - Final Version - 5.23...John Andrews
SlideShare Description for "Chatty Kathy - UNC Bootcamp Final Project Presentation"
Title: Chatty Kathy: Enhancing Physical Activity Among Older Adults
Description:
Discover how Chatty Kathy, an innovative project developed at the UNC Bootcamp, aims to tackle the challenge of low physical activity among older adults. Our AI-driven solution uses peer interaction to boost and sustain exercise levels, significantly improving health outcomes. This presentation covers our problem statement, the rationale behind Chatty Kathy, synthetic data and persona creation, model performance metrics, a visual demonstration of the project, and potential future developments. Join us for an insightful Q&A session to explore the potential of this groundbreaking project.
Project Team: Jay Requarth, Jana Avery, John Andrews, Dr. Dick Davis II, Nee Buntoum, Nam Yeongjin & Mat Nicholas
As Europe's leading economic powerhouse and the fourth-largest hashtag#economy globally, Germany stands at the forefront of innovation and industrial might. Renowned for its precision engineering and high-tech sectors, Germany's economic structure is heavily supported by a robust service industry, accounting for approximately 68% of its GDP. This economic clout and strategic geopolitical stance position Germany as a focal point in the global cyber threat landscape.
In the face of escalating global tensions, particularly those emanating from geopolitical disputes with nations like hashtag#Russia and hashtag#China, hashtag#Germany has witnessed a significant uptick in targeted cyber operations. Our analysis indicates a marked increase in hashtag#cyberattack sophistication aimed at critical infrastructure and key industrial sectors. These attacks range from ransomware campaigns to hashtag#AdvancedPersistentThreats (hashtag#APTs), threatening national security and business integrity.
🔑 Key findings include:
🔍 Increased frequency and complexity of cyber threats.
🔍 Escalation of state-sponsored and criminally motivated cyber operations.
🔍 Active dark web exchanges of malicious tools and tactics.
Our comprehensive report delves into these challenges, using a blend of open-source and proprietary data collection techniques. By monitoring activity on critical networks and analyzing attack patterns, our team provides a detailed overview of the threats facing German entities.
This report aims to equip stakeholders across public and private sectors with the knowledge to enhance their defensive strategies, reduce exposure to cyber risks, and reinforce Germany's resilience against cyber threats.
Adjusting primitives for graph : SHORT REPORT / NOTESSubhajit Sahu
Graph algorithms, like PageRank Compressed Sparse Row (CSR) is an adjacency-list based graph representation that is
Multiply with different modes (map)
1. Performance of sequential execution based vs OpenMP based vector multiply.
2. Comparing various launch configs for CUDA based vector multiply.
Sum with different storage types (reduce)
1. Performance of vector element sum using float vs bfloat16 as the storage type.
Sum with different modes (reduce)
1. Performance of sequential execution based vs OpenMP based vector element sum.
2. Performance of memcpy vs in-place based CUDA based vector element sum.
3. Comparing various launch configs for CUDA based vector element sum (memcpy).
4. Comparing various launch configs for CUDA based vector element sum (in-place).
Sum with in-place strategies of CUDA mode (reduce)
1. Comparing various launch configs for CUDA based vector element sum (in-place).
Data Centers - Striving Within A Narrow Range - Research Report - MCG - May 2...pchutichetpong
M Capital Group (“MCG”) expects to see demand and the changing evolution of supply, facilitated through institutional investment rotation out of offices and into work from home (“WFH”), while the ever-expanding need for data storage as global internet usage expands, with experts predicting 5.3 billion users by 2023. These market factors will be underpinned by technological changes, such as progressing cloud services and edge sites, allowing the industry to see strong expected annual growth of 13% over the next 4 years.
Whilst competitive headwinds remain, represented through the recent second bankruptcy filing of Sungard, which blames “COVID-19 and other macroeconomic trends including delayed customer spending decisions, insourcing and reductions in IT spending, energy inflation and reduction in demand for certain services”, the industry has seen key adjustments, where MCG believes that engineering cost management and technological innovation will be paramount to success.
MCG reports that the more favorable market conditions expected over the next few years, helped by the winding down of pandemic restrictions and a hybrid working environment will be driving market momentum forward. The continuous injection of capital by alternative investment firms, as well as the growing infrastructural investment from cloud service providers and social media companies, whose revenues are expected to grow over 3.6x larger by value in 2026, will likely help propel center provision and innovation. These factors paint a promising picture for the industry players that offset rising input costs and adapt to new technologies.
According to M Capital Group: “Specifically, the long-term cost-saving opportunities available from the rise of remote managing will likely aid value growth for the industry. Through margin optimization and further availability of capital for reinvestment, strong players will maintain their competitive foothold, while weaker players exit the market to balance supply and demand.”
Show drafts
volume_up
Empowering the Data Analytics Ecosystem: A Laser Focus on Value
The data analytics ecosystem thrives when every component functions at its peak, unlocking the true potential of data. Here's a laser focus on key areas for an empowered ecosystem:
1. Democratize Access, Not Data:
Granular Access Controls: Provide users with self-service tools tailored to their specific needs, preventing data overload and misuse.
Data Catalogs: Implement robust data catalogs for easy discovery and understanding of available data sources.
2. Foster Collaboration with Clear Roles:
Data Mesh Architecture: Break down data silos by creating a distributed data ownership model with clear ownership and responsibilities.
Collaborative Workspaces: Utilize interactive platforms where data scientists, analysts, and domain experts can work seamlessly together.
3. Leverage Advanced Analytics Strategically:
AI-powered Automation: Automate repetitive tasks like data cleaning and feature engineering, freeing up data talent for higher-level analysis.
Right-Tool Selection: Strategically choose the most effective advanced analytics techniques (e.g., AI, ML) based on specific business problems.
4. Prioritize Data Quality with Automation:
Automated Data Validation: Implement automated data quality checks to identify and rectify errors at the source, minimizing downstream issues.
Data Lineage Tracking: Track the flow of data throughout the ecosystem, ensuring transparency and facilitating root cause analysis for errors.
5. Cultivate a Data-Driven Mindset:
Metrics-Driven Performance Management: Align KPIs and performance metrics with data-driven insights to ensure actionable decision making.
Data Storytelling Workshops: Equip stakeholders with the skills to translate complex data findings into compelling narratives that drive action.
Benefits of a Precise Ecosystem:
Sharpened Focus: Precise access and clear roles ensure everyone works with the most relevant data, maximizing efficiency.
Actionable Insights: Strategic analytics and automated quality checks lead to more reliable and actionable data insights.
Continuous Improvement: Data-driven performance management fosters a culture of learning and continuous improvement.
Sustainable Growth: Empowered by data, organizations can make informed decisions to drive sustainable growth and innovation.
By focusing on these precise actions, organizations can create an empowered data analytics ecosystem that delivers real value by driving data-driven decisions and maximizing the return on their data investment.
IMED 2018: An intro to Remote Sensing and Machine Learning
1. An Intro to
Remote Sensing and
Machine Learning
HAMED ALEMOHAMMAD
LEAD GEOSPATIAL DATA SCIENTIST, RADIANT EARTH FOUNDATION
IMED, 2018, Vienna, Austria
3. Satellite Remote Sensing
Satellites carry instruments or
sensors which measure
electromagnetic radiation
coming from the earth-
atmosphere system.
3
4. Measuring Earth Surface and
Atmospheric Properties
The intensity of reflected and emitted
radiation to space is influenced by the
surface and atmospheric conditions.
Thus, satellite measurements contain
information about the surface and
atmospheric conditions.
6. Interaction with Vegetation
Example: Healthy, green vegetation absorbs Blue and Red
wavelengths and reflects Green and Infrared.
Since we cannot see infrared radiation,
we see healthy vegetation as green.
7. Spectral Signatures in Imagery
Remotely sensed imagery acquires information in different wavelengths,
representing different parts of the Electromagnetic Spectrum.
9. Solar Induced Fluorescence (SIF)
Energy absorbed by plant through its chlorophyll
used for gross primary production (GPP)
lost as heat
re-emitted (SIF: byproduct)
SIF responds to stressors (water, light, T).
Babani, F., et al. 2005
10. Except for Indonesia all tropical regions exhibit some
seasonal cycle due to light/water limitations
27. Intelligence Augmentation (IA):
Computation and data used to create services that augment
human intelligence and creativity.
Search engine
Natural language translation
Intelligent Infrastructure (II):
A web of computation, data and physical entities that makes
human environments more supportive, interesting and safe.
Starting to appear in domains such as transportation, medicine,
commerce and finance.
Credit: Michael Jordan, Professor at UC Berkeley
39. Training Data Challenges
Capturing the wide range of possible outcomes both in
space and time;
Accuracy;
GeoDiversity
Accessibility;
Inter-Operability;
ML-Readiness;
40. Open source machine learning commons
for Earth Observations.
Promoting creation of open libraries of labeled images and
algorithms to advance ML for global development, and
democratize ML applications for EO data.
Developers can join the collaborative initiative and
contribute their tools and knowledge on Github.
Imagery training data will be created as STAC compliant
and in COG format.
41. • The Problem: Need for an open,
dynamic, global, and comprehensive
LC map
Open Training Library for Land Cover
Classification:
• Using Deep Learning for labeling
imagery
• Crowdsourcing and citizen
science to verify / correct the
labels
Sponsored by:
Open Source
10 m resolution
Global
ML Centric
• Solution: Training labeled image library
for land cover classification
42. Radiant Earth Foundation:
Vision & Mission
Open Geospatial Data for Positive Global Impact
Connecting people globally to Earth Imagery, geospatial data, tools and
knowledge to meet the world’s most critical challenges
43. What we do
Provide Open Access to
Earth Imagery & Tools
Provide Education on
Geospatial Data & Tools
Provide Neutral Leadership
to Enhance Industry-Wide
Collaboration
44. Attributes of the Platform
AGILE
Experiment with data,
visualization, and collaborate in
a cross-domain multidisciplinary
ecosystem.
OPEN
Work with open
imagery, data sets and
technology standards.
NEUTRAL
Discover both government &
commercial imagery, and
collaborate with tech-and non-
technical users at the intersection
of global development & remote
sensing.
COLLABORATIVE
Learn and share ideas to
improve collaboration across
domains.
FEDERATED
Find and work with diverse
imagery data sets covering the
globe with a federated
catalogue.
45. Available Open Imagery
Datasource Temporal Coverage Temporal Revisit Spatial Resolution
Sentinel 2-A/B 2015 - present 5 days 10 m
Landsat 4/5/7/8 1982 - present 16 days 30 m
MODIS 2000 - present 8 day composite from daily 250 m
ISERV 2012 - 2015 Specific operation times 3.5 m
46. Platform Features
Supporting any imagery type:
Satellite
Drone
Airborne
Uploading pipelines:
Local
Dropbox
Amazon Web Services (AWS) S3 Bucket
Planet API Connection
Radiant Earth Foundation API
51. Get in touch Follow Us
740 15th St NW, Suite 900
Washington DC 20005
+ 1. 202.596.3603
hello@radiant.earth
www.radiant.earth | app.radiant.earth | help.radiant.earth | demos.radiant.earth
@OurRadiantEarth
https://www.facebook.com/OurRadiantEarth
Q & A