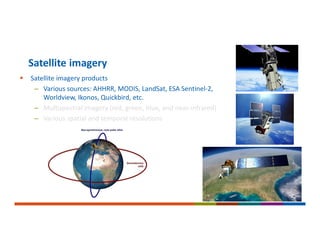
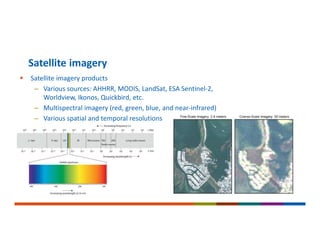
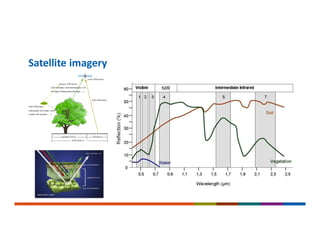
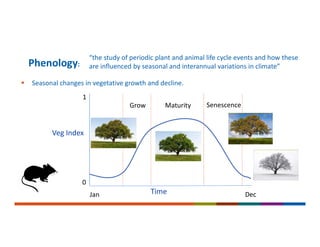
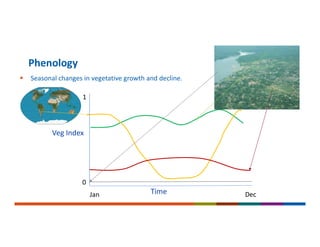
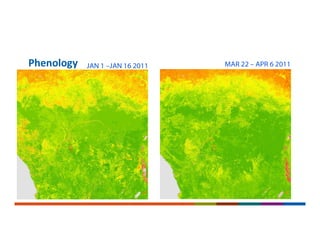
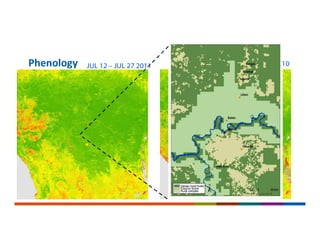
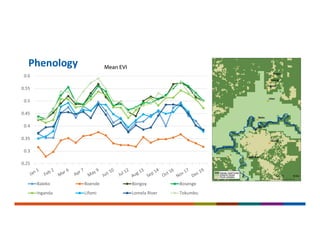
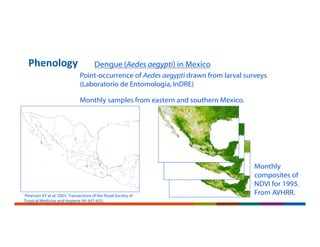
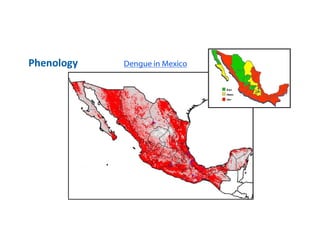
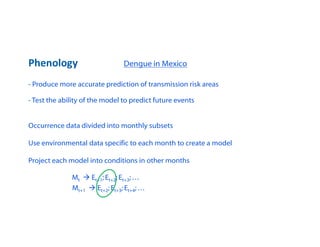
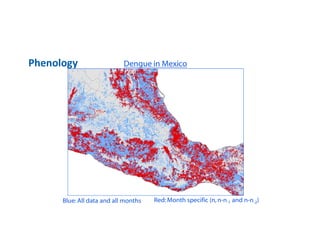
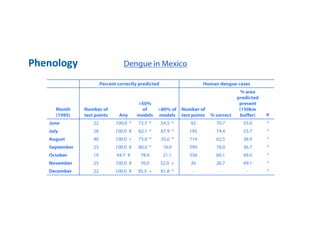
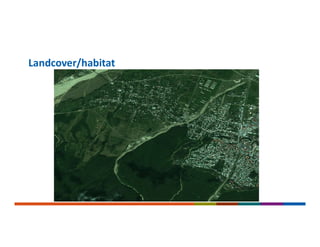
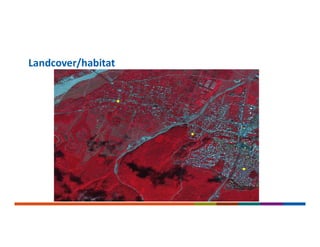
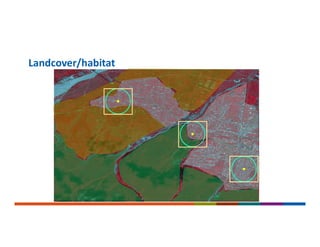
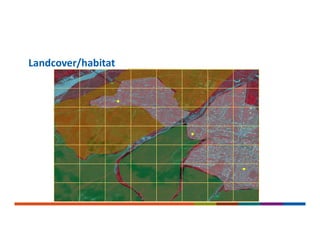
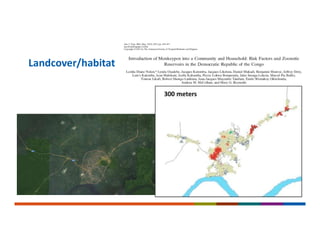
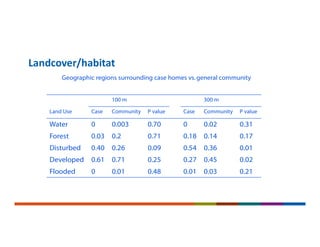
National Center for Emerging and Zoonotic Infectious Diseases
Landcover/habitat
International Meeting on Emerging Diseases and Surveillance
November 2018
Yoshinori Nakazawa
 Satellite imagery products
– Vegetation Indexes (NDVI, EVI), Reconstructed
Solar‐Induced Fluorescence (RSIF), Net Primary Productivity
(NPP)
 Phenology
– Growing season, senescence, etc.
 Cases/examples
Landcover/habitat
 Satellite imagery products
– Various sources: AHHRR, MODIS, LandSat, ESA Sentinel‐2,
Worldview, Ikonos, Quickbird, etc.
– Multispectral imagery (red, green, blue, and near‐infrared)
– Various spatial and temporal resolutions
Satellite imagery
 Satellite imagery products
– Various sources: AHHRR, MODIS, LandSat, ESA Sentinel‐2,
Worldview, Ikonos, Quickbird, etc.
– Multispectral imagery (red, green, blue, and near‐infrared)
– Various spatial and temporal resolutions
Satellite imagery
Satellite imagery
 Seasonal changes in vegetative growth and decline.
Phenology:
Veg Index
Time
Grow Maturity Senescence
0
1
Jan Dec
“the study of periodic plant and animal life cycle events and how these
are influenced by seasonal and interannual variations in climate”
 Seasonal changes in vegetative growth and decline.
Phenology
Veg Index
Time
0
1
Jan Dec
Phenology JAN 1 –JAN 16 2011 MAR 22 – APR 6 2011
Phenology JUL 12 – JUL 27 2011 OCT 16 – OCT 31 2010
Phenology
0.25
0.3
0.35
0.4
0.45
0.5
0.55
0.6
Mean EVI
Baleko Boende Bongoy Bosenge
Inganda Lifomi Lomela River Tokumbu
Phenology
Peterson AT et al. 2005. Transactions of the Royal Society of
Tropical Medicine and Hygiene 99: 647-655.
Dengue (Aedes aegypti) in Mexico
Point-occurrence of Aedes aegypti drawn from larval surveys
(Laboratorio de Entomologia, InDRE)
Monthly samples from eastern and southern Mexico.
Monthly
composites of
NDVI for 1995.
From AVHRR.
Phenology Dengue in Mexico
- Produce more accurate prediction of transmission risk areas
- Test the ability of the model to predict future events
Occurrence data divided into monthly subsets
Use environmental data specific to each month to create a model
Project each model into conditions in other months
Mt  Et+1; Et+2; Et+3; …
Mt+1  Et+2; Et+3; Et+4; …
Blue: All data and all months Red:Month specific (n,n-n-1 and n-n-2)
Phenology Dengue in Mexico
Percent correctly predicted Human dengue cases
Month
(1995)
Number of
test points Any
>50%
of
models
>80% of
models
Number of
test points % correct
% area
predicted
present
(150km
buffer) P
June 22 100.0 * 72.7 * 54.5 * 92 70.7 55.0 *
July 28 100.0 X 82.1 * 67.9 * 195 74.4 55.7 *
August 40 100.0 + 75.0 * 35.0 * 714 62.5 38.9 *
September 25 100.0 X 80.0 * 16.0 599 78.0 36.7 *
October 19 94.7 X 78.9 21.1 356 60.1 49.0 *
November 25 100.0 X 76.0 52.0 + 30 26.7 49.1 *
December 22 100.0 X 95.5 + 81.8 * - - - *
Phenology Dengue in Mexico
Landcover/habitat
Landcover/habitat
Landcover/habitat
Landcover/habitat
Landcover/habitat
Landcover/habitat
Landcover/habitat
100 m 300 m
Land Use Case Community P value Case Community P value
Water 0 0.003 0.70 0 0.02 0.31
Forest 0.03 0.2 0.71 0.18 0.14 0.17
Disturbed 0.40 0.26 0.09 0.54 0.36 0.01
Developed 0.61 0.71 0.25 0.27 0.45 0.02
Flooded 0 0.01 0.48 0.01 0.03 0.21
Geographic regions surrounding case homes vs.general community
For more information, contact CDC
1‐800‐CDC‐INFO (232‐4636)
TTY: 1‐888‐232‐6348 www.cdc.gov
The findings and conclusions in this report are those of the authors and do not necessarily represent the
official position of the Centers for Disease Control and Prevention.
Thank you!

IMED 2018: Landcover/habitat

  • 1.
    National Center forEmerging and Zoonotic Infectious Diseases Landcover/habitat International Meeting on Emerging Diseases and Surveillance November 2018 Yoshinori Nakazawa
  • 2.
     Satellite imageryproducts – Vegetation Indexes (NDVI, EVI), Reconstructed Solar‐Induced Fluorescence (RSIF), Net Primary Productivity (NPP)  Phenology – Growing season, senescence, etc.  Cases/examples Landcover/habitat
  • 3.
     Satellite imageryproducts – Various sources: AHHRR, MODIS, LandSat, ESA Sentinel‐2, Worldview, Ikonos, Quickbird, etc. – Multispectral imagery (red, green, blue, and near‐infrared) – Various spatial and temporal resolutions Satellite imagery
  • 4.
     Satellite imageryproducts – Various sources: AHHRR, MODIS, LandSat, ESA Sentinel‐2, Worldview, Ikonos, Quickbird, etc. – Multispectral imagery (red, green, blue, and near‐infrared) – Various spatial and temporal resolutions Satellite imagery
  • 5.
  • 6.
     Seasonal changesin vegetative growth and decline. Phenology: Veg Index Time Grow Maturity Senescence 0 1 Jan Dec “the study of periodic plant and animal life cycle events and how these are influenced by seasonal and interannual variations in climate”
  • 7.
     Seasonal changesin vegetative growth and decline. Phenology Veg Index Time 0 1 Jan Dec
  • 8.
    Phenology JAN 1–JAN 16 2011 MAR 22 – APR 6 2011
  • 9.
    Phenology JUL 12– JUL 27 2011 OCT 16 – OCT 31 2010
  • 10.
    Phenology 0.25 0.3 0.35 0.4 0.45 0.5 0.55 0.6 Mean EVI Baleko BoendeBongoy Bosenge Inganda Lifomi Lomela River Tokumbu
  • 11.
    Phenology Peterson AT etal. 2005. Transactions of the Royal Society of Tropical Medicine and Hygiene 99: 647-655. Dengue (Aedes aegypti) in Mexico Point-occurrence of Aedes aegypti drawn from larval surveys (Laboratorio de Entomologia, InDRE) Monthly samples from eastern and southern Mexico. Monthly composites of NDVI for 1995. From AVHRR.
  • 12.
  • 13.
    Phenology Dengue inMexico - Produce more accurate prediction of transmission risk areas - Test the ability of the model to predict future events Occurrence data divided into monthly subsets Use environmental data specific to each month to create a model Project each model into conditions in other months Mt  Et+1; Et+2; Et+3; … Mt+1  Et+2; Et+3; Et+4; …
  • 14.
    Blue: All dataand all months Red:Month specific (n,n-n-1 and n-n-2) Phenology Dengue in Mexico
  • 15.
    Percent correctly predictedHuman dengue cases Month (1995) Number of test points Any >50% of models >80% of models Number of test points % correct % area predicted present (150km buffer) P June 22 100.0 * 72.7 * 54.5 * 92 70.7 55.0 * July 28 100.0 X 82.1 * 67.9 * 195 74.4 55.7 * August 40 100.0 + 75.0 * 35.0 * 714 62.5 38.9 * September 25 100.0 X 80.0 * 16.0 599 78.0 36.7 * October 19 94.7 X 78.9 21.1 356 60.1 49.0 * November 25 100.0 X 76.0 52.0 + 30 26.7 49.1 * December 22 100.0 X 95.5 + 81.8 * - - - * Phenology Dengue in Mexico
  • 16.
  • 17.
  • 18.
  • 19.
  • 20.
  • 21.
  • 22.
    Landcover/habitat 100 m 300m Land Use Case Community P value Case Community P value Water 0 0.003 0.70 0 0.02 0.31 Forest 0.03 0.2 0.71 0.18 0.14 0.17 Disturbed 0.40 0.26 0.09 0.54 0.36 0.01 Developed 0.61 0.71 0.25 0.27 0.45 0.02 Flooded 0 0.01 0.48 0.01 0.03 0.21 Geographic regions surrounding case homes vs.general community
  • 23.
    For more information,contact CDC 1‐800‐CDC‐INFO (232‐4636) TTY: 1‐888‐232‐6348 www.cdc.gov The findings and conclusions in this report are those of the authors and do not necessarily represent the official position of the Centers for Disease Control and Prevention. Thank you!