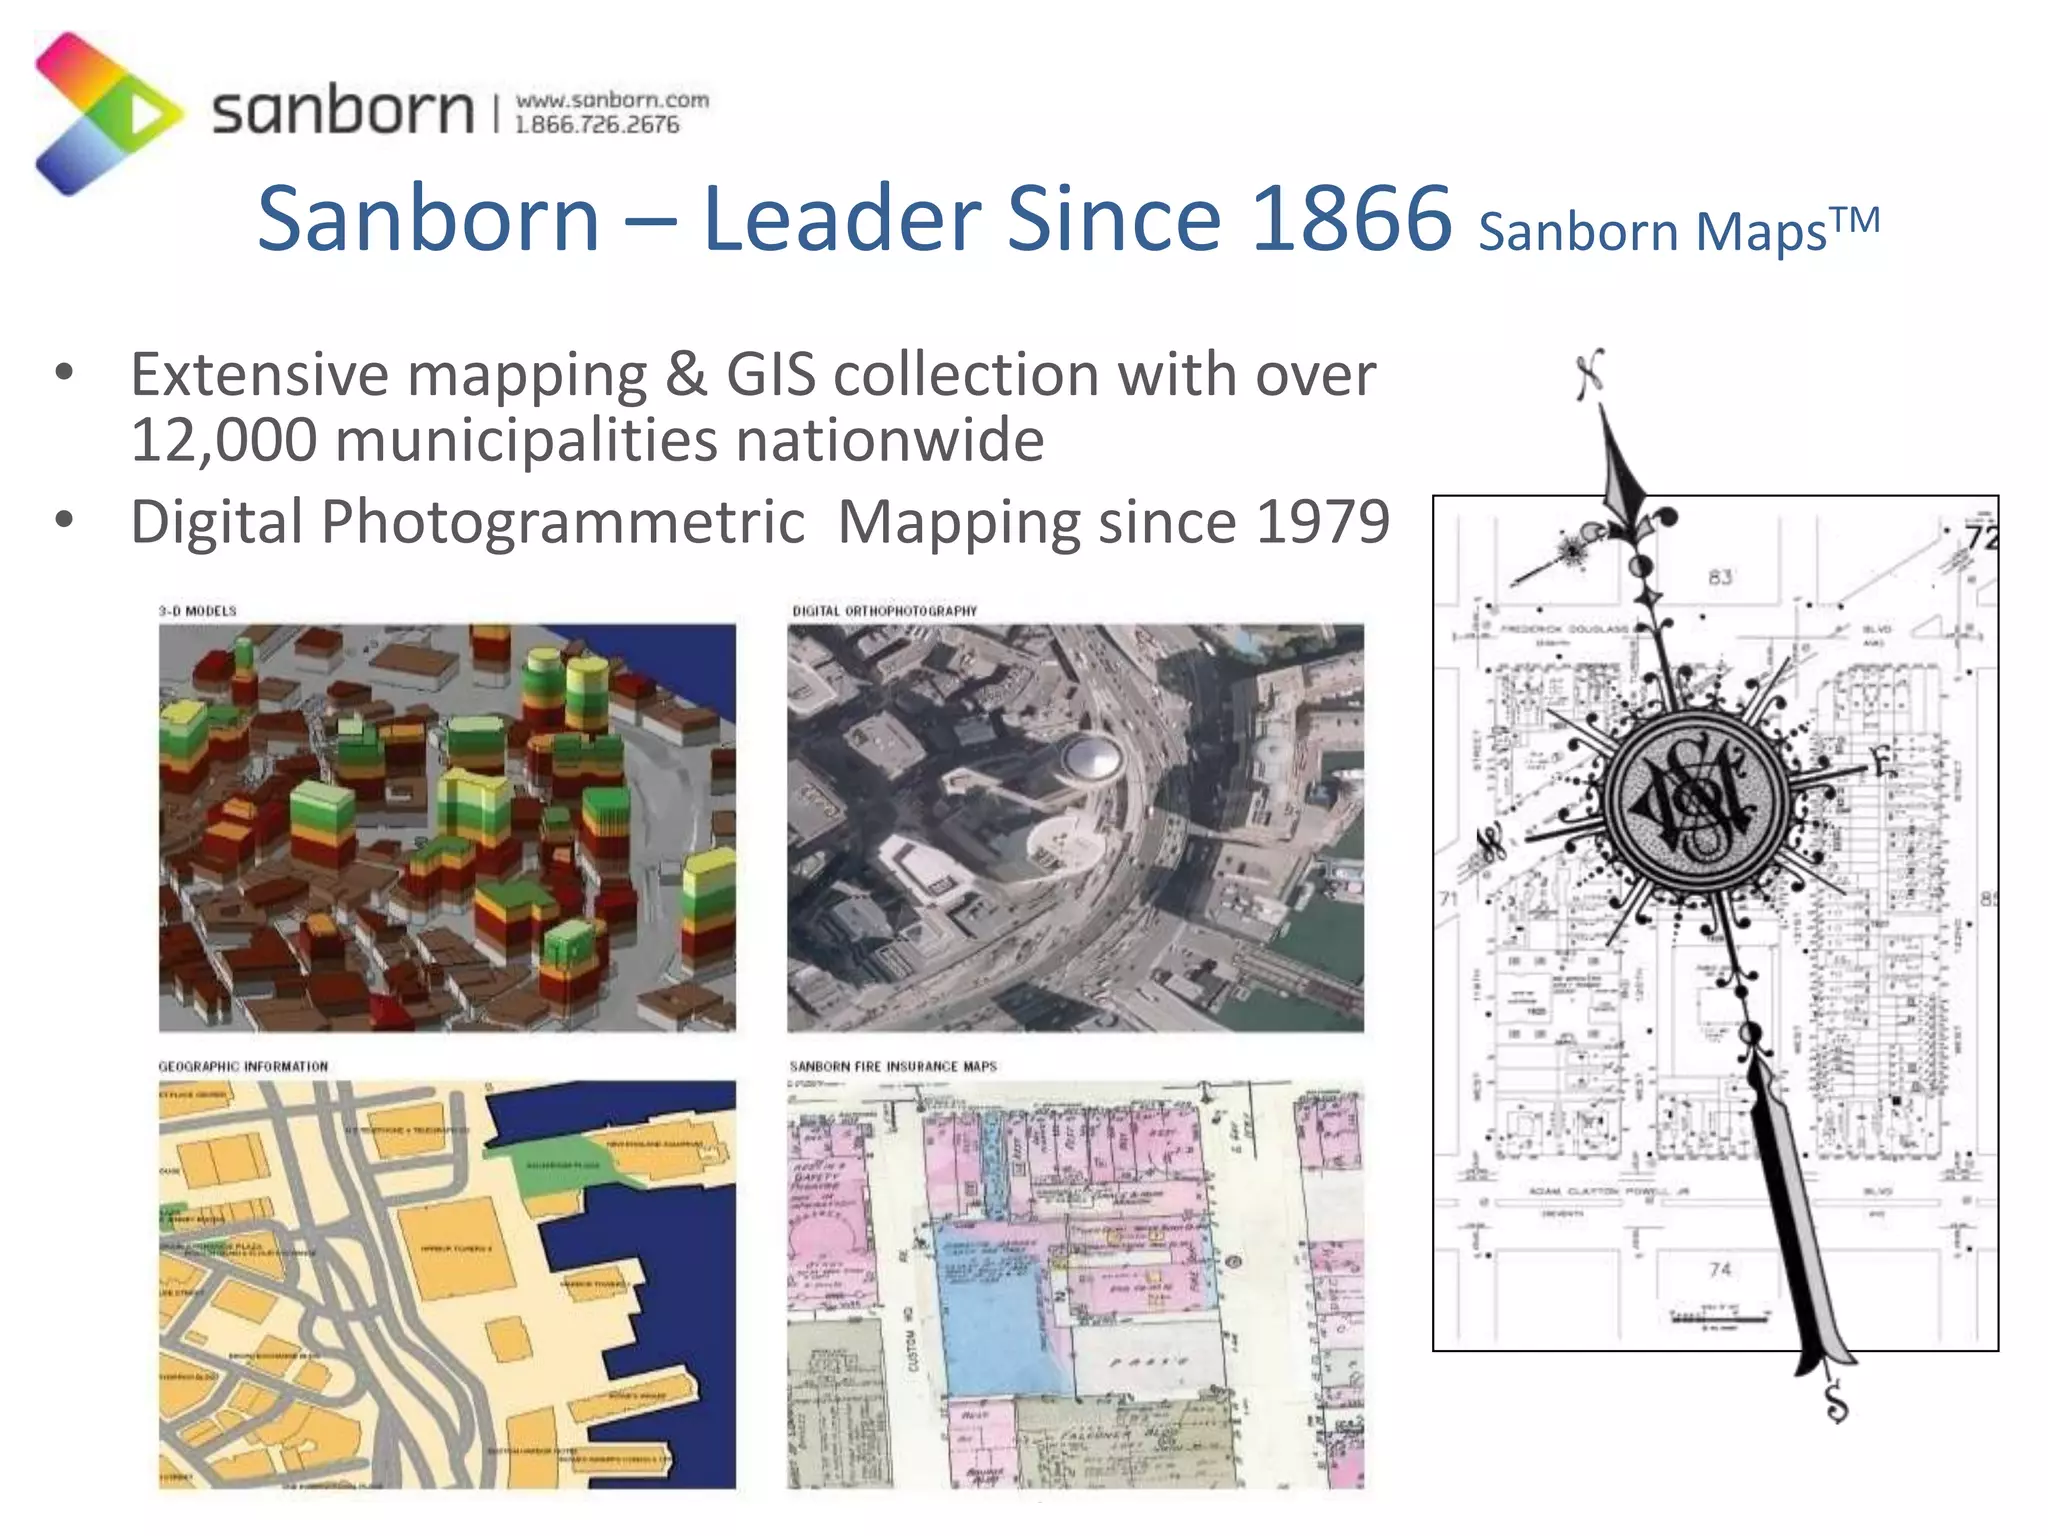
Community Sustainability and 
Land Use Policy Development 
through Remote Sensing and 
GIS Based Land Cover Mapping 
Presented by: 
Jason Caldwell 
Vice President of Business Development and Sales 
Date: September 24th, 2014
Agenda 
• Sanborn Overview 
• How do we define community sustainability 
• What is Land Use, What is Land Cover 
• How does GIS and Remote Sensing support land use 
policy, what are the applications 
• What data source support land cover mapping 
• Land Cover map types and applications 
– Basic land cover maps and applications 
• Impervious, level 1, 2, 3 
– Specific land cover maps 
• Irrigated 
• Green infrastructure 
• Wild Fire 
9/29/2014 ©2014, The Sanborn Map Company, Inc. 2
Sanborn – Leader Since 1866 Sanborn MapsTM 
• Extensive mapping & GIS collection with over 
12,000 municipalities nationwide 
• Digital Photogrammetric Mapping since 1979 
3
Company Overview 
• Sanborn is an industry leader in terms of acquisition 
resources and data processing throughput, assets included: 
– Aircraft (12) 
– UltraCam Eagle Digital (3) 
– UltraCamD (2) 
– Integraph Z/I (4) 
– 5-way oblique system (4) 
– Airborne GPS systems (7) 
– Inertial Navigation Systems (6) 
– Trimble GPS survey equipment 
– IT Infrastructure (over a Petabyte of storage) 
– Over 1,200 distributive processing CPUs
5 
Decision 
Support 
Visualization 
Systems 
Software Applications 
Value Added Services 
(Base Map Analysis) 
Data and Map Production 
Comprehensive Solutions 
• Decision Support Systems 
– Wildfire Management 
– Forestry and Ecosystem Management 
– Emergency Response 
• Visualization Systems 
– 2D 
– 3D 
– Prism 4D, Common Operating Picture 
• Software Applications 
– GIS Software Development 
(Enterprise/Desktop/Web) 
– Portals and Distribution Tools 
• Value-Added Services 
– Land use and land cover analyses 
– Change detection 
– Other imagery analysis services 
• Mapping & Remote-Sensed Services 
– LiDAR, Digital Orthoimagery, 
Photogrammetric, Topographical Maps
Airborne LiDAR 
USGS QL1 SAMPLE
Orthoimagery
Oblique Imagery
Planimetrics
3D Data
Ecological Systems Classification 
Land Cover Mapping 
11
What is Community Sustainability? 
“Sustainable development is development that meets the needs of 
the present without compromising the ability of future generation 
to meet their own needs.” 
Land Use Planning Should support sustainability 
Brundtland Commission of the UN 3/20/87
13 
Land Cover vs. Land Use 
• Land cover 
– The physical state of the landscape 
– i.e. water, bare soil, grass, impervious surface 
• Land use 
– How the land is used 
– High density residential, golf course, pasture 
• All communities understand land use 
• A few but increasing number of communities understand 
land cover 
• Land cover is a complementary dataset to land use 
• Most communities with a digital parcel base have the 
land use attribute as part of their database, the rarely 
know the land cover on that parcel.
Land Cover Mapping 
14 
• Understanding current landcover and how 
it is being used, along with an accurate 
means of monitoring change over time, is 
vital to anyone responsible for land use 
management. 
• Measuring current conditions and how 
they are changing can be easily achieved 
through land cover mapping, a process 
that quantifies current land resources into 
a series of thematic categories 
Vegetation Mapping 
Landcover Mapping
Land Use 
– Policy can be supported 
based on land cover 
– Need to work through 
decision rules about when 
one land use changes to 
another 
– Made easier if digital 
parcel map available 
– Similar but not the same 
as hand delineated land 
use maps
How Can GIS and Remote Sensing based Land Cover 
Mapping Help Our Communities Be Sustainable? 
By Supporting Land Use Policy for: 
– Water Shed Delineation/Environmental protection, Water 
quality protection 
– Green Infrastructure 
– Habitat Analysis and Management 
– Impervious surfaces 
– Irrigated vs. non-irrigated 
– Wildfire Risk 
– Wetlands Mapping 
– Agricultural production 
– Forest production 
– Recreation
Landcover Classification 
Multi-Spectral imagery assists with the creation of 
thematic maps showing land cover. 
17
What is Multi-Spectral Imagery? 
• Imagery acquired with a sensor 
that is also sensitive to 
electromagnetic energy outside of 
the visible light spectrum – usually 
near-infrared. 
• Can be displayed in a variety of 
band combinations to emphasize 
desired features. 
• Shows reflected energy (from 
sunlight), not emitted energy. 
Graphic courtesy 
Lumenistics.com
Why is Multi-Spectral Imagery Useful? 
19 
• Many physical objects reflect infrared energy much 
differently than visible light. 
• This makes new forms of analysis possible, and others much 
more efficient, particularly when it comes to process 
automation. 
• Infrared energy is very sensitive to the chlorophyll in 
vegetation, so imagery can be used for a variety of unique 
applications involving vegetation. 
Credit Jolyn Keck, Utah State 
University 
Credit Jolyn Keck, Utah State 
University
Vegetation Classification 
Unique spectral signatures in the NIR band allow differentiation of invasive 
species, different types of beneficial plants 
20 
Credit North Credit D. Lichaa El- Dakota State University 
Khoury, AUB
Imagery Inputs for Various Scales 
Low Resolution 
National/State level 
mapping 
Medium Resolution 
NOAA, State/Regional 
Mapping, Multi-county 
regions 
High Resolution 
Land cover, canopy, 
green infrastructure, 
land use & impervious 
Sensor/Resolution 
Classification 
TM/ETM 30 m pixel 
$ 
SPOT/DG/IRS 5m 
$$ 
Airborne camera 1 m 
$$$ 
Low Resolution Medium Resolution High Resolution
22 
Imagery Collection Parameters 
• Need to make sure imagery is suitable for land 
cover mapping which will relate to season 
– Impervious maps best produced from leaf off imagery 
– Wetland maps best produced from spring green up imagery 
– Forest type maps are best produced from early senescent fall 
imagery 
– Agricultural type maps are best produced using growing season 
imagery
General Land Cover Maps 
23 
Impervious Level 1 Level 2 Level 3 
Impervious Impervious Impervious Paved Surfaces 
Building 
Other Impervious 
Pervious Woody Deciduous Upland 
Lowland 
Coniferous Upland 
Lowland 
Shrub Upland 
Lowland 
Non woody Vegetation Grassland Urban Grassland 
Emergent Wetland 
Other grassland 
Cropland Cropland 
Water Lake Lake 
River River 
Pond Pond 
Barren Natural Natural 
Man Made Man made
Impervious vs. Pervious Surface 
• Impervious surfaces generate runoff that can create 
costly problems for both residents living in a community 
and the surrounding environment. 
• Better information regarding current and projected 
changes is increasingly important. 
• Mitigating impacts of urbanization on water resources 
requires location and extent of impervious surface 
• Impervious surfaces is important for a variety of 
applications including stormwater applications for fee 
charges, stormwater runoff, infrastructure design, and 
watershed health and modeling 
24
Storm Water Utility and Fee Management Using 
Impervious Data 
Cities can revamp their Storm Water Utility 
Rate Structure using Google Imagery and 
Sanborn’s Premium Impervious Data 
25 
Stormwater Needs 
Assessment & 
Rate Structure 
Development 
Ordinance for 
New Rate 
Structure 
Public Info 
Review & 
Adjustment 
Billing 
& 
Collection 
Update 
& 
Maintenance
 Impervious area: 10,549 sq ft 
 Parcel area: 25,118 sq ft 
 Current Rate Structure: $22.75/quarter 
 User fee based on Impervious amount: 
$58.72/quarter
27 
Land Cover 
• Level 1 Land Cover 
– Provide information on the cover for parcels 
– Use for environmental assessments 
– Use for stormwater planning
28 
Land Cover 
• Level 2 land cover 
– Use for tree canopy monitoring 
– Use for development monitoring 
– Use for land use planning
Land Cover 
• Level 3 Land Cover 
– Use for ecological inventories 
– Use for wetland mapping 
– Use for stormwater and pollution modeling
Why Map Vegetation? 
• Vegetation makes a big difference 
– Allows infiltration of water to soil 
– Stores and evaporates water during a rain storm 
(transpiration and interception) 
– Filters air and water pollution 
– Impacts microclimate (cooling houses in summer, 
warming houses in winter) 
– Enhances quality of life 
– Supports urban wildlife 
– Provides recreational opportunities 
– Forestry resources 
– Agricultural and forest health 
– Agricultural crop damage and compliance 
– Provides input for wildfire fuels modeling 
Tree Effects on Runoff 
Time 
Runoff Volume 
Hydrograph 
Decrease total runoff volume 
less trees 
more trees
31 
Irrigated Lands Mapping 
• In many states water use is an issue 
– One large water consumer is for irrigation 
– Monitoring and managing irrigation water is a required best 
management practice for certain areas
Vegetation/Crop Health 
Identification of water deficiency or surplus, nutrient deficiencies, diseases, 
insect/weed infestation, pollutant damage, wind/hail/flood/fire damage, 
yield estimation 
32 
Imagery Credit 
NASA
USDA Farm Service Agency 
Subsidy and Insurance Monitoring 
NAIP Program is well-known example 
33
Green vs. Grey Infrastructure 
• Grey infrastructure are the hard surfaces that are built 
• Green infrastructure are the soft surfaces that can offset the 
impact of the hard surfaces 
• Stormwater runoff relates to the amount of water not 
infiltrating the ground after a rain event 
– Impervious (grey infrastructure) 
– Permeability of other land surfaces (green infrastructure) 
• Non-point source pollution depends on the surfaces over 
which the runoff runs 
– Type of surface 
– Pollution load of that surface 
• Relates to land cover type and how it is used
Green Infrastructure 
• Modeling software calculates the impact of trees and green space on 
– Storm water 
– Water pollution 
– Atmospheric pollution 
• Modeling presents results in terms of dollars based on research 
into externality costs 
– These are figures that many people can relate to: decision makers, the 
general public 
• A Green Infrastructure classification provides the base layer for this 
program. 
– The more detail present in the classification in terms of land cover, 
overstory, and understory, the more accurate the classification will be 
– The added detail enables the software to calculate more precise runoff 
curve numbers
CITYgreen© inputs and models 
• The Air Pollution Removal program is based on research conducted by David Nowak, 
Ph.D., of the USDA Forest Service. Dr. Nowak developed a methodology to assess the air 
pollution removal capacity of urban forests with respect to pollutants such as nitrogen 
dioxide (NO2), sulfur dioxide (SO2), ozone (O3), carbon monoxide (CO), and particulate 
matter less than 10 microns (PM10). Pollution removal is reported on an annual basis in 
pounds and U.S. dollars. 
– F (g/cm2/sec) = Vd(cm/sec) x C (g/cm3) 
– Nowak, D.J. and Crane, D.E. 2000. The Urban Forest Effects (UFORE) Model: quantifying urban 
forest structure and functions. In M. Hansen and T. Burk, eds. Proceedings: Integrated tools for 
natural resources inventories in the 21st century. IUFRO Conference, 16-20 August 1998, Boise, 
ID; General Technical Report NC-212, U.S. Department of Agriculture, Forest Service, North 
Central Research Station, St. Paul, MN. pp. 714-720. 
• Carbon Storage and Sequestration 
• Storage - Study area (acres) x Percent tree cover x Carbon Storage Multiplier = Carbon 
Storage Capacity 
• Sequestration - Study area (acres) x Percent tree cover x Carbon Sequestration Multiplier = 
Carbon Sequestration Annual Rate 
– Nowak, David and Rowan A. Rowntree. “Quantifying the Role of Urban Forests in Removing 
Atmospheric Carbon Dioxide.” Journal of Arboriculture, 17 (10): 269 (October 1, 1991).
Land Structure + Ecological Analysis Model = Decision Support Material 
Ann Arbor 
Air Pollution 
Rainfall 
Soils 
Landcover 
Bottom Line 
Ecosystem Analysis Model
39 
Wildfire Risk Assessment 
• Over the past 2 decades the number of 
acres burned by wildland fire has steadily 
risen 
– Past management practices, including a 
concerted federal policy of suppression, has 
unintentionally led to a steady accumulation of 
dense fuels across the U.S. 
– This fuels buildup has resulted in several years of 
catastrophic wildfires that has cost lives and 
significant damage to property and the 
ecosystems in the Wildland Urban Interface 
• 1990 to present 
– Massive shift in available monetary resources in 
response to catastrophic wildland fire seasons
Wildfire Fuels Mapping 
• Advanced image classification techniques are used in 
combination with field surveys to develop a fuel model 
classification scheme 
• Supports the 13 FBPS fuel models, or the newly 
developed Scott/Burgen 40 fuel models CIR Imagery 
40 
Surface Fuels
Prevention and Risk Mitigation 
41
Questions 
Jason Caldwell 
Vice President of Business Development and Sales 
719-264-5547 
jcaldwell@sanborn.com 
9/29/2014 ©2014, The Sanborn Map Company, Inc. 42

Caldwell community sustainability and land use policy

  • 1.
    Community Sustainability and Land Use Policy Development through Remote Sensing and GIS Based Land Cover Mapping Presented by: Jason Caldwell Vice President of Business Development and Sales Date: September 24th, 2014
  • 2.
    Agenda • SanbornOverview • How do we define community sustainability • What is Land Use, What is Land Cover • How does GIS and Remote Sensing support land use policy, what are the applications • What data source support land cover mapping • Land Cover map types and applications – Basic land cover maps and applications • Impervious, level 1, 2, 3 – Specific land cover maps • Irrigated • Green infrastructure • Wild Fire 9/29/2014 ©2014, The Sanborn Map Company, Inc. 2
  • 3.
    Sanborn – LeaderSince 1866 Sanborn MapsTM • Extensive mapping & GIS collection with over 12,000 municipalities nationwide • Digital Photogrammetric Mapping since 1979 3
  • 4.
    Company Overview •Sanborn is an industry leader in terms of acquisition resources and data processing throughput, assets included: – Aircraft (12) – UltraCam Eagle Digital (3) – UltraCamD (2) – Integraph Z/I (4) – 5-way oblique system (4) – Airborne GPS systems (7) – Inertial Navigation Systems (6) – Trimble GPS survey equipment – IT Infrastructure (over a Petabyte of storage) – Over 1,200 distributive processing CPUs
  • 5.
    5 Decision Support Visualization Systems Software Applications Value Added Services (Base Map Analysis) Data and Map Production Comprehensive Solutions • Decision Support Systems – Wildfire Management – Forestry and Ecosystem Management – Emergency Response • Visualization Systems – 2D – 3D – Prism 4D, Common Operating Picture • Software Applications – GIS Software Development (Enterprise/Desktop/Web) – Portals and Distribution Tools • Value-Added Services – Land use and land cover analyses – Change detection – Other imagery analysis services • Mapping & Remote-Sensed Services – LiDAR, Digital Orthoimagery, Photogrammetric, Topographical Maps
  • 6.
  • 7.
  • 8.
  • 9.
  • 10.
  • 11.
    Ecological Systems Classification Land Cover Mapping 11
  • 12.
    What is CommunitySustainability? “Sustainable development is development that meets the needs of the present without compromising the ability of future generation to meet their own needs.” Land Use Planning Should support sustainability Brundtland Commission of the UN 3/20/87
  • 13.
    13 Land Covervs. Land Use • Land cover – The physical state of the landscape – i.e. water, bare soil, grass, impervious surface • Land use – How the land is used – High density residential, golf course, pasture • All communities understand land use • A few but increasing number of communities understand land cover • Land cover is a complementary dataset to land use • Most communities with a digital parcel base have the land use attribute as part of their database, the rarely know the land cover on that parcel.
  • 14.
    Land Cover Mapping 14 • Understanding current landcover and how it is being used, along with an accurate means of monitoring change over time, is vital to anyone responsible for land use management. • Measuring current conditions and how they are changing can be easily achieved through land cover mapping, a process that quantifies current land resources into a series of thematic categories Vegetation Mapping Landcover Mapping
  • 15.
    Land Use –Policy can be supported based on land cover – Need to work through decision rules about when one land use changes to another – Made easier if digital parcel map available – Similar but not the same as hand delineated land use maps
  • 16.
    How Can GISand Remote Sensing based Land Cover Mapping Help Our Communities Be Sustainable? By Supporting Land Use Policy for: – Water Shed Delineation/Environmental protection, Water quality protection – Green Infrastructure – Habitat Analysis and Management – Impervious surfaces – Irrigated vs. non-irrigated – Wildfire Risk – Wetlands Mapping – Agricultural production – Forest production – Recreation
  • 17.
    Landcover Classification Multi-Spectralimagery assists with the creation of thematic maps showing land cover. 17
  • 18.
    What is Multi-SpectralImagery? • Imagery acquired with a sensor that is also sensitive to electromagnetic energy outside of the visible light spectrum – usually near-infrared. • Can be displayed in a variety of band combinations to emphasize desired features. • Shows reflected energy (from sunlight), not emitted energy. Graphic courtesy Lumenistics.com
  • 19.
    Why is Multi-SpectralImagery Useful? 19 • Many physical objects reflect infrared energy much differently than visible light. • This makes new forms of analysis possible, and others much more efficient, particularly when it comes to process automation. • Infrared energy is very sensitive to the chlorophyll in vegetation, so imagery can be used for a variety of unique applications involving vegetation. Credit Jolyn Keck, Utah State University Credit Jolyn Keck, Utah State University
  • 20.
    Vegetation Classification Uniquespectral signatures in the NIR band allow differentiation of invasive species, different types of beneficial plants 20 Credit North Credit D. Lichaa El- Dakota State University Khoury, AUB
  • 21.
    Imagery Inputs forVarious Scales Low Resolution National/State level mapping Medium Resolution NOAA, State/Regional Mapping, Multi-county regions High Resolution Land cover, canopy, green infrastructure, land use & impervious Sensor/Resolution Classification TM/ETM 30 m pixel $ SPOT/DG/IRS 5m $$ Airborne camera 1 m $$$ Low Resolution Medium Resolution High Resolution
  • 22.
    22 Imagery CollectionParameters • Need to make sure imagery is suitable for land cover mapping which will relate to season – Impervious maps best produced from leaf off imagery – Wetland maps best produced from spring green up imagery – Forest type maps are best produced from early senescent fall imagery – Agricultural type maps are best produced using growing season imagery
  • 23.
    General Land CoverMaps 23 Impervious Level 1 Level 2 Level 3 Impervious Impervious Impervious Paved Surfaces Building Other Impervious Pervious Woody Deciduous Upland Lowland Coniferous Upland Lowland Shrub Upland Lowland Non woody Vegetation Grassland Urban Grassland Emergent Wetland Other grassland Cropland Cropland Water Lake Lake River River Pond Pond Barren Natural Natural Man Made Man made
  • 24.
    Impervious vs. PerviousSurface • Impervious surfaces generate runoff that can create costly problems for both residents living in a community and the surrounding environment. • Better information regarding current and projected changes is increasingly important. • Mitigating impacts of urbanization on water resources requires location and extent of impervious surface • Impervious surfaces is important for a variety of applications including stormwater applications for fee charges, stormwater runoff, infrastructure design, and watershed health and modeling 24
  • 25.
    Storm Water Utilityand Fee Management Using Impervious Data Cities can revamp their Storm Water Utility Rate Structure using Google Imagery and Sanborn’s Premium Impervious Data 25 Stormwater Needs Assessment & Rate Structure Development Ordinance for New Rate Structure Public Info Review & Adjustment Billing & Collection Update & Maintenance
  • 26.
     Impervious area:10,549 sq ft  Parcel area: 25,118 sq ft  Current Rate Structure: $22.75/quarter  User fee based on Impervious amount: $58.72/quarter
  • 27.
    27 Land Cover • Level 1 Land Cover – Provide information on the cover for parcels – Use for environmental assessments – Use for stormwater planning
  • 28.
    28 Land Cover • Level 2 land cover – Use for tree canopy monitoring – Use for development monitoring – Use for land use planning
  • 29.
    Land Cover •Level 3 Land Cover – Use for ecological inventories – Use for wetland mapping – Use for stormwater and pollution modeling
  • 30.
    Why Map Vegetation? • Vegetation makes a big difference – Allows infiltration of water to soil – Stores and evaporates water during a rain storm (transpiration and interception) – Filters air and water pollution – Impacts microclimate (cooling houses in summer, warming houses in winter) – Enhances quality of life – Supports urban wildlife – Provides recreational opportunities – Forestry resources – Agricultural and forest health – Agricultural crop damage and compliance – Provides input for wildfire fuels modeling Tree Effects on Runoff Time Runoff Volume Hydrograph Decrease total runoff volume less trees more trees
  • 31.
    31 Irrigated LandsMapping • In many states water use is an issue – One large water consumer is for irrigation – Monitoring and managing irrigation water is a required best management practice for certain areas
  • 32.
    Vegetation/Crop Health Identificationof water deficiency or surplus, nutrient deficiencies, diseases, insect/weed infestation, pollutant damage, wind/hail/flood/fire damage, yield estimation 32 Imagery Credit NASA
  • 33.
    USDA Farm ServiceAgency Subsidy and Insurance Monitoring NAIP Program is well-known example 33
  • 34.
    Green vs. GreyInfrastructure • Grey infrastructure are the hard surfaces that are built • Green infrastructure are the soft surfaces that can offset the impact of the hard surfaces • Stormwater runoff relates to the amount of water not infiltrating the ground after a rain event – Impervious (grey infrastructure) – Permeability of other land surfaces (green infrastructure) • Non-point source pollution depends on the surfaces over which the runoff runs – Type of surface – Pollution load of that surface • Relates to land cover type and how it is used
  • 35.
    Green Infrastructure •Modeling software calculates the impact of trees and green space on – Storm water – Water pollution – Atmospheric pollution • Modeling presents results in terms of dollars based on research into externality costs – These are figures that many people can relate to: decision makers, the general public • A Green Infrastructure classification provides the base layer for this program. – The more detail present in the classification in terms of land cover, overstory, and understory, the more accurate the classification will be – The added detail enables the software to calculate more precise runoff curve numbers
  • 36.
    CITYgreen© inputs andmodels • The Air Pollution Removal program is based on research conducted by David Nowak, Ph.D., of the USDA Forest Service. Dr. Nowak developed a methodology to assess the air pollution removal capacity of urban forests with respect to pollutants such as nitrogen dioxide (NO2), sulfur dioxide (SO2), ozone (O3), carbon monoxide (CO), and particulate matter less than 10 microns (PM10). Pollution removal is reported on an annual basis in pounds and U.S. dollars. – F (g/cm2/sec) = Vd(cm/sec) x C (g/cm3) – Nowak, D.J. and Crane, D.E. 2000. The Urban Forest Effects (UFORE) Model: quantifying urban forest structure and functions. In M. Hansen and T. Burk, eds. Proceedings: Integrated tools for natural resources inventories in the 21st century. IUFRO Conference, 16-20 August 1998, Boise, ID; General Technical Report NC-212, U.S. Department of Agriculture, Forest Service, North Central Research Station, St. Paul, MN. pp. 714-720. • Carbon Storage and Sequestration • Storage - Study area (acres) x Percent tree cover x Carbon Storage Multiplier = Carbon Storage Capacity • Sequestration - Study area (acres) x Percent tree cover x Carbon Sequestration Multiplier = Carbon Sequestration Annual Rate – Nowak, David and Rowan A. Rowntree. “Quantifying the Role of Urban Forests in Removing Atmospheric Carbon Dioxide.” Journal of Arboriculture, 17 (10): 269 (October 1, 1991).
  • 37.
    Land Structure +Ecological Analysis Model = Decision Support Material Ann Arbor Air Pollution Rainfall Soils Landcover Bottom Line Ecosystem Analysis Model
  • 39.
    39 Wildfire RiskAssessment • Over the past 2 decades the number of acres burned by wildland fire has steadily risen – Past management practices, including a concerted federal policy of suppression, has unintentionally led to a steady accumulation of dense fuels across the U.S. – This fuels buildup has resulted in several years of catastrophic wildfires that has cost lives and significant damage to property and the ecosystems in the Wildland Urban Interface • 1990 to present – Massive shift in available monetary resources in response to catastrophic wildland fire seasons
  • 40.
    Wildfire Fuels Mapping • Advanced image classification techniques are used in combination with field surveys to develop a fuel model classification scheme • Supports the 13 FBPS fuel models, or the newly developed Scott/Burgen 40 fuel models CIR Imagery 40 Surface Fuels
  • 41.
    Prevention and RiskMitigation 41
  • 42.
    Questions Jason Caldwell Vice President of Business Development and Sales 719-264-5547 jcaldwell@sanborn.com 9/29/2014 ©2014, The Sanborn Map Company, Inc. 42