Downloaded 184 times
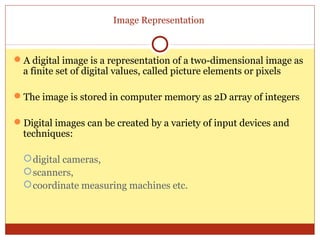
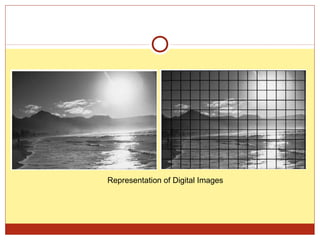
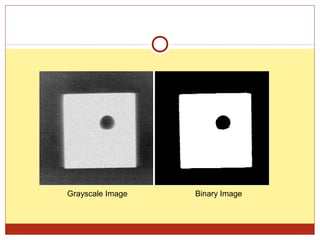
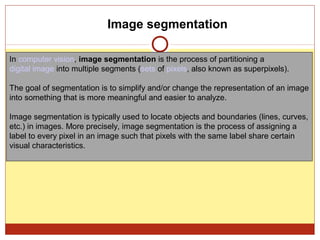
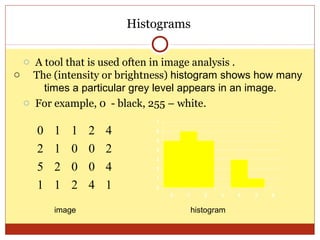
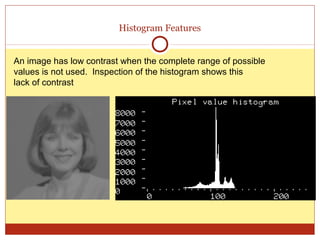
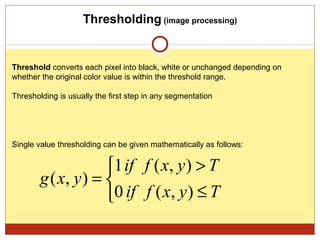
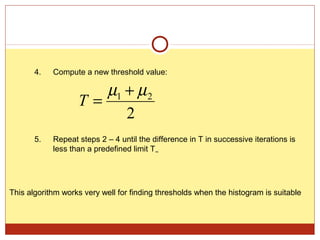
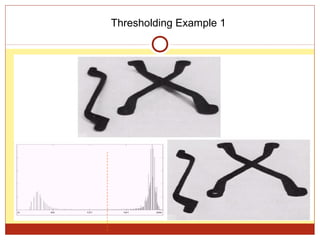
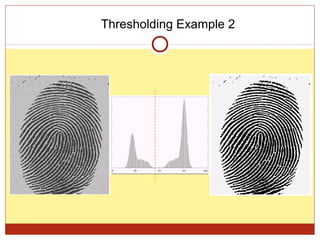
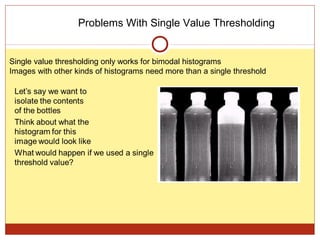


The document discusses digital image representation and processing. It covers: 1) How digital images are represented as 2D arrays of integer pixel values stored in computer memory. 2) The main types of digital images - binary, grayscale, and true color images - based on the number of possible values per pixel. 3) Common image processing techniques like segmentation, thresholding, and histograms that analyze and modify digital images. 4) Thresholding converts pixels to black/white based on a threshold and is often used in segmentation. Histograms show pixel value distributions to aid analysis.