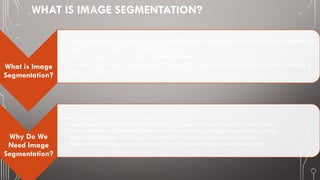
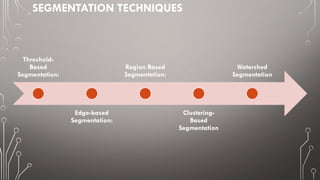
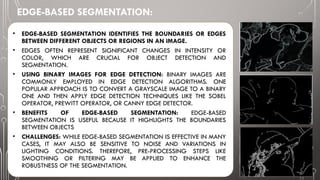
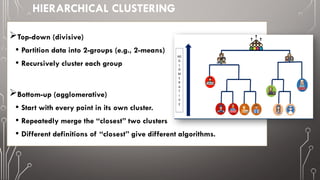
The document discusses image segmentation, defining it as the process of partitioning a digital image into multiple segments for easier analysis. It explains various techniques such as threshold-based, edge-based, region-based, and clustering-based segmentation, detailing their applications and methodologies. The document highlights the importance of image segmentation in object detection, feature extraction, and machine learning, as well as specific techniques like k-means clustering and mean-shift segmentation.


![• The process usually begins with analyzing the histogram of the
image, which represents the distribution of pixel intensities.
[1] Image Intensity Histogram:
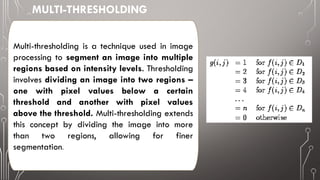
• Multiple threshold values are selected based on the characteristics
of the histogram. These thresholds divide the intensity range into
several intervals.
[2] Threshold Selection:
• Pixels in the image are then assigned to different segments or
regions based on their intensity values and the selected thresholds.
• For each interval defined by the thresholds, a separate segment is
created. Pixels falling within each interval are grouped together.
[3] Segmentation:
• The segmented regions can be visualized using different colors or
grayscale levels, making it easier to identify distinct features in the
image.(لتميزه منفصل بلون قطاع كل )تلوين
[4] Region Visualization:
• Multi-thresholding is commonly used in applications where a more
detailed segmentation of an image is required. This can include
medical image analysis, object recognition, and other computer
vision tasks.
Applications:](https://image.slidesharecdn.com/segmentationtechniquessummarized-240903124626-423b99bb/85/SEGMENTATION-TECHNIQUES__-summarized-PPTX-8-320.jpg)


![[4] - [2] The SIFT Algorithm Unlocking Image Recognition.pptx](https://cdn.slidesharecdn.com/ss_thumbnails/4-2thesiftalgorithmunlockingimagerecognition-240720074301-91a1d13c-thumbnail.jpg?width=640&height=640&fit=bounds)


![[5] Understanding the YOLOv8 Architecture.pptx](https://cdn.slidesharecdn.com/ss_thumbnails/5understandingtheyolov8architecture-240724131844-70710c0c-thumbnail.jpg?width=640&height=640&fit=bounds)


![[4] - [1] The SIFT Algorithm and Its Formulas.pptx](https://cdn.slidesharecdn.com/ss_thumbnails/4-1thesiftalgorithmanditsformulas-240720073609-35dd0056-thumbnail.jpg?width=640&height=640&fit=bounds)

![[7] The SiLU Activation Function Unlocking Neural Network Potential.pptx](https://cdn.slidesharecdn.com/ss_thumbnails/7thesiluactivationfunctionunlockingneuralnetworkpotential-240828102029-8df6451c-thumbnail.jpg?width=640&height=640&fit=bounds)


