Download to read offline

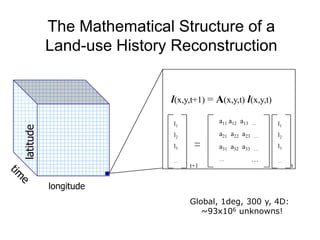
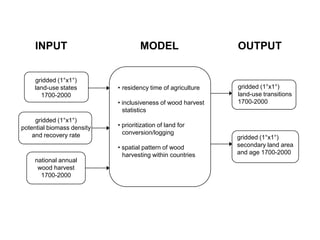
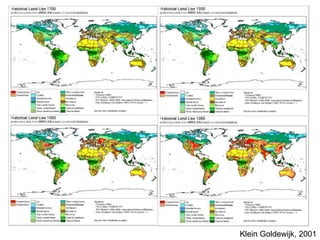
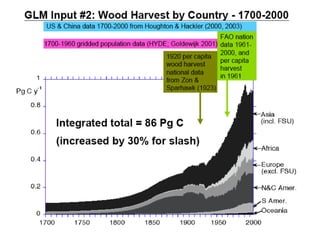
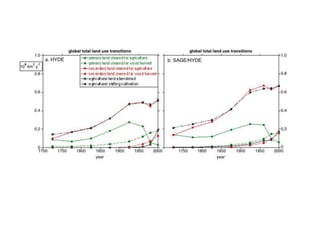
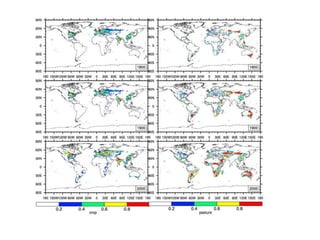
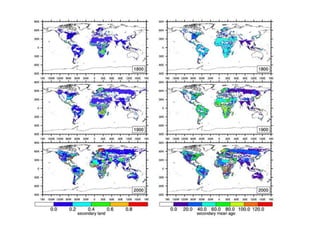
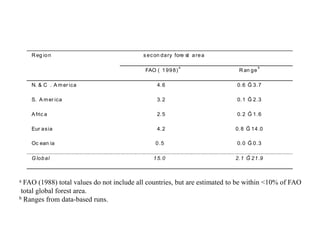
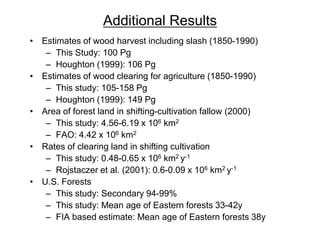
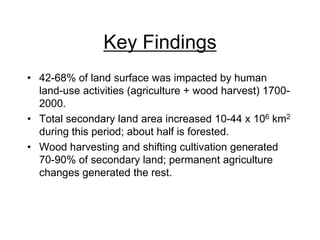


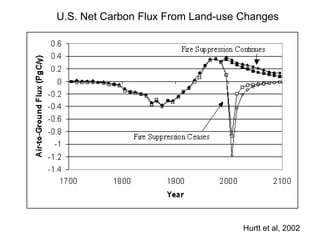
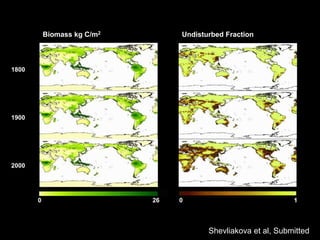
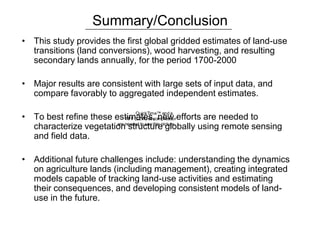

This document summarizes a study that reconstructed global patterns of land use change from 1700-2000 at a 1 degree resolution. The study estimated land conversions, wood harvesting, and resulting secondary lands annually. Key results found that 42-68% of the global land surface was impacted by human land use activities during this period. Total secondary lands increased by 10-44 million km^2, around half of which was forested. The study provides the first global gridded estimates of its kind, and results were generally consistent with other data sources. Remaining challenges include better understanding agriculture land dynamics and developing integrated models to estimate future land use change impacts.


![Soil ppt[1][1]](https://cdn.slidesharecdn.com/ss_thumbnails/soilppt11-140505103549-phpapp01-thumbnail.jpg?width=640&height=640&fit=bounds)


