Downloaded 71 times


![53
AddressingsoildegradationinEUagriculture:relevantprocesses,practicesandpolicies
their cultivation. They are usually too wet and
thus too fragile for the use of heavy machinery.
As mentioned in section 2.2, soil structure
is improved by soil organic carbon (SOC).
Susceptibility to compaction may be reduced (all
other factors remaining the same) by an increased
SOC content. A higher SOC content improves
soil structure, and thereby helps to reduce the
susceptibility to compaction. If less compaction
occurs, the degradation processes that are
induced or accelerated by compaction (such as
erosion and landslides) will be reduced as well.
In order to perform more in-depth research
on hotspots (i.e. soils with a high or very high
natural susceptibility to compaction), further
ground validation is needed to verify the results
obtained by pedotransfer rules. The evaluation of
man-induced susceptibility to compaction is a
sensitive issue and will need a lot more detailed
data before an attempt can be made to visualise
this issue.
2.4 Salinisation and sodification
Salt is a natural element of soils and water.
Salt-affected soils result from the accumulation
of excess salts. Saline and alkaline soils are soils
with a high salt (or salt ion) content. Processes
causing the formation of salt-affected soils can be
characterised as salinisation and sodification.
Salinisation
Salinisation is the process that leads to
an excessive increase of water-soluble salts
in the soil. The accumulated salts include
sodium, potassium, magnesium and calcium,
chloride, sulphate, carbonate and bicarbonate
(mainly sodium chloride and sodium sulphate).
A distinction can be made between primary
and secondary salinisation processes. Primary
salinisation involves salt accumulation through
natural processes due to a high salt content of
the parent material or in groundwater. Secondary
salinisation is caused by human interventions
such as inappropriate irrigation practices, e.g.
with salt-rich irrigation water and/or insufficient
drainage.
Sodification
Sodification is the process by which the
exchangeable sodium (Na) content of the soil is
increased. [Na+
] accumulates in the solid and/or
liquid phases of the soil as crystallised NaHCO3
or Na2
CO3
salts (salt ‘effloresces’), as ions in the
highly alkaline soil solution (alkalisation), or as
exchangeable ions in the soil absorption complex
(ESP).
High levels of salinity in soils provoke the
withering of plants both due to the increase of
osmotic pressure and the toxic effects of salts.
When alkalinity processes take place, the high
pH level does not, in most cases, permit plant life.
Excess sodium on the exchange complex results
in the destruction of the soil structure that, due
to the lack of oxygen, cannot sustain either plant
growth or animal life. Alkaline soils are easily
eroded by water and wind. Salinisation increases
the impermeability of deep soil layers, making it
impossible to use the land for cultivation (Van-
Camp et al., 2004).
The types of salt-affected soils differ both
in physical, chemical, physical-chemical
and biological properties as well as in their
geographical distribution. The degradation risk of
salinisation/sodification reflects the occurrence
and the potential occurrence of the salinisation/
sodification process due to human activities that
adversely affect one or more soil functions.
The main natural factors influencing the
salinity of soils are climate, soil parent material,
land cover and/or vegetation type, topography
and soil attributes. The most influential human-
induced factors are land use, farming systems,
land management and land degradation.
Prevention management practices could include
quality control of irrigation water (water coming](https://image.slidesharecdn.com/jrc50424-140505104012-phpapp01/85/Soil-Degradation-54-320.jpg)


![122
4.Regulatoryenvironmentandpolicyinstruments
became applicable between January 2005 and
January 2007. The new Member States applying
the Single Area Payment Scheme (SAPS) have
been granted a transitional derogation from the
application of these requirements and all (except
Malta and Slovenia) have made use of this
derogation.
The monitoring of statutory management
requirements (SMRs) is a central element of the
cross compliance instrument. Standards need
to be verifiable in order to implement proper
monitoring and enforcement measures. In
principle, two basic monitoring approaches can
be distinguished: direct, on-the-ground checking
of whether or not particular requirements are
satisfied, and the use of indicators reflecting
outputs or results. The relative merits of these
approaches partly depend on the particular
SMR concerned, and which of its aspects is
being evaluated. ‘On the spot measurements
and control is the most efficient way to control
standards in the public, animal and plant health
area; the identification and registration of animals
and the rules on animal welfare differ from most
of the standards relating to the environment. Due
to the complexity of agricultural ecosystems and
the interrelations involved there is often no direct,
easily measurable link between agricultural
practices and environmental qualities. In
particular when it comes to diffuse pollution
issues, cumulative effects or effects that can only
be measured on a landscape level rather than on
a farm level are difficult to measure directly. […]
The success of any kind of control or auditing
system is directly related to how practical the
selected indicators are.’ (Jongeneel et al., 2007,
p. 67). The latter statement not only holds true
for the environmental SMRs but also to a large
extent to the issues and standards set by GAEC. In
addition, the selection of indicators depends on
the availability of reference information.
The extent of compliance with environmental
SMRs covered by cross compliance in selected
European countries, based on 2005 information,
is reported by Jongeneel et al. (2007). On
average, the degree of compliance with the
Birds and Habitats Directives, the protection of
groundwater and compliance with the Sewage
Sludge Directive was found to be high, with
some minor exceptions. In contrast, the rate
of compliance with the Nitrates Directive was
not satisfactory in some of the Member States
analysed. These results have to be interpreted
cautiously, as they depend on expert judgement
and selective observation and are not based on a
complete evaluation.
The effectiveness of SMR enforcement with
respect to soil protection depends on two main
factors. The first is the degree to which a specific
SMR is aimed at reducing soil degradation
processes. This will be discussed in section 4.3.
Second, it depends on how the obligation set out
in the SMR is translated into specific farm-level
requirments, and how well these are understood
by farmers. Although linking compliance with the
SMRs to the receipt of SPS is a powerful tool, the
effectiveness of this tool depends strongly on these
operational characteristics. Member States have
some discretion when translating some elements
of the SMR standards into farm-level restrictions or
guidelines so as to take their own environmental
specificites into account. They are also required
to set up a farm advisory system (FAS) in order to
support cross compliance practices at farm level.
A review of existing farm advisory systems for
cross compliance environmental SMRs, carried
out in 13 Member States18
in the context of the
CIFAS project19
, found that the situation differs
greatly between Member States. Differences
depend partly on budget limitations and lack of
experience and capacity in some Member States.
The report highlights the particular challenge in
18 Czech Republic, Germany, Denmark, Estonia, Spain,
France, Greece, Hungary, Italy, Poland, Sweden,
Slovenia, and the United Kingdom.
19 Cross compliance Indicators in the context of the Farm
Advisory System (CIFAS). European Environmental
Agency: http://cifas.ew.eea.europa.eu/](https://image.slidesharecdn.com/jrc50424-140505104012-phpapp01/85/Soil-Degradation-123-320.jpg)


![165
AddressingsoildegradationinEUagriculture:relevantprocesses,practicesandpolicies
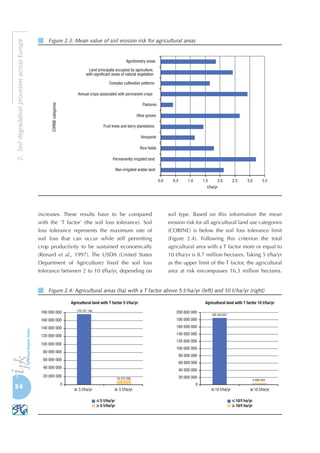
5.1 Classification of soil degradation
processes and soil conservation
practices
In order to synthesise and analyse results
from a large number of diverse sources, SoCo
developed a classification of soil conservation
practices and policy measures that address soil
degradation processes.
The relationships between soil degradation
processes and farming practices are provided
by three consecutive tables summarising the
knowledge reviewed in chapters 2 and 3:
2. the soil characteristics and soil-forming
factors that influence the soil degradation
processes: Table 5.1;
3. the effect (positive, neutral or negative) of
farming practices on soil characteristics:
Table 5.2;
4. the effect (positive, neutral or negative)
of farming practices on soil degradation
5 Summary of soil degradation processes, soil-friendly
farming practices and relevant policy measures
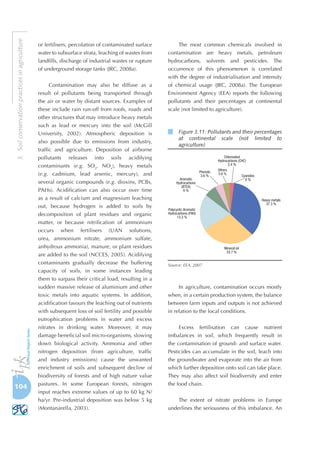
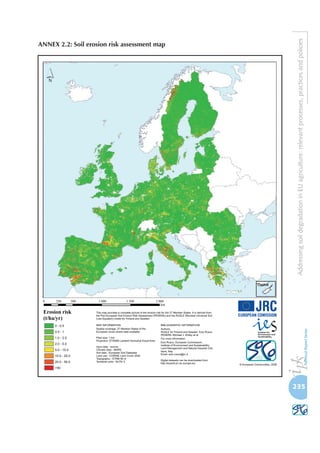
Table 5.1: Summary of soil characteristics and soil-forming factors that determine soil degradation
processes
Soil degradation processes
Watererosion
Winderosion
Tillageerosion
Organiccarbondecline
Compaction
Salinisation/Sodification
Contamination
Soilbiodiversity
decline
Landslidesandfloods
Determiningsoilcharacteristics
Physical
Texture
Porosity
Infiltration rate/capacity
Gas permeability
Aggregate stability (/size)
Moisure content/-holding capacity
Soil temperature
x
x
x
x
x
x
x
[x]
x
x
x
x
[x]
x
x
x
x
x
[x]
x
x
[x]
x
x
x
[x]
x
x
x
[x]
[x]
[x]
x
x
x
x
x
x
x
x
x
x
x
Chemical
pH/Acidity/Alkalinity
Organic carbon
N (cycle)
P (cycle)
K (cycle)
Electrical conductivity (EC)
x x x
x
x
x
x
x
x
x
x
x
x
x
x
x
x
x
Biological activity x x x x x
Determiningsoil-
formingfactors
Parent material and substratum
Climate
Landform and topography
Hydrology and soil moisture regime
Vegetation type/Soil cover
Human influence1
x
x
x
[x]
x
x
x
x
x
x
x
x
x
x
x
x
x
x
x
x
x
x
x
x
x
x
x
x
x
x
x
x
x
x
x
x
x
x
x
x
x
x
x
x
x
x
x
x
x
x
x
x
Legend: x, essential factor in the process; [x], factor that expectedly has an influence on the process; empty field: no particulars
mentioned within the context of this stock-taking exercise; 1
Human influence here often refers to (change of) land use. However,
other farming practices, such as stocking density, cultivation techniques or field size can also play a role.](https://image.slidesharecdn.com/jrc50424-140505104012-phpapp01/85/Soil-Degradation-166-320.jpg)

![167
AddressingsoildegradationinEUagriculture:relevantprocesses,practicesandpolicies
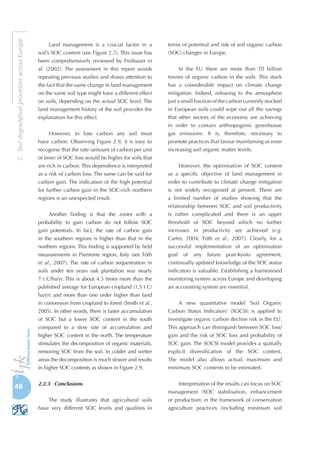
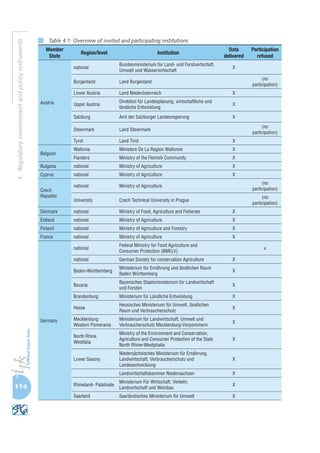
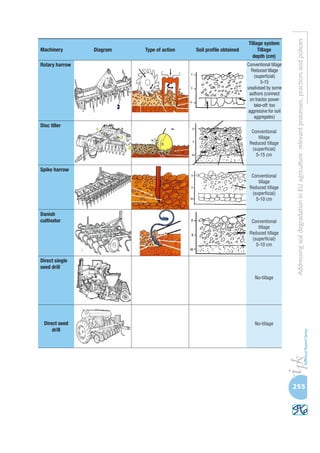
Table 5.2: Summary of the effect of farming practices on (a) physical, (b) chemical and (c) biological
soil characteristics
(a)
Soil physical characteristics
Porosity
Infiltration
rate/capacity
Gas
permeability
Aggregate
stability/size
Moisture
content/
-holding
capacity
Soil
temperature
Farmingpractices
No-tillage
Reduce tillage
Cover crops
Crop rotation
Ridge tillage
Contour farming
Subsoiling
Intercropping
Grasslands, esp. permanent
Agroforestry
(Conservation) Buffers
Terracing
+ (macro-porosity)
+ (macro-porosity)
[x]
(0/+)
+
[x]
+
+
+
+
+
[x]
+
-
-
[x]
+
+
+
+
+
+
+
+
[x]
+
-
-
-
-
[x]
[x]
(b)
Soil chemical characteristics
pH/Acidity/
Alkalinity
Organic
carbon
Nitrogen
(cycle)
Phosphorus
(cycle)
Potassium
(cycle)
Electrical
conductivity
(EC)
Farmingpractices
No-tillage
Reduce tillage
Cover crops
Crop rotation
Ridge tillage
Contour farming
Subsoiling
Intercropping
Grasslands, esp. permanent
Agroforestry
(Conservation) Buffers
Terracing
-
-
-
+
+
+
(+)
+
(+)
+
+
+
+
+
+
0/+
x
(0/+)
+
+
+
[+]
+
+
[+]
0/+
(0/+)
+
+
[+]
0/+
+
+
(c)
Soil biological characteristics
Macro-
fauna
Meso-
fauna
Micro-
fauna
Mycorhiza
Microbial
activity
Farmingpractices
No-tillage
Reduce tillage
Cover crops
Crop rotation
Ridge tillage
Contour farming
Subsoiling
Intercropping
Grasslands, esp. permanent
Agroforestry
(Conservation) Buffers
Terracing
+
+
+
+
(+)
+
[x]
[+]
+
+
[x]
(+)
+
[x]
[+]
+
+
[x]
+
(+)
+
[x]
[+]
+
+
[x]
(+)
+
[x]
[+]
+
+
[x]
+
(+)
+
[x]
[+]
Legend: +, positive observed effect; 0, neutral observed effect; -, negative observed effect; [x], expected effect; (x), limited (e.g. short-
term) or indirect effect; empty field: no particulars mentioned within the context of this stock-taking exercise](https://image.slidesharecdn.com/jrc50424-140505104012-phpapp01/85/Soil-Degradation-168-320.jpg)


![170
5.Summaryofsoildegradationprocesses,soil-friendlyfarmingpracticesandrelevantpolicymeasure
and water pollution. Furthermore, surface
water contamination by pesticides is directly
linked to run-off. Reduced run-off using no-
and reduced tillage can result in a pesticide
flow reduction of 29-100 %, depending on
the type of pesticide and cultivation practice
used. However, in a period of high drainage
(after significant rainfall), preferential
vertical transport could lead to groundwater
pollution; on the contrary, the absence of a
draining period could support the biological
breakdown of pesticides. The risk of nitrogen
pollution also increases with increased
leaching under preferential vertical transport.
However, soil cover shows significant effects
in reducing nitrate losses, irrespective of
Table 5.3: Summary of the effect of farming practices on (a) soil degradation processes and (b) related
environmental issues
(a)
Soil degradation processes
Watererosion
Winderosion
Tillageerosion
Organiccarbon
decline
Compaction
Salinisation/
Sodification
Contamination
Soilbiodiversity
decline
Landslidesand
floods
Farmingpractices
No-tillage
Reduce tillage
Cover crops/Vegetation cover
Crop rotation
Ridge tillage
Contour farming
Subsoiling
Intercropping
Grasslands, esp. permanent
Agroforestry
(Conservation) Buffers
Terracing
-/+
-/+
+
+
+
+
+
x
+
+
+
+
++
+
[+]
+
x
+
0
++
[+]
[+]
[x]
+
+
x
+
+
+
+
+
+
+
(+)
(-/+)
(-/+)
+
(+)
+
+
+
+
+
[+]
+
+
[+]
+
+
[+]
[+]
(+)
-/+
(b)
Related environmental quality/quantity issues
Water quality
Airquality1
Energy
Biodiversity
Landscape2
Pesticides
Nitrogen
Phosphorus
Potassium
Farmingpractices
No-tillage
Reduce tillage
Cover crops/Vegetation cover
Crop rotation
Ridge tillage
Contour farming
Subsoiling
Intercropping
Grasslands, esp. permanent
Agroforestry
(Conservation) Buffers
Terracing
-/+
-/+
[+]
+
+
+
+
+
+
+
+
++
+
+
+
+
+
+
-/+
-/+
[-/+]
+
+
+
+
+
-/+
-/+
+
(+)
+
+
+
+
+
+
[-]
[-]
[+]
[+]
[+]
+
+
+
+
+
+
x
[+]
+
+
+
-
Legend: +, positive observed effect; 0, neutral observed effect; -, negative observed effect; [x], expected effect; (x), limited (e.g. short-
term) or indirect effect; empty field: no particulars mentioned within the context of this stock-taking exercise; 1 The term air quality
mostly refers to greenhouse gas emissions here.; 2 The term landscape refers to a group of characteristics that cannot be described
as abiotic (water, soil, air) neither as biotic resources (genetic, species and habitat diversity) but refer to visual aspects/aesthetics,
cultural heritage, etc.](https://image.slidesharecdn.com/jrc50424-140505104012-phpapp01/85/Soil-Degradation-171-320.jpg)


![173
AddressingsoildegradationinEUagriculture:relevantprocesses,practicesandpolicies
- Soil organic carbon enhances the water-
retention capacity and allows excess water
to drain freely from the soil, thus reducing
overland flow and water erosion. As such,
organic carbon decline exacerbates water
erosion. As organic carbon supports the soil
structure, organic carbon decline may also
contribute to compaction. Loss of organic
carbon results in decreased aggregate stability
with a negative impact on the denitrification
potential for biomass productivity, thus
resulting in soil contamination. Organic
carbon contributes to soil biodiversity;
organic carbon and soil biodiversity decline
are thus interrelated. Conversely, increased
organic carbon content and biological
activity may enhance pesticide fixation and/
or adsorption in the soil or their breakdown
in the surface horizon, and thus reduced risk
of surface run-off, with an expected positive
effect on water quality.
- (Surface) compaction creates significant
damage to infiltration rate and can thus
accelerate erosion and landslides.
- Contamination of surface and groundwater
affects water quality in all its aspects
Table 5.4: Summary of the effects of soil degradation processes on (a) other soil degradation processes
and (b) related environmental issues
(a)
Soil degradation processes
Watererosion
Winderosion
Tillageerosion
Organiccarbon
decline
Compaction
Salinisation/
Sodification
Contamination
Soilbiodiversity
decline
Landslidesand
floods
Soildegradation
processes
Water erosion
Wind erosion
Tillage erosion
Organic carbon decline
Compaction
Salinisation/Sodification
Contamination
Soil biodiversity decline
Landslides and floods
x
x
x
x
x
x
x
x
x
x
x
x
x
x
x
x
x
x
x
x
x
x
x
x
x
x
x
x
x
x
x
x
x
x
x
x
x
x
x
x
x
x
x
(b)
Related environmental quality/quantity issues
Water quality
Airquality
Biodiversity
Landscape1
Pesticides
Nitrogen
Phosphorus
Potassium
Soildegradation
processes
Water erosion
Wind erosion
Tillage erosion
Organic carbon decline
Compaction
Salinisation/Sodification
Contamination
Soil biodiversity decline
Landslides and floods
x
x
x
x
x
x
x
x
x
x
x
x
x
x
x
x
x
x
x
x
x
x
x
x
x
x
x
x
x
x
x
x
x
x
x
Legend: x, observed/measured effect; [x], expected effect; (x), limited (e.g. short-term) or indirect effect; empty field: no particulars
mentioned within the context of this stock-taking exercise; 1 The term landscape refers to a group of characteristics that cannot be
described as abiotic (water, soil, air) neither as biotic resources (genetic, species and habitat diversity) but that refer to visual aspects/
aesthetics, cultural heritage, etc.](https://image.slidesharecdn.com/jrc50424-140505104012-phpapp01/85/Soil-Degradation-174-320.jpg)


![176
5.Summaryofsoildegradationprocesses,soil-friendlyfarmingpracticesandrelevantpolicymeasure
Table5.5:(Expected)effects(positive,neutralornegative)offarmingsystemsandpracticesonsoildegradationprocessesandrelatedenvironmentalissues
andtheirlinkwithpolicymeasures
SoildegradationprocessesRelatedenvironmentalquality/quantityissues
Water erosion
Wind erosion
Tillage erosion
Related offsite damages
Organic carbon decline
Compaction
Salinisation/ Sodification
Acidification
Contamination (local)
Contamination (difuse)
Soil biodiversity decline
Landslides and floods
Waterquality
Air quality (Green-house
gas emissions)
Energy
Biodiversity
Landscape
General
Pesticides
Nitrogen
Phosphorus
Potassium
Farming
systems
Integratedhorticulturalproduction[+][+][+][+][+][+][+]
(Conversionfromconventionalto)
Organicfarming
+/00+++/0+/0+++/0
[+]/+[+][+][+][+][+][+][+][+]
Farming practices
ARABLELAND
No-tillage-/+++++(-/)+++-/++-/+-/++[+]
[+]
[+]/+[+][+][+][+][+][+][+][+]
Reducedtillage-/++[+]+(-/)+++-/++-/+-/++[+]
[+]
[+][+][+][+][+][+]
Covercrops/Vegetationcover+++[+]++[+][+]++[-/+]++[+]
[+][+][+]
[+]/+[+][+][+][+][+][+][+][+][+][+][+][+][+][+]
[+][+]
Croprotation+++++++++(+)+++
[+][+][+][+][+][+][+][+]
[+][+][+][+][+][+][+]
[+]](https://image.slidesharecdn.com/jrc50424-140505104012-phpapp01/85/Soil-Degradation-177-320.jpg)
![177
AddressingsoildegradationinEUagriculture:relevantprocesses,practicesandpolicies
SoildegradationprocessesRelatedenvironmentalquality/quantityissues
Water erosion
Wind erosion
Tillage erosion
Related offsite damages
Organic carbon decline
Compaction
Salinisation/ Sodification
Acidification
Contamination (local)
Contamination (difuse)
Soil biodiversity decline
Landslides and floods
Waterquality
Air quality (Green-house
gas emissions)
Energy
Biodiversity
Landscape
General
Pesticides
Nitrogen
Phosphorus
Potassium
Farming practices
Ridgetillage+[+][-]++++++
Contourfarming++x
[+]
Subsoling(+)[+][-]
Coarseseedheds[+]
Intercropping[+]++++++[+]
[+][+][+][+][+][+][+][+][+]
Stripcropping[+][+]
[+][+][+][+][+][+]
Restrictionsongrowingrowcrops[+]
Legumesonrecultivatedagricultural
land[+][+]
Maintenanceandincorporationof
stubbleandcrop(s)(residues)[+][+][+][+][+][+]
Delayedmanureincorporation[+]
(Appropriate)Useofexogenous
organicmatter
[+][+][+][+][+][+]
[+][+][+]
(Limitedorno)Fertiliseruse[+][+][+][+][+]
[+][+][+][+][+][+]
Reduced(orno)plantprotection/
pesticideuse
[+][+][+][+][+]
[+][+][+][+][+][+]
Restrictionsonintensivecrop
productioninreversideareas[+][+][+][+][+]
Grazingcropremainsandstubble[+]](https://image.slidesharecdn.com/jrc50424-140505104012-phpapp01/85/Soil-Degradation-178-320.jpg)
![178
5.Summaryofsoildegradationprocesses,soil-friendlyfarmingpracticesandrelevantpolicymeasure
SoildegradationprocessesRelatedenvironmentalquality/quantityissues
Water erosion
Wind erosion
Tillage erosion
Related offsite damages
Organic carbon decline
Compaction
Salinisation/ Sodification
Acidification
Contamination (local)
Contamination (difuse)
Soil biodiversity decline
Landslides and floods
Waterquality
Air quality (Green-house
gas emissions)
Energy
Biodiversity
Landscape
General
Pesticides
Nitrogen
Phosphorus
Potassium
Farming practices
GRASSLAND
Conversionarablefarmingto
(permanent)pasture[+]/+[+]/+[+][+][+][+][+][+][+][+][+]
Grasslands,esp.permanent++++++++
[+][+][+][+][+][+][+]
[+][+][+][+][+][+][+]
Extensivegrasslandmanagement[+][+][+][+][+][+][+][+][+]
[+][+][+][+][+][+]
[+][+][+][+][+][+][+][+][+][+][+][+]
Temporaryrestrictionsongrazing[+][+]
Establishmentof(permanent)
wetlands
[+][+][+][+][+]
[+][+][+][+][+][+][+][+][+][+]
FOREST
Agroforestryxxx(+)(+)++++++
[+][+][+][+][+]
Afforestationofagriculturalland[+][+][+][+][+][+][+][+]
NON-AGRICULTURALLAND
Avoidencroachment[+][+][+][+]](https://image.slidesharecdn.com/jrc50424-140505104012-phpapp01/85/Soil-Degradation-179-320.jpg)
![179
AddressingsoildegradationinEUagriculture:relevantprocesses,practicesandpolicies
SoildegradationprocessesRelatedenvironmentalquality/quantityissues
Water erosion
Wind erosion
Tillage erosion
Related offsite damages
Organic carbon decline
Compaction
Salinisation/ Sodification
Acidification
Contamination (local)
Contamination (difuse)
Soil biodiversity decline
Landslides and floods
Waterquality
Air quality (Green-house
gas emissions)
Energy
Biodiversity
Landscape
General
Pesticides
Nitrogen
Phosphorus
Potassium
Farming practices
LINEARLANDELEMENTS
(Conservation)Buffers++[+][+]+++++
[+][+][+][+][+]
[+]/+[+][+][+][+][+][+][+][+]
Extensificationofbufferstrips[+][+][+][+][+][+][+][+][+][+][+]
FARMINFRASTRUCTURE
Rearrangementoffieldsize[+][+][+][+]
Terracing:maintenanceor
reconstruction
+0-/+[-]-
[+][+]
[+][+]
Efficientsurfacewaterdrainage
system[+][+]
Appropriateirrigationsystem[+]
Adequatestorageoforganicfertiliser[+][+]
[+][+][+][+][+]
Appropriatemachineryuse[+][+]
Legend:+,positiveeffect;0,neutraleffect;-,negativeeffect;x,actual/observed/measuredeffect;[x],expectedeffect;(x),limited(e.g.short-term)orindirecteffect;emptyfield:noparticularsmentioned
withinthecontextofthisstock-takingexercise;1Thetermlandscapereferstoagroupofcharacteristicsthatcannotbedescribedasabiotic(water,soil,air)neitherasbioticresources(genetic,speciesand
habitatdiversity)butthatrefertovisualaspects/aesthetics,culturalheritage,etc.;,Conservationagriculture;,SMR;,GAEC;,RDP–Axis2:LFA;,Natura2000(andWater
FrameworkDirective);,RDP–Axis2:Agri-environmentmeasures;,RDP-Axis2:Agroforestryandafforestation](https://image.slidesharecdn.com/jrc50424-140505104012-phpapp01/85/Soil-Degradation-180-320.jpg)


![References
212
- Murdock, L. (1999): Subsoiling of no-tilled corn, University of Kentucky. Available at: http://www.uky.
edu/Ag/Agronomy/Extension/ssnv/ssvl203.pdf
- Murillo, M., Schnabel, S. and González, F. (2004): Effect of different pasture improvement techniques
on soil erosion and herbaceous vegetation in a wooded rangeland, South-West Spain. In: Schnabel, S.
and Ferreira, A. (eds.). Advances in Geoecology 37, pp. 377-389.
- Muscutt, A. D., Harris, G. L., Bailey, S. W. and Davies, D. B. (1993): Buffer zones to improve water
quality: a review of their potential use in UK agriculture. Agriculture, Ecosystems and Environment 45
(1-2), pp. 59-77.
- Nägeli, W. (1943): Untersuchungen über die Windverhältnisse im Bereich der Windschutzstreifen.
Mitteilungen der Schweizerischen Anstalt für forstliches Versuchswesen 23, 223 p.
- Nakao, M. and Sohngen, B. (2000): The effect of site quality on the costs of reducing soil erosion with
Riparian buffers. Journal of Soil and Water Conservation 55, pp. 231-237.
- Nappi, P., Cenci, R. M., Barberis, R. and Dabergami, D. (2003): Suoli e muschi del Piemonte centro-
nord: ditribuzione della concentrazione di elementi in tracce e flussi di deposizione. Bollettino della
Società Italiana della Scienza del Suolo 52 (1-2), pp. 775-787.
- NCCES (North Carolina Cooperative Extension Service) (2005): Soil acidity and liming:basic information
for farmers and gardeners, AG-439-51. Available at: http://www.soil.ncsu.edu/publications/Soilfacts/
AGW-439-51/basics_12-3.pdf.
- Nevens, F. and Reheul, D. (2003): Effects of cutting or grazing grassland on herbage yield, nitrogen
uptake and residual soil nitrate at different levels of N fertilization. Grass and Forage Science, pp.
431-449.
- NRCS (Natural Resources Conservation Service) (2008): Buffers, common-sense conservation.
Available at: http://www.nrcs.usda.gov/feature/buffers/BufrsPub.html.
- Olesen, J.E. and Munkholm, L.J. (2007): Subsoil loosening in a crop rotation for organic farming
eliminated plough pan with mixed effects on crop yield. Soil and Tillage Research 94, pp. 376-385.
- Oorts, K. (2006): Effects of tillage systems of soil organic matter stocks and C and N fluxes in cereal
cropping systems on a silt loam soil in northern France. Doctoral Thesis INAPG, 159 p.
- Orlov, D.S. (1990): Humid acids in soils and general theory of humification. Moscow State University,
325 [in Russian].
- Ortiz-Miranda, D. and Estruch-Guitart, V. (2004): The role of agri-environmental measures in the
definition of property rights. In: Van Huylenbroeck, G., Verbecke, W. and Lauwers, L. (Eds.): Role of
Institutions in Rural Policies and Agricultural Markets, Amsterdam, pp.335-348.](https://image.slidesharecdn.com/jrc50424-140505104012-phpapp01/85/Soil-Degradation-213-320.jpg)


![References
220
- Turin, U.V. (1965): Soil organic matter and its role in the soil fertility. Nauka, Moscow, 319 p. [in
Russian]
- UNEP/CBD/SBSTTA/13/2 (2007): In-depth review of the implementation of the programme of work
on agricultural biodiversity. Biodiversity in agricultural soils.
- United Nations (1992): Framework Convention on climate change. New York.
- United Nations (1994): United Nations Convention to combat desertification in countries experiencing
serious drought and/or desertification, particularly in Africa. Paris.
- United Nations (1997): Kyoto Protocol to the United Nations Framework Convention on climate
change. Kyoto.
- University of Manitoba (2006): Cultivar mixtures, cover crops, and intercropping with organic spring
wheat. Available at: http://www.umanitoba.ca/outreach/naturalagriculture/articles/wheatintercrop.
html.
- USDA (United States Department of Agriculture) (1996): Conservation crop rotation effects on soil
quality. Natural Resources Conservation Service, Soil Quality Institute, technical note 2. Available at:
http://soils.usda.gov/sqi/management/files/sq_atn_2.pdf.
- Valdivia, R.O. (2002): The economics of terraces in the Peruvian Andes: An application of sensitivity
analysis in an integrated assessment model. Thesis at Montana State University. Available at: http://
www.tradeoffs.montana.edu/pdf/valdivia/valdivia.pdf.
- Van-Camp, L., Bujarrabal, B., Gentile, A.R., Jones, R.J.A., Montanarella, L., Olazabal, C. and
Selvaradjou, S.K. (2004): Reports of the echnical Working Groups established under the thematic
strategy for soil protection. Office for Official Publications of the European Communities, Luxembourg
(EUR 21319 EN/3).
- Vandeputte, E. (2007): Changes in the agricultural practices by giving up ploughing in France. KASSA
project, European platform, deliverable 1.1, appendix A2.
- Van Lynden, G.W.J. (1995): European soil resources. Current status of soil degradation, causes impacts
and need for action. Nature and Environment 71, Council of Europe.
- Van Muysen, W., Govers, G. and van Oost, K. (2002): Identification of important factors in the process
of tillage erosion: the case of mouldboard tillage. Soil and Tillage Research 65 (1), pp. 77-93.
- Van Oost, K. and Govers, G. (2006): Tillage erosion. In: Boardman, J. and Poesen, J. (eds.): Soil erosion
in Europe, pp. 599-608.
- Veen, P.H., Kampf, H. and Liro, A. (1997): Nature development on former state farms in Poland. Report
within the framework of the Memorandum of Understanding for Nature Conservation between the](https://image.slidesharecdn.com/jrc50424-140505104012-phpapp01/85/Soil-Degradation-221-320.jpg)


![226
- European Commission (2007): Communication from the Commission to the Council, the European
Parliament, the European Economic and Social Committee and the Committee of the Regions. Nitrates
report on implementation of Council Directive 91/676/EEC concerning the protection of waters
against pollution caused by nitrates from agricultural sources for the period 2000-2003, (COM(2007)
120 final).
- European Commission (2008): Proposal for a Council Regulation establishing common rules for direct
support schemes for farmers under the common agricultural policy and establishing certain support
schemes for farmers; Proposal for a Council Regulation on modifications to the common agricultural
policy by amending Regulations (EC) No 320/2006, (EC) No 1234/2007, (EC) No 3/2008 and (EC) No
[…]/2008; Proposal for a Council Regulation amending Regulation (EC) No 1698/2005 on support for
rural development by the European Agricultural Fund for Rural Development (EAFRD); Proposal for a
Council Decision amending Decision 2006/144/EC on the Community strategic guidelines for rural
development (programming period 2007 to 2013), (COM(2008) 306 final).](https://image.slidesharecdn.com/jrc50424-140505104012-phpapp01/85/Soil-Degradation-227-320.jpg)


![AddressingsoildegradationinEUagriculture:relevantprocesses,practicesandpolicies
279
Policy inventory forms
Mandatory measures (MM)
Please add data within this category concerning: the requirement to keep land in good agricultural and
environmental condition (GAEC) as implemented in relation to cross compliance (CC) for Single Payment
Scheme (SPS), and according to Single Area Payment Scheme (SAPS) in the New Member States as well as
national and regional laws and regulations (e.g. cross compliance regulations, ambient standards, emission
standards, mandatory practices, etc.)
1. Please insert the English name of the MM:
2. Please insert the local name of the MM:
3. Please give a short description of the MM (1 sentence):
4. For which region (NUTS) is the MM valid? (... on which spatial level?)
Select (from region list)
5. When was the MM implemented? (Year):
6. Does the Mandatory Measure (MM) refer to the Good Agricultural and Environmental Condition (GAEC) standards as
defined in the directive EC 1782/2003, Annex 4, 1-3?
Select: Yes/ No
6. Is this MM implemented in form of a cross compliance regulation (with direct payments SPS/SAPS)?
Select: Yes/ No
7. Which institutions, initiatives and others were involved developing the MM? (apart from EU institutions)
(Multiple entries possible via [ctrl] + mouse-click)
- ---
- National Ministry of Agriculture
- National Ministry of the Environment
- Federal State Ministry of Agriculture
- Federal State Ministry of the Environment
- Agricultural paying Agency, Environmental authority
- University
- Research institution
- Farmer association
- Environmental organisation
- NGO
- Other
8. Why was the MM implemented? (1 sentence)
9. What is the main target of the MM?
- ---
- Soil conservation
- Water
- Air
- Biodiversity
- Other (not specified)
10. Which soil protection problems are addressed in the MM?
(Multiple entries possible via [ctrl] + mouse-click)
- ---
- Soil erosion (water)
- Soil erosion (wind)
- Decline in organic matter
- Soil contamination (local)
- Soil contamination (diffuse)
- Soil compaction
- Decline in soil biodiversity
- Salinisation
- Floods and landslides
- Acidification
- Off-site damage related to soil erosion](https://image.slidesharecdn.com/jrc50424-140505104012-phpapp01/85/Soil-Degradation-280-320.jpg)
![Annex
280
11. Which agricultural cropping or tillage practices are affected by the MM?
(Multiple entries possible via [ctrl] + mouse-click)
- ---
- Land consolidation
- Set-aside
- Rearrangement in field size
- Establishment of linear elements
- Cultivation methods
- Tillage
- Fertilisation
- Drilling
- Crop rotation
- Pesticide use
- Irrigation
- Drainage
- Livestock management
- Other
13. Which agricultural long term practices/measures are affected by the MM?
(Multiple entries possible via [ctrl] + mouse-click)
- ---
- Crop rotation
- Strip cropping
- Use of organic soil improvers/exogenous organic material
- Control of irrigation and drainage
- Change of field patterns and size
- Technical constructions (ditches, terraces, retention ponds)
- Livestock-related measures
- Other
14. If agricultural practices addressing soil conservation have not been specified above, please specify:
14. Is the MM result-oriented or measure-oriented? (Example: Result-oriented: meets certain measurable values of (say)
toxins, nitrates, etc.; Measure-oriented: no-tillage, reduced tillage, one cut per year, etc.)
Select: Result-oriented, Measure-oriented
15. Are agricultural practices specified or recommended by the MM?
Select: Yes/ No
16. Who is the implementation authority of the MM?
- ---
- National Ministry of Agriculture
- National Ministry of the Environment
- Federal State Ministry of Agriculture
- Federal State Ministry of the Environment
- Agricultural paying agency
- Environmental authority
- Other
17. Who is the monitoring authority of the MM?
- ---
- National Ministry of Agriculture
- National Ministry of the Environment
- Federal State Ministry of Agriculture
- Federal State Ministry of the Environment
- Agricultural paying agency
- Environmental authority
- Other
18. What are the monitoring mechanisms of the MM?
(Multiple entries possible via [ctrl] + mouse-click)
- ---
- Random field survey
- Complete survey
- Self reporting
- Others](https://image.slidesharecdn.com/jrc50424-140505104012-phpapp01/85/Soil-Degradation-281-320.jpg)
![AddressingsoildegradationinEUagriculture:relevantprocesses,practicesandpolicies
281
19. Are there (punitive) sanctions for non-compliance in practice?
- ---
- Yes, but not sufficiently effective
- Yes, there are effective sanctions
- No; sanctions are not relevant
20. What is the (estimated) percentage of compliance of the MM?
- ---
- 0-50 %
- 50-75 %
- 75-90 %
- 90-100 %
20. What are the main problems implementing the above described MM concerning soil protection in your country/region?
21. Please give reference to the MM (title of document, name of law)
22. and/or website/url :
Voluntary incentive-based measures (VIBM)
Please add data within this category concerning: measures as part of the Rural Development Plans (Directive
No.1698/2005, Axis 1 (‘Improving the competitiveness of the agricultural and forestry sector’), 2 (‘Improving
the environment and the countryside’) and 4 (‘LEADER’)) as well as national and regional efforts.
1. Please insert the English name of the VIBM:
2. Please insert the local name of the VIBM:
3. Please give a short description of the VIBM (1 sentence):
4. For which region (NUTS) is the VIBM valid? (... on which spatial level?)
Select (from region list)
5. When was the VIBM implemented? (Year)
6. Does the VIBM refer to the Good Agricultural and Environmental Condition (GAEC) standards as defined in the directive EC
1782/2003, Annex 4, 1-3?
Select: Yes/ No
7. Is this VIBM addressing soil conservation implemented in form of Less Favoured Area Payments (LFA)?
Select: Yes/ No
8. Does the VIBM addressing soil conservation include one or more of the following within the range of rural development
measures (EC 1698/2005)? (Improving the competitiveness of the agricultural and forestry sector, Axis 1)
(Multiple entries possible via [ctrl] + mouse-click)
- ---
- Training of farmers
- Use of advisory services by farmers
- Restoring of agricultural production potential and prevention of natural disasters
- Modernisation of agricultural production systems
9. Does the VIBM concerning soil conservation include one or more of the following within the range of rural development
measures (EC 1698/2005)? (Improving the environment and the countryside, Axis 2)
(Multiple entries possible via [ctrl] + mouse-click)
- ---
- Payments to farmers in areas with handicaps, other than mountain areas (Less Favoured Areas, LFA)
- Natura 2000 payments and payments linked to Directive 2000/60/EC
- Agri-environmental payments
- Support for non productive investments
- Afforestation
- Establishment of agroforestry systems](https://image.slidesharecdn.com/jrc50424-140505104012-phpapp01/85/Soil-Degradation-282-320.jpg)
![Annex
282
10. Does the VIBM concerning soil conservation include one or more of the following within the range of rural development
measures (EC 1698/2005)? (LEADER, Axis 4)
(Multiple entries possible via [ctrl] + mouse-click)
- ---
- Area-based public private partnerships
- Bottom-up approach with a decision making power for local action groups
- Implementation of cooperation projects
- Networking of local partnerships
11. Which institutions, initiatives and others were involved developing the MM? (apart from EU institutions)
(Multiple entries possible via [ctrl] + mouse-click)
- ---
- National Ministry of Agriculture
- National Ministry of the Environment
- Federal State Ministry of Agriculture
- Federal State Ministry of the Environment
- Agricultural paying agency, Environmental Authority
- University
- Research institution
- Farmer association
- Environmental organisation
- NGO
- Other
12. Why was the VIBM implemented? (1 sentence)
13. What is the main target of the VIBM?
- ---
- Soil conservation
- Water
- Air
- Biodiversity
- Other (not specified)
14. Which soil protection problems are addressed in the VIBM?
(Multiple entries possible via [ctrl] + mouse-click)
- ---
- Soil erosion (water)
- Soil erosion (wind)
- Decline in organic matter
- Soil contamination (local)
- Soil contamination (diffuse)
- Soil compaction
- Decline in soil biodiversity
- Salinisation
- Floods and landslides
- Acidification
- Off-site damage related to soil erosion
15. Which agricultural cropping or tillage practices are affected by the VIBM?
(Multiple entries possible via [ctrl] + mouse-click)
- ---
- Land consolidation
- Set-aside
- Rearrangement in field size
- Establishment of linear elements
- Cultivation methods
- Tillage
- Fertilisation
- Drilling
- Crop rotation
- Pesticide use
- Irrigation
- Drainage
- Livestock management
- Other](https://image.slidesharecdn.com/jrc50424-140505104012-phpapp01/85/Soil-Degradation-283-320.jpg)
![AddressingsoildegradationinEUagriculture:relevantprocesses,practicesandpolicies
283
16. Which agricultural long term practices/measures are affected by the VIBM?
(Multiple entries possible via [ctrl] + mouse-click)
- ---
- Crop rotation
- Strip cropping
- Use of organic soil improvers/exogenous organic material
- Control of irrigation and drainage
- Change of field patterns and size
- Technical constructions (ditches, terraces, retention ponds)
- Livestock-related measures
- Other
17. If further agricultural practices concerning soil conservation related to the VIBM have not been specified above, please
specify.
18. Is the VIBM result-oriented or measure-oriented? (Example: Result-oriented: meets certain measurable values of (say) toxins,
nitrates, etc.; Measure-oriented: no-tillage, reduced tillage, one cut per year, etc.)
Select: Result-oriented, Measure-oriented, Other
19.Are there eligibility restrictions for participation in the measure? (Example: Spatial restriction: participation on VIBM considering soil
erosion only in sloping areas. Factual restriction: participation in VIBM for organic farming only for certified organic farms, etc.)
Select: Yes/ No
20. Who is the implementing authority of the VIBM?
- ---
- National Ministry of Agriculture
- National Ministry of the Environment
- Federal State Ministry of Agriculture
- Federal State Ministry of the Environment
- Agricultural paying agency
- Environmental authority
- Other
21. Who is the monitoring authority of the VIBM?
- ---
- National Ministry of Agriculture
- National Ministry of the Environment
- Federal State Ministry of Agriculture
- Federal State Ministry of the Environment
- Agricultural paying agency
- Environmental authority
- Other
22. What are the monitoring mechanisms of the VIBM?
(Multiple entries possible via [ctrl] + mouse-click)
- ---
- Random field survey
- Complete survey
- Self reporting
- Others
23. What is the planned uptake area of the VIBM (in ha)? (if relevant, not relevant for taxes)
- ---
- <100 ha
- <1 000 ha
- <10 000 ha
- <100 000 ha
- <1 Mio ha
- >1 Mio ha
24. What is the actual uptake area of the VIBM? (if relevant, not relevant for taxes)
- ---
- <100 ha
- <1 000 ha
- <10 000 ha
- <100 000 ha
- <1 Mio ha
- >1 Mio ha](https://image.slidesharecdn.com/jrc50424-140505104012-phpapp01/85/Soil-Degradation-284-320.jpg)
![Annex
284
25. How many farms participate in the VIBM? (if relevant, not relevant for taxes)
- ---
- <100
- <1 000
- <10 000
- <100 000
- <1 Mio
- >1 Mio
26. What is the contract period of the VIBM?
- ---
- <5
- <10
- <20
- no time limit
27. What is the total (estimated) budget of the VIBM [€] (including European funds)? (if relevant, not relevant for taxes)
- ---
- EUR <100 000
- EUR <1 Mio
- EUR <10 Mio
- EUR <100 Mio
- EUR <1 000 Mio
- EUR >1 000 Mio
28. What is the amount of compensations per ha (in €)? (if relevant, not relevant for taxes)
- ---
- EUR <100
- EUR 100-300
- EUR 300-500
- EUR >500
29. What are the main problems implementing the above described VIBM concerning soil protection in your country/region?
30. Please give reference to the VIBM (title of document, name of law):
31. and/or website/url :](https://image.slidesharecdn.com/jrc50424-140505104012-phpapp01/85/Soil-Degradation-285-320.jpg)
![AddressingsoildegradationinEUagriculture:relevantprocesses,practicesandpolicies
285
Awareness-increasing measures and private initiatives (AIM+PI)
Please add data within this category concerning: environmental farm plans, sustainable agriculture
initiatives, good practices, environmental workshops, private initiatives.
1. Please insert the English name of the AIM+PI:
2. Please insert the local name of the AIM+PI:
3. Please give a short description of the AIM+PI (1 sentence):
4. For which region (NUTS) is the AIM+PI valid? (... on which spatial level?)
Select (from region list)
5. When was the AIM+PI implemented? (Year)
7. Which institutions, initiatives and others were involved developing the AIM+PI? (apart from EU institutions)
(Multiple entries possible via [ctrl] + mouse-click)
- ---
- National Ministry of Agriculture
- National Ministry o the Environment
- Federal State Ministry of Agriculture
- Federal State Ministry of the Environment
- Agricultural Paying Agency, Environmental Authority
- University
- Research institution
- Farmer association
- Environmental organisation
- NGO
- Other
8. Why was the AIM+PI implemented? (1 sentence)
9. How was the AIM+PI implemented? (Example: Top-down: government offers courses; Bottom-up: farmer organisation offers
courses)
Select: Top-down/ Bottom-up
10. What is the main target of the AIM+PI?
- ---
- Soil conservation
- Water
- Air
- Biodiversity
- Other (not specified)
11. Which soil protection problems are addressed in the AIM+PI?
(Multiple entries possible via [ctrl] + mouse-click)
- ---
- Soil erosion (water)
- Soil erosion (wind)
- Decline in organic matter
- Soil contamination (local)
- Soil contamination (diffuse)
- Soil compaction
- Decline in soil biodiversity
- Salinisation
- Floods and landslides
- Acidification
- Off-site damage related to soil erosion](https://image.slidesharecdn.com/jrc50424-140505104012-phpapp01/85/Soil-Degradation-286-320.jpg)
![Annex
286
12. Which agricultural cropping or tillage practices are affected by the AIM+PI?
(Multiple entries possible via [ctrl] + mouse-click)
- ---
- Land consolidation
- Set-aside
- Rearrangement in field size
- Establishment of linear elements
- Cultivation methods
- Tillage
- Fertilisation
- Drilling
- Crop rotation
- Pesticide use
- Irrigation
- Drainage
- Livestock management
- Other
13. Which agricultural long term practices/measures are affected by the AIM+PI?
(Multiple entries possible via [ctrl] + mouse-click)
- ---
- Crop rotation
- Strip cropping
- Use of organic soil improvers/exogenous organic material
- Control of irrigation and drainage
- Change of field patterns and size
- Technical constructions (ditches, terraces, retention ponds)
- Livestock-related measures
- Other.
14. If further agricultural practices concerning soil conservation related to the AIM+PI have not been specified above, please
specify:
15. What is the planned uptake area of the AIM+PI (in ha)? (if relevant, not relevant for taxes)
- ---
- <100 ha
- <1 000 ha
- <10 000 ha
- <100 000 ha
- <1 Mio ha
- >1 Mio ha
16. What is the actual uptake area of the AIM+PI? (if relevant, not relevant for taxes)
- ---
- <100 ha
- <1 000 ha
- <10 000 ha
- <100 000 ha
- <1 Mio ha
- >1 Mio ha
17. How many farms participate in the AIM+PI? (if relevant, not relevant for taxes)
- ---
- <100
- <1 000
- <10 000
- <100 000
- <1 Mio
- >1 Mio](https://image.slidesharecdn.com/jrc50424-140505104012-phpapp01/85/Soil-Degradation-287-320.jpg)
![AddressingsoildegradationinEUagriculture:relevantprocesses,practicesandpolicies
287
18. What is the total (estimated) budget of the AIM+PI [€] (including European funds)? (if relevant, not relevant for taxes)
- ---
- EUR <100 000
- EUR <1 Mio
- EUR <10 Mio
- EUR <100 Mio
- EUR <1 000 Mio
- EUR >1 000 Mio
19. What are the main problems implementing the above described AIM+PI concerning soil protection in your country/
region?
20. Please give reference to the AIM+PI (title of document, name of law):
21. and/or website/url :](https://image.slidesharecdn.com/jrc50424-140505104012-phpapp01/85/Soil-Degradation-288-320.jpg)


This document provides a summary of a report on addressing soil degradation in European Union agriculture. It discusses relevant soil degradation processes, soil conservation practices, and related policies. The key soil degradation processes addressed are erosion, organic carbon decline, compaction, salinization, contamination, and effects on biodiversity. Conservation practices discussed include conservation agriculture, organic farming, ridge tillage, contour farming, and others. The regulatory environment and policy instruments related to soil protection under the Common Agricultural Policy and environmental legislation are also analyzed. The document aims to provide an overview of the current situation regarding soil degradation and conservation in EU agriculture.


![Soil ppt[1][1]](https://cdn.slidesharecdn.com/ss_thumbnails/soilppt11-140505103549-phpapp01-thumbnail.jpg?width=640&height=640&fit=bounds)


