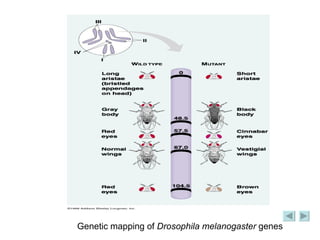
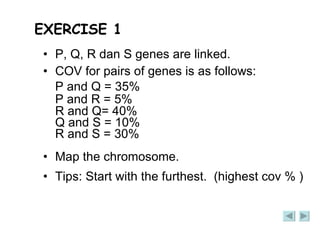
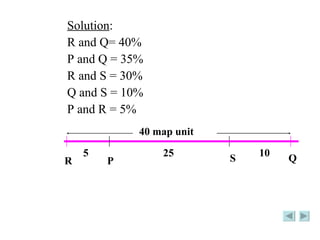
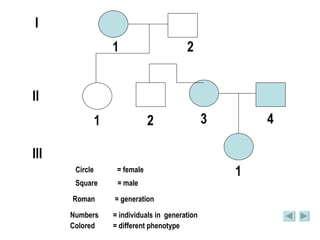
LECTURE 6 2.3  Genetic Mapping 2.4  Pedigree Analysis
OBJECTIVES At the end of the lesson, students should  be able to : Analyze  the example on pedigree given. Calculate and map  a chromosome’s genetic loci using recombination data. Determine  the position of genes/loci along a chromosome based on recombinant frequency data. Explain  Pedigree analysis.
Genetic Mapping The proportion of recombinants resulting from a dihybrid test cross is used to calculate the  cross over value (COV),   a measure of linkage, and if linkage occurs, the distance between genes  . COV is also known as  recombination frequency.
Genetic Mapping Formula COV = total number of recombinant /  total number of offspring x 100
If the genes are not linked,  the expected phenotype ratio of such a cross is 1:1:1:1  and there is a 50 per cent chance that alleles on separate chromosomes will be inherited together, the expected COV is 50 per cent;  the lower the value, the closer the genes.
Thus the COV can be used to locate the relative positions of genes on chromosomes, a process called  chromosome mapping  or genetic mapping.  By convention,  one per cent COV is equivalent to one map unit .  Today the word centimorgan is often used.
Cross over (meiosis) Homologous chromosome in synapsis  –  4 chromatid (tetrad) P Q p q kiasma r R
Genetic mapping of   Drosophila melanogaster  genes
Example  P :  CCSS  x  ccss P :  CS/CS  x  cs/cs G :  CS  cs F1 :  CS/cs  x  cs/cs G :  CS  cs  Cs  cS  cs x co  co CS/cs cs/cs cS/cs Cs/cs 480 480 20 20 Parent combination Recombinant
Genotype  Individuals CS/cs  480 cs/cs  480 Cs/cs  20 cS/cs  20  Parent combination Recombinant (cross over) Eg : Test cross F1  :  CS/cs  x  cs/cs  Parent combination = (480 + 480)/1000 = 96% Recombinant = (20 + 20)/1000 = 4% (cov) If C/c dan S/s genes is far apart, cov > 4% Jumlah  1000  C  S 4 map unit
EXERCISE 1 P, Q, R dan S genes are linked.  COV for pairs of genes is as follows: P and Q = 35% P and R = 5% R and Q= 40% Q and S = 10% R and S = 30% Map the chromosome. Tips: Start with the furthest.  (highest cov % )
Solution : R and Q= 40% P and Q = 35% R and S = 30% Q and S = 10% P and R = 5% R Q 40 map unit  5 25 10 S P
Cross over value given for P and Q = 4% P and R = 1% State the cross over value possible for  Q and R. P  Q 4 1 3 Cross over value for  Q and R = 3% P  Q 4 1 Cross over value for  Q and R  = 5% EXERCISE  2 R R
EXERCISE 3 In tomatoes, S = smooth  s = wrinkled M = red flower  m= white flower Test cross between smooth, red flower plant with wrinkled, white flower plant resulted in: Smooth fruit ,red flower = 300 Wrinkled fruit , white flower = 300 Smooth fruit, white flower  = 100 Wrinkled fruit, red flower = 100 Count the map unit for the distance between both S and M genes on its chromosome.
Total progeny  = 800  Recombinant = 100 + 100 800 =  25% Map unit for both  S and M genes = 25 m.u  S  M 25 SM/sm x  sm/sm Smooth fruit ,red flower = 300  (SM/sm) Wrinkled fruit , white flower = 300  (sm/sm) Smooth fruit, white flower  = 100  (Sm/sm) Wrinkled fruit, red flower = 100  (sM/sm)
Conclusion Through genetic mapping, we can determine : Relative distance  between  two genes. Linear sequence of the linked genes on a chromosome.
Pedigree Analysis A  pedigree   is a family tree that shows  genetic interrelationship  among parents and offspring across one or more generations.  Standardized symbols, methods and definitions are used to construct it.  Eg: Inherited disease in the British Royal family.
I II III Circle  = female Square  = male Roman  = generation Numbers  = individuals in  generation Colored  = different phenotype  1 2 1 1 2 4 3
Eg:  “widow’s peak” trait (dominant allele) W Allele = widow’s peak  w allele –  no widow’s peak
I II III Widow’s peak pedigree Color   = widow’s peak Ww ww ww WW @ Ww ww Ww Ww

Hour 6

  • 1.
    LECTURE 6 2.3 Genetic Mapping 2.4 Pedigree Analysis
  • 2.
    OBJECTIVES At theend of the lesson, students should be able to : Analyze the example on pedigree given. Calculate and map a chromosome’s genetic loci using recombination data. Determine the position of genes/loci along a chromosome based on recombinant frequency data. Explain Pedigree analysis.
  • 3.
    Genetic Mapping Theproportion of recombinants resulting from a dihybrid test cross is used to calculate the cross over value (COV), a measure of linkage, and if linkage occurs, the distance between genes . COV is also known as recombination frequency.
  • 4.
    Genetic Mapping FormulaCOV = total number of recombinant / total number of offspring x 100
  • 5.
    If the genesare not linked, the expected phenotype ratio of such a cross is 1:1:1:1 and there is a 50 per cent chance that alleles on separate chromosomes will be inherited together, the expected COV is 50 per cent; the lower the value, the closer the genes.
  • 6.
    Thus the COVcan be used to locate the relative positions of genes on chromosomes, a process called chromosome mapping or genetic mapping. By convention, one per cent COV is equivalent to one map unit . Today the word centimorgan is often used.
  • 7.
    Cross over (meiosis)Homologous chromosome in synapsis – 4 chromatid (tetrad) P Q p q kiasma r R
  • 8.
    Genetic mapping of Drosophila melanogaster genes
  • 9.
    Example P: CCSS x ccss P : CS/CS x cs/cs G : CS cs F1 : CS/cs x cs/cs G : CS cs Cs cS cs x co co CS/cs cs/cs cS/cs Cs/cs 480 480 20 20 Parent combination Recombinant
  • 10.
    Genotype IndividualsCS/cs 480 cs/cs 480 Cs/cs 20 cS/cs 20 Parent combination Recombinant (cross over) Eg : Test cross F1 : CS/cs x cs/cs Parent combination = (480 + 480)/1000 = 96% Recombinant = (20 + 20)/1000 = 4% (cov) If C/c dan S/s genes is far apart, cov > 4% Jumlah 1000 C S 4 map unit
  • 11.
    EXERCISE 1 P,Q, R dan S genes are linked. COV for pairs of genes is as follows: P and Q = 35% P and R = 5% R and Q= 40% Q and S = 10% R and S = 30% Map the chromosome. Tips: Start with the furthest. (highest cov % )
  • 12.
    Solution : Rand Q= 40% P and Q = 35% R and S = 30% Q and S = 10% P and R = 5% R Q 40 map unit 5 25 10 S P
  • 13.
    Cross over valuegiven for P and Q = 4% P and R = 1% State the cross over value possible for Q and R. P Q 4 1 3 Cross over value for Q and R = 3% P Q 4 1 Cross over value for Q and R = 5% EXERCISE 2 R R
  • 14.
    EXERCISE 3 Intomatoes, S = smooth s = wrinkled M = red flower m= white flower Test cross between smooth, red flower plant with wrinkled, white flower plant resulted in: Smooth fruit ,red flower = 300 Wrinkled fruit , white flower = 300 Smooth fruit, white flower = 100 Wrinkled fruit, red flower = 100 Count the map unit for the distance between both S and M genes on its chromosome.
  • 15.
    Total progeny = 800 Recombinant = 100 + 100 800 = 25% Map unit for both S and M genes = 25 m.u S M 25 SM/sm x sm/sm Smooth fruit ,red flower = 300 (SM/sm) Wrinkled fruit , white flower = 300 (sm/sm) Smooth fruit, white flower = 100 (Sm/sm) Wrinkled fruit, red flower = 100 (sM/sm)
  • 16.
    Conclusion Through geneticmapping, we can determine : Relative distance between two genes. Linear sequence of the linked genes on a chromosome.
  • 17.
    Pedigree Analysis A pedigree is a family tree that shows genetic interrelationship among parents and offspring across one or more generations. Standardized symbols, methods and definitions are used to construct it. Eg: Inherited disease in the British Royal family.
  • 18.
    I II IIICircle = female Square = male Roman = generation Numbers = individuals in generation Colored = different phenotype 1 2 1 1 2 4 3
  • 19.
    Eg: “widow’speak” trait (dominant allele) W Allele = widow’s peak w allele – no widow’s peak
  • 20.
    I II IIIWidow’s peak pedigree Color = widow’s peak Ww ww ww WW @ Ww ww Ww Ww