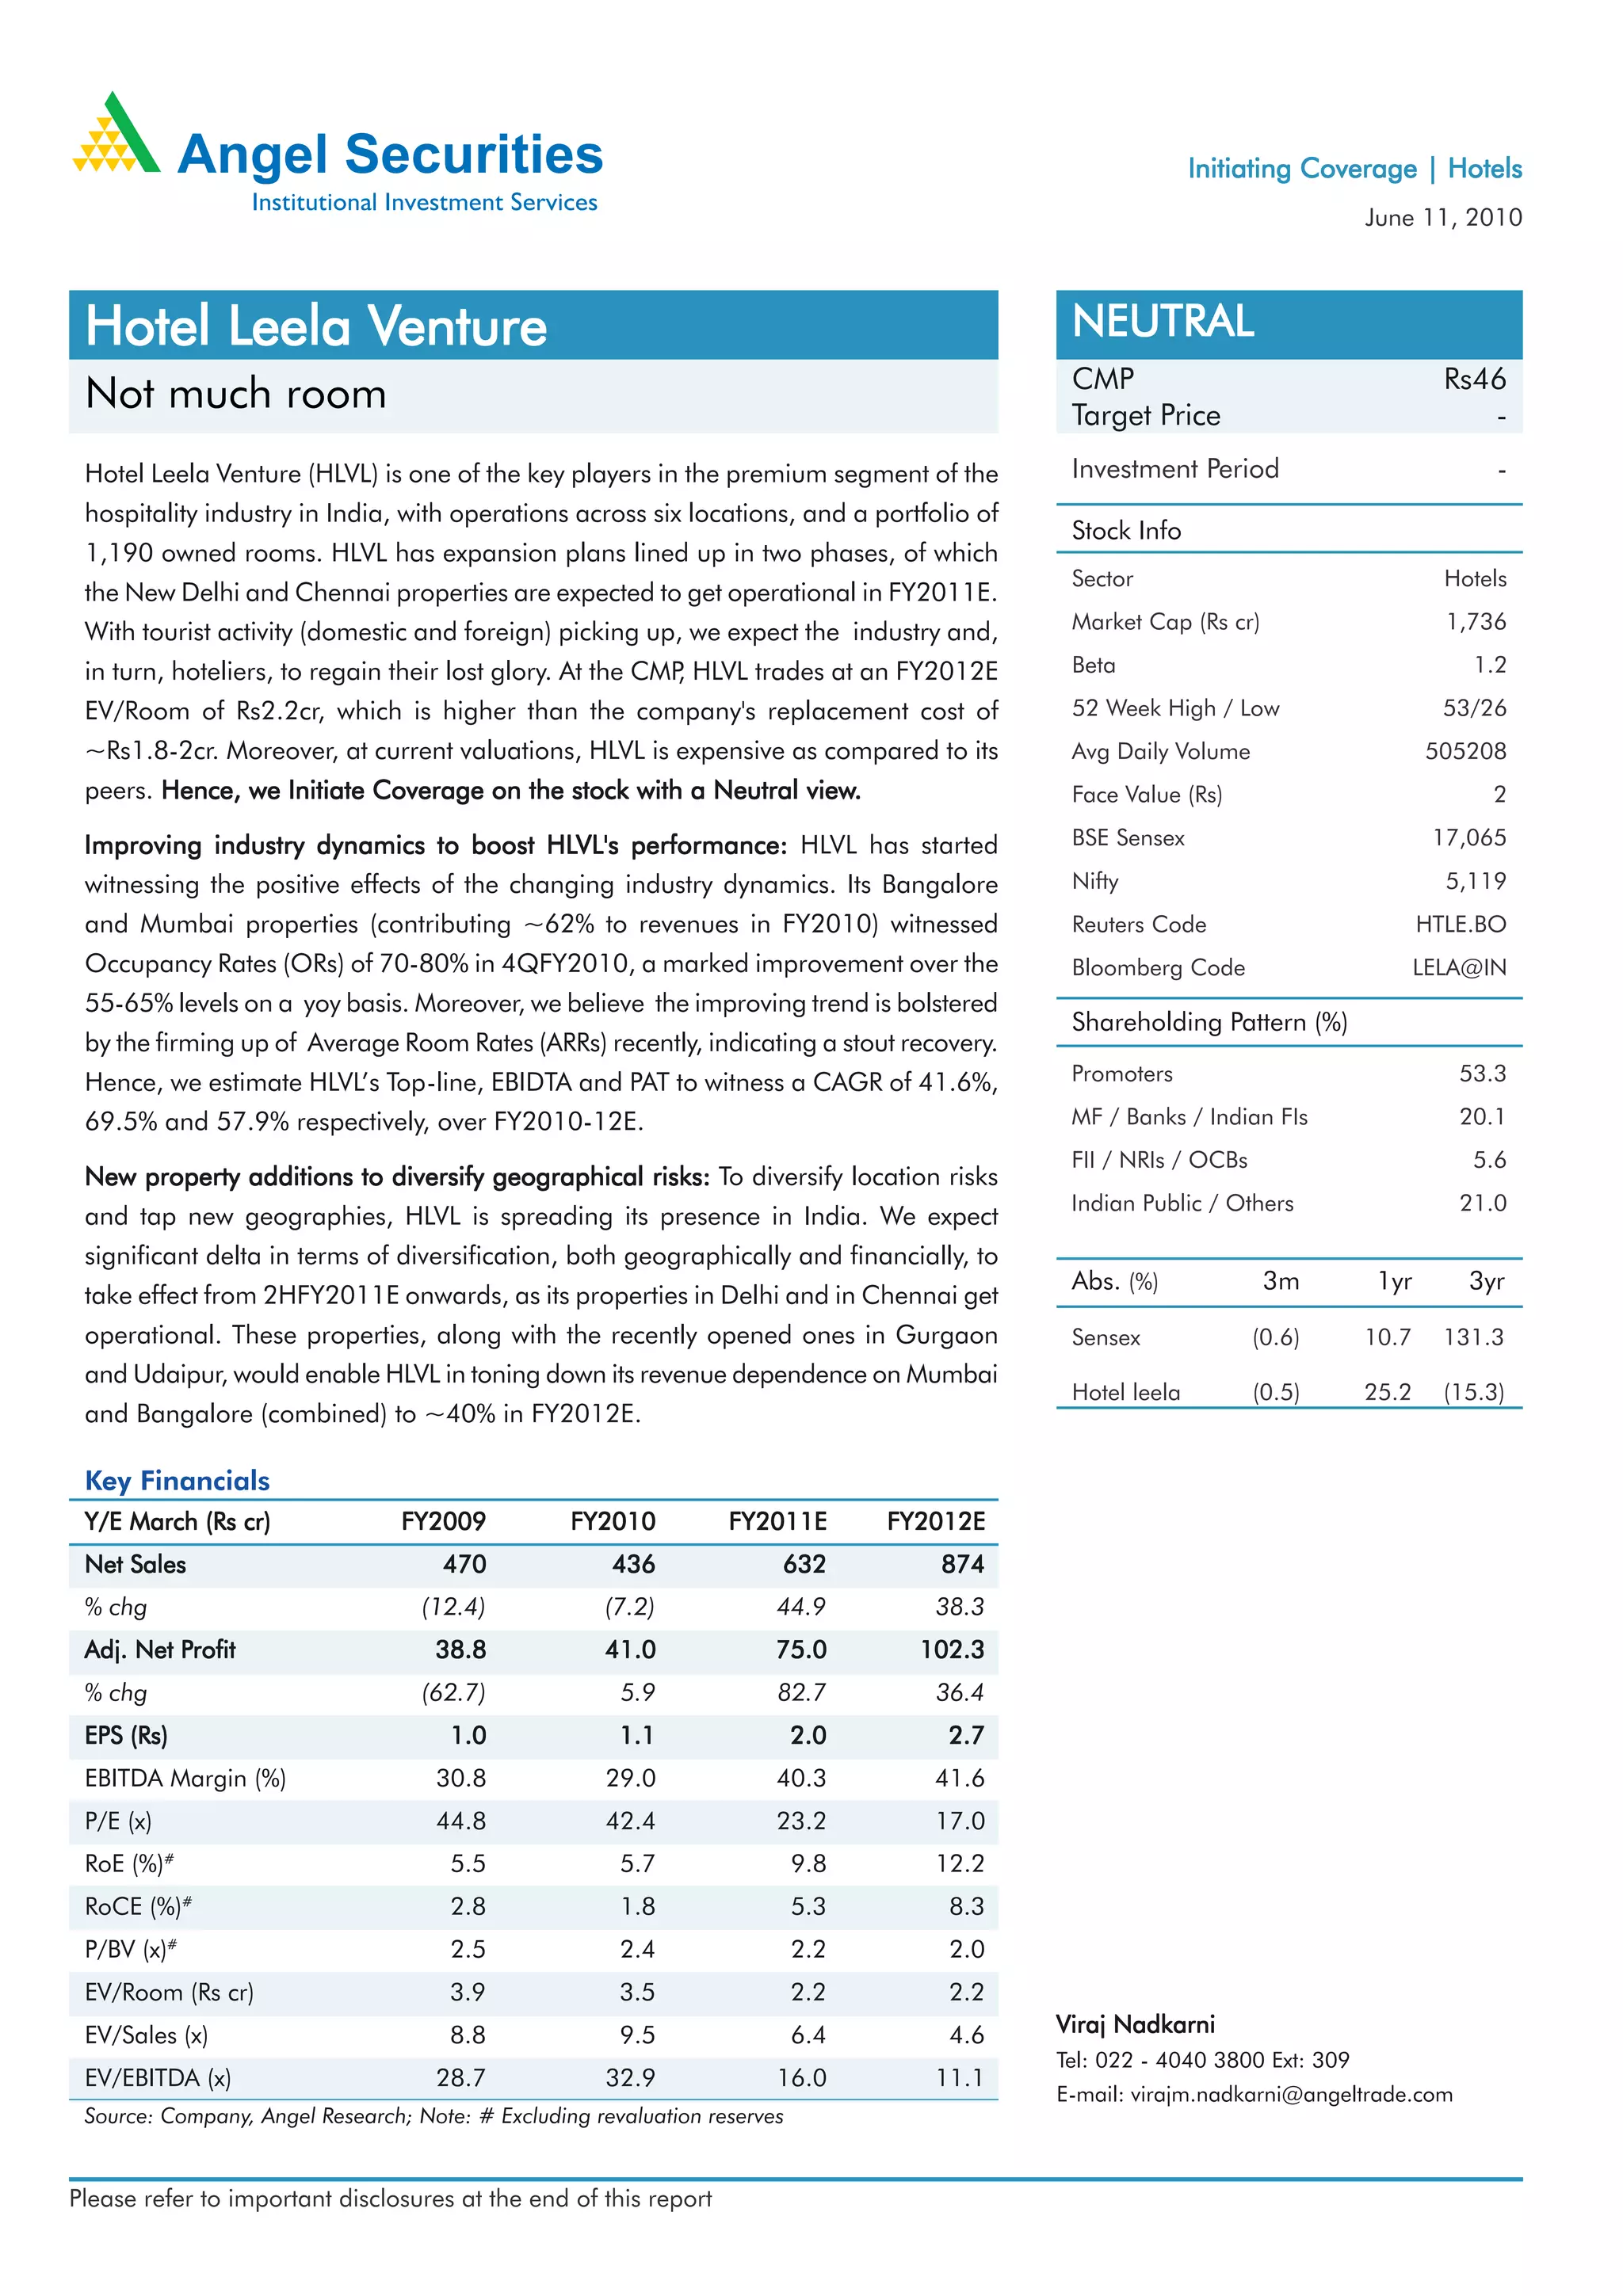
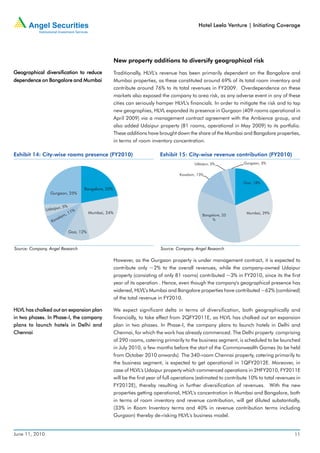
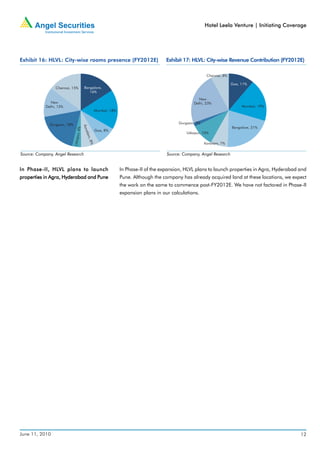
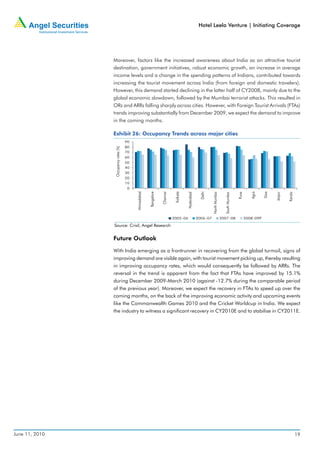
Initiating Coverage | Hotels
                                                                                                                           June 11, 2010


       Leela Venture
 Hotel Leela Venture                                                                        NEUTRAL
                                                                                            CMP                                     Rs46
 Not much room                                                                              Target Price                               -
 Hotel Leela Venture (HLVL) is one of the key players in the premium segment of the         Investment Period                            -
 hospitality industry in India, with operations across six locations, and a portfolio of
                                                                                            Stock Info
 1,190 owned rooms. HLVL has expansion plans lined up in two phases, of which
                                                                                            Sector                                  Hotels
 the New Delhi and Chennai properties are expected to get operational in FY2011E.
 With tourist activity (domestic and foreign) picking up, we expect the industry and,       Market Cap (Rs cr)                      1,736

 in turn, hoteliers, to regain their lost glory. At the CMP HLVL trades at an FY2012E
                                                           ,                                Beta                                      1.2

 EV/Room of Rs2.2cr, which is higher than the company's replacement cost of                 52 Week High / Low                      53/26
 ~Rs1.8-2cr. Moreover, at current valuations, HLVL is expensive as compared to its          Avg Daily Volume                      505208
 peers. Hence, we Initiate Coverage on the stock with a Neutral view.
                                                                view.                       Face Value (Rs)                             2

 Improving industry dynamics to boost HLVL's performance: HLVL has started
                                      HLVL's                                                BSE Sensex                             17,065

 witnessing the positive effects of the changing industry dynamics. Its Bangalore           Nifty                                   5,119
 and Mumbai properties (contributing ~62% to revenues in FY2010) witnessed                  Reuters Code                          HTLE.BO
 Occupancy Rates (ORs) of 70-80% in 4QFY2010, a marked improvement over the                 Bloomberg Code                        LELA@IN
 55-65% levels on a yoy basis. Moreover, we believe the improving trend is bolstered
                                                                                            Shareholding Pattern (%)
 by the firming up of Average Room Rates (ARRs) recently, indicating a stout recovery.
 Hence, we estimate HLVL’s Top-line, EBIDTA and PAT to witness a CAGR of 41.6%,             Promoters                                53.3

 69.5% and 57.9% respectively, over FY2010-12E.                                             MF / Banks / Indian FIs                  20.1
                                                                                            FII / NRIs / OCBs                         5.6
 New property additions to diversify geographical risks: To diversify location risks
                                                                                            Indian Public / Others                   21.0
 and tap new geographies, HLVL is spreading its presence in India. We expect
 significant delta in terms of diversification, both geographically and financially, to
                                                                                            Abs. (%)             3m         1yr       3yr
 take effect from 2HFY2011E onwards, as its properties in Delhi and in Chennai get
 operational. These properties, along with the recently opened ones in Gurgaon              Sensex              (0.6)      10.7     131.3
 and Udaipur, would enable HLVL in toning down its revenue dependence on Mumbai
                                                                                            Hotel leela         (0.5)      25.2     (15.3)
 and Bangalore (combined) to ~40% in FY2012E.

 Key Financials
 Y/E March (Rs cr)               FY2009           FY2010          FY2011E        FY2012E
 Net Sales                           470              436              632          874
 % chg                             (12.4)            (7.2)             44.9         38.3
 Adj. Net Profit
          Profit                    38.8             41.0              75.0        102.3
 % chg                             (62.7)              5.9             82.7         36.4
 EPS (Rs)                             1.0              1.1                 2.0       2.7
 EBITDA Margin (%)                  30.8             29.0              40.3         41.6
 P/E (x)                            44.8             42.4              23.2         17.0
 RoE (%)   #
                                      5.5              5.7                 9.8      12.2
 RoCE (%)      #
                                      2.8              1.8                 5.3       8.3
 P/BV (x)  #
                                      2.5              2.4                 2.2       2.0
 EV/Room (Rs cr)                      3.9              3.5                 2.2       2.2
 EV/Sales (x)                         8.8              9.5                 6.4       4.6   Viraj Nadkarni
                                                                                           Tel: 022 - 4040 3800 Ext: 309
 EV/EBITDA (x)                      28.7             32.9              16.0         11.1
                                                                                           E-mail: virajm.nadkarni@angeltrade.com
 Source: Company, Angel Research; Note: # Excluding revaluation reserves


Please refer to important disclosures at the end of this report
Hotel Leela Venture | Initiating Coverage


                                    Investment Arguments
                                    Hospitality Industry: On the growth path
                                    Foreign Tourist Arrival trend recovering from its lows
The global meltdown and terrorist   During FY2009, the Indian tourism industry had to cope with terrorism and with the
attacks on Mumbai affected the      global economic downturn. This slammed the brakes on a decade of ~9% CAGR
hospitality industry in FY2009      growth in international arrivals (CY1998-2007), which was driven by the successful
                                    'Incredible India' marketing campaign and steady improvements in the tourism
                                    infrastructure.

                                    Exhibit 1: FTAs, Foreign Exchange Earnings (FEE) over CY1998-2009
                                                            6,000                                                                                                                                                            14

                                                            5,000                                                                                                                                                            12
                                     (Number of Tourists)


                                                                                                                                                                                                                             10
                                                            4,000


                                                                                                                                                                                                                                  (US$ bn)
                                                                                                                                                                                                                             8
                                                            3,000
                                                                                                                                                                                                                             6
                                                            2,000
                                                                                                                                                                                                                             4
                                                            1,000                                                                                                                                                            2
                                                                   0                                                                                                                                                         0


                                                                                                                                                                                                                    CY2009
                                                                           CY1998

                                                                                        CY1999

                                                                                                    CY2000

                                                                                                               CY2001


                                                                                                                         CY2002

                                                                                                                                    CY2003

                                                                                                                                               CY2004

                                                                                                                                                            CY2005


                                                                                                                                                                           CY2006

                                                                                                                                                                                        CY2007


                                                                                                                                                                                                      CY2008
                                                                                                  Foreign Tourist Arrivals (in '000) (LHS)                                          FEE (RHS)
                                    Source: Ministry of Tourism, Angel Research

                                    For the Indian hospitality industry, CY2008 began on a reasonably optimistic note;
                                    however, the sentiment reversed completely by the end of the year. The tourism demand
                                    slowed significantly after September 2008, due to dire global economic conditions.
                                    This, coupled with the terrorist attacks in November 2008 in Mumbai, added to the
                                    concerns of the hospitality industry. After the terrorist attacks, the industry recorded
                                    cancellations as high as 20%, particularly in the western region of the country. The
                                    Foreign Tourist Arrivals (FTA) growth decelerated significantly in October 2008,
                                    registering only a marginal rise of 1.8% yoy (13.6% in October 2007). The decline
                                    continued during the year, with FTAs posting a de-growth of 2.1% and 12.5% in
                                    November and December 2008, respectively, thereby ending CY2008 with a 5.6%
                                    growth (against 14.3% in CY2007).

                                    Exhibit 2: Impact of slowdown and terrorist attacks on FTAs in 4QCY2008
                                                            25.0

                                                            20.0

                                                            15.0
                                       FTA Growth (%)


                                                            10.0
                                                                                                                                                                                                      Global slowdown
                                                             5.0                                                                                                                                      & Terrorism
                                                                                                                                                                                                      Impact
                                                             0.0
                                                                                                             April


                                                                                                                                                         August
                                                                                                                                  June
                                                                                                                        May


                                                                                                                                             July
                                                                                                 March


                                                                                                                                                                                    October
                                                                                                                                                                     September
                                                                       January


                                                                                                                                                                                                               December
                                                                                    February


                                                                                                                                                                                                 November


                                                             (5.0)

                                                            (10.0)

                                                            (15.0)
                                                                                                 CY2006-07 (% growth)                                   CY2007-08 (% growth)
                                    Source: Crisil, Angel Research


June 11, 2010                                                                                                                                                                                                                           2
Hotel Leela Venture | Initiating Coverage


FTAs have improved by 15.1% during
FTAs                                    The scenario turned even bleaker for the hospitality industry in CY2009, with FTAs
December        2009-March     2010     declining by 11% during January-May, 2009, as against a growth of 11% in the
(against -12.7% during the comparable   comparable period of the previous year. Over the period of October 2008 to May
period of the previous year).           2009, FTAs declined by 8.3% yoy. However, with India emerging as a frontrunner in
                                        recovering from the global turmoil, signs of improving demand are visible again, with
                                        tourist movement picking up, thereby resulting in improving occupancy rates, which
                                        would consequently be followed by ARRs. The reversal in the trend is apparent from
                                        the fact that FTAs have improved by 15.1% during December 2009-March 2010 (against
                                        -12.7% during the comparable period of the previous year). Moreover, we expect the
                                        recovery in FTAs to speed up over the coming months, on the back of the improving
                                        economic activity and upcoming events like the Commonwealth Games 2010 and the
                                        Cricket Worldcup in India.

                                        Exhibit 3: FTAs on recovery path
                                               25.0                                                                                                       90

                                               20.0                                                                                                       80

                                               15.0                                                                                                       70

                                               10.0                                                                                                       60

                                                5.0                                                                      Tourist Arrival trend            50
                                                                                Global slowdown &                           recoveringg


                                                                                                                                                               (%)
                                        (%)


                                                                                 Terrorism Impact
                                                0.0                                                                                                       40
                                                       Jul-08   Sep-08 Nov-08    Jan-09   Mar-09 May-09     Jul-09   Sep-09 Nov-09   Jan-10      Mar-10
                                               (5.0)                                                                                                      30

                                              (10.0)                                                                                                      20

                                              (15.0)                                                                                                      10

                                              (20.0)                                                                                                      0
                                                                       FTA's growth trend (July 2008- March 2010)       Occupancy rates

                                        Source: Crisil, Angel Research


June 11, 2010                                                                                                                                                    3
Hotel Leela Venture | Initiating Coverage


                                             Demand continues to outstrip supply
                                             Premium room demand expected to record CAGR of 13% over FY2010-13E
Historically, the industry has witnessed a
Historically,                                Currently, India has 1,10,000 hotel rooms, and the estimated shortfall is of 1,50,000
volume growth in premium room                rooms, as per the estimates of the Ministry of Tourism, for 2010. In contrast to this,
                  CAGR
demand at a CAGR of 10.1% over               there are more than 4.3mn rooms in the US, and almost 74,000 in New York City
FY2002-08                                    alone. The impact of such a shortfall will only be accentuated in the future, given the
                                             steady growth in demand and India's emergence as a global economic power (foreign
                                             tourist arrivals rose at a CAGR of 13.7% over CY2004-07). We believe that the
                                             downturn, which began from the second half of CY2008, led to temporary demand
                                             destruction and things have started looking brighter again from 3QFY2010.

                                             Exhibit 4: Demand Driver - FTAs and Growth rates (CY1998-2009P)
                                                       6,000                                                                                                                     30
                                                                                                                                                                                 25
                                                       5,000
                                                                                                                                                                                 20
                                              (’000)


                                                       4,000
                                                                                                                                                                                 15


                                                                                                                                                                                        (%)
                                                       3,000                                                                                                                     10
                                                                                                                                                                                 5
                                                       2,000
                                                                                                                                                                                 0
                                                       1,000
                                                                                                                                                                                 (5)
                                                           0                                                                                                                     (10)


                                                                                                                                                                        CY2009
                                                               CY1998


                                                                        CY1999


                                                                                 CY2000

                                                                                              CY2001

                                                                                                       CY2002

                                                                                                                 CY2003


                                                                                                                          CY2004

                                                                                                                                   CY2005

                                                                                                                                             CY2006


                                                                                                                                                      CY2007

                                                                                                                                                               CY2008
                                                                                          Foreign Tourist Arrivals (LHS)                    Growth (RHS)
                                             Source: Ministry of Tourism, Angel Research

                                             The industry witnessed a tough phase in FY2010, however, signs of recovery are
                                             visible after December 2009, with FTA growth of 21% (10.5%), 16.4% (-17.6%), 9.9%
                                             (-10.6%) and 13% (- 12.9%) during December 2009, January 2010, February 2010
                                             and March 2010 respectively. We expect the demand growth to normalise from
                                             FY2011E. As per industry sources, the growth in the Indian economy is expected to
                                             drive the demand for rooms at a CAGR of 12-14% over the next three to five years.
                                             Historically, the industry has witnessed a volume growth in premium room demand at
                                             a CAGR of 10.1% over FY2002-08. Considering the latest signs of economic revival
                                             and the probability of India emerging out of the current crisis at a faster pace, we
                                             estimate the demand for premium-segment rooms to witness a CAGR of 13% (in line
                                             with Crisil estimates) over FY2010E-13E.

                                             Premium Room Supply expected to record a CAGR of 10.8% over FY2010-13E

Delay in capacity additions to tone down     Over FY2004-08, the total room supply in India, across all classes of hotels, witnessed
supply of rooms                              a CAGR of 5.7%. During the same period, the supply of premium rooms witnessed a
                                             CAGR of 4.4%. Considering the expansion plans announced by several players in the
                                             recent past, it was feared that the industry may witness oversupply concerns in the
                                             near future, and would tone down the ARRs and occupancy levels of hotel players. The
                                             supply over the period FY2009-13E was estimated to witness a CAGR of 18-19%, with
                                             the number of rooms likely to rise from ~32,000 rooms in FY2009 to ~60,000
                                             rooms in FY2013E.


June 11, 2010                                                                                                                                                                             4
Hotel Leela Venture | Initiating Coverage


                                         However, due to the global meltdown, the tight liquidity conditions and a downturn in
                                         the industry, many players have delayed their roll-out plans. We estimate the premium
                                         rooms supply to witness a CAGR of 10.8% over FY2010-13E, to around 45,000
                                         rooms from 33,218 rooms in FY2009.

                                         Exhibit 5: Supply Projections - Premium Segment
                                         Destinations                             FY2010P            FY2011E         FY2012E         FY2013E        CAGR (%)
                                                                                                                                                    CAGR

                                         Business                                   24,797             27,726          30,869          35,156             12.3

                                         Leisure                                      8,421              8,939          9,395           9,991               5.9

                                         Total                                      33,218             36,665         40,264           45,147             10.8
                                         Source: Crisil, Angel Research


To get clarity on occupancy levels, we   Occupancy rates (OR's) to witness uptrend, Average Room Rates (ARR)
have considered three different supply   may follow
scenarios
                                         In order to get clarity on the probable occupancy levels, we have considered three
                                         different supply scenarios. In all the three cases, we have assumed the demand to
                                                    CAGR                FY2010-13E.
                                         witness a CAGR of 13% over FY2010-13E.

                                         Base Case Scenario: In this scenario, we have assumed the most likely demand supply
                                         situation going ahead. We have assumed that supply will witness a CAGR of 10.8%
                                         over FY2010-13E. Based on this assumption, we foresee occupancy levels to climb
                                         back to 73% levels by FY2013E, thereby helping the industry restore its growth trajectory.

                                         Best Case Scenario: Over FY2004-08, the total room supply in India, across all classes
                                         of hotels, witnessed a CAGR of 5.7%. During the same period, the supply of premium
                                         rooms witnessed a CAGR of 4.4%. In our Best case scenario, we have assumed the
                                         supply to witness a CAGR at its historical pace of around 4.5%. On this assumption,
                                         we foresee occupancy levels to surge to 90% levels by FY2013E. We expect this scenario
                                         to be less likely in the future.

                                         Worst Case Scenario: Under this scenario, we have assumed supply witnessing a
                                         CAGR of 15% outpacing demand growth. On this assumption we foresee occupancy
                                         levels to significantly decline to 61% levels by FY2013E, thereby affecting the profitability
                                         of hotel players. We expect this scenario to be highly improbable in the future.

                                         Exhibit 6: Occupancy levels: Sensitivity Analysis
                                                           40,000                                                                                         90
                                                           35,000                                                                                         85
                                                           30,000
                                                                                                                                                          80
                                          (No. of Rooms)


                                                           25,000
                                                                                                                                                          75
                                                                                                                                                               OR (%)


                                                           20,000
                                                                                                                                                          70
                                                           15,000
                                                                                                                                                          65
                                                           10,000

                                                            5,000                                                                                         60

                                                               -                                                                                          55
                                                                              FY2011E                      FY2012E                    FY2013E
                                                                    Room Demand @ 13% growth                         Base Case-Occupancy @ 10.8% supply growth
                                                                    Best Case- Occupancy @ 4.5% supply growth        Worst Case- Occupancy @ 16% supply growth

                                         Source: Angel Research


June 11, 2010                                                                                                                                                       5
Hotel Leela Venture | Initiating Coverage


                                        Improving industry dynamics to boost HLVL's performance

Occupancy levels on rise; ARRs may      Currently, HLVL has six operational hotels within the country (Mumbai, Bangalore,
follow in the coming months             Goa, Kovalam, Udaipur and Gurgaon), and has an inventory of around 1,190 owned
                                        rooms and 409 rooms under management contract (in Gurgaon). The signs of revival
                                        in demand can be witnessed from the fact that HLVL's properties in Mumbai and
                                        Bangalore (currently contributing ~62% to HLVL's revenues) enjoyed occupancies
                                        between 70-80% during 4QFY2010, a marked improvement from ~55-65% during
                                        4QFY2009. Moreover, with ARRs firming up recently, our view of firm positive changes
                                        happening in the industry (benefiting HLVL in turn) has been further bolstered.

                                        Exhibit 7: HLVL - ARR and OR trends
                                               14,000    76              75                                                          80
                                                                                                                   70        71
                                                                                         65                                          70
                                               12,000                                                63
                                                                                                                                     60
                                               10,000
                                                                                                                                     50
                                                8,000
                                        (Rs)


                                                                                                                                          (%)
                                                                                                                                     40
                                                6,000
                                                                                                                                     30
                                                4,000
                                                                                                                                     20
                                                2,000                                                                                10

                                                   0                                                                                 0
                                                        FY2007      FY2008            FY2009        FY2010      FY2011E    FY2012E
                                                                              ARR's (in Rs) (LHS)      OR's (in %) (RHS)
                                        Source: Crisil, Angel Research

                                        We believe the ongoing recovery trend in ARR’s and OR’s to continue and stabilize
                                        going ahead. We expect HLVL to witness a surge in OR's from 63% in FY2010 to 70%
                                        and 71% in FY2011E and FY2012E respectively. Although the old properties are
                                        expected to witness OR's above 70% levels, the upcoming properties in New Delhi
                                        and Chennai would take time to stabilize thereby toning down the overall OR's. We
                                        expect HLVL's properties to witness ARR growth of ~8-9% in FY2011E and FY2012E
                                        as stabilizing OR's would enable the company to gradually increase its ARR's.
                                        Considering the changing scenario, we estimate HLVL's Revenues to witness a CAGR
                                        of 41.6% over FY2010-12E.

                                        Major destinations catered to by HLVL
                                        Bangalore
Supply in Bangalore would rise at a     The Bangalore hospitality market has around 7,824 rooms in the 3-star and above
CAGR               FY2009-13E,
CAGR of 27.4% over FY2009-13E, from     categories. The market is skewed toward 3-star category rooms, which have the highest
2,558 rooms in FY2009 to around 6,461   concentration at ~49% of the total inventory. Premium segment rooms constitute ~33%
rooms in FY2013E                        of the total, while the balance is the share of the 4-star category rooms. Prior to the
                                        global meltdown, it was estimated that the supply in Bangalore would rise at a CAGR
                                        of 27.4% over FY2009-13E, from 2,558 rooms in FY2009 to around 6,461 rooms in
                                        FY2013E. However, with several players delaying and cancelling their plans, Bangalore
                                        is estimated to have around 4,554 rooms by FY2013E, a shortfall of 29% over the
                                        earlier projection. This, we believe, would result in the firming up of the ORs and ARRs
                                        in the city, going ahead.


June 11, 2010                                                                                                                                   6
Hotel Leela Venture | Initiating Coverage


                                     Exhibit 8: HLVL Bangalore - ARR and OR trends
                                             18,000                                                                    72      74
                                                       71                                                71
                                             16,000                                                                            72

                                             14,000                                                                            70
                                                                                                                               68
                                             12,000
                                                                                         64                                    66
                                             10,000


                                     (Rs)


                                                                                                                                    (%)
                                                                                                                               64
                                              8,000
                                                                       60                                                      62
                                              6,000
                                                                                                                               60
                                              4,000                                                                            58
                                              2,000                                                                            56
                                                 0                                                                             54
                                                      FY2008      FY2009               FY2010         FY2011E        FY2012E
                                                                       ARR's (in Rs) (LHS)       OR's (in %) (RHS)
                                     Source: Company, Angel Research

                                     HLVL's Bangalore property has witnessed a de-growth in ARRs to the tune of 32.1%
                                     yoy in FY2010, with ORs at ~63% levels. Further, we expect the ARRs and ORs to see
                                     a northward trajectory from FY2011E onward. We expect the ARRs to witness an 8%
                                     and 9% surge in FY2011E and FY2012E respectively, and ORs to rise to 71% and 72%
                                     in FY2011E and FY2012E, respectively. We have built in conservative estimates in
                                     ARR growth, despite ORs reaching close to the FY2008 peak levels, mainly considering
                                     the revised estimates of additional supply coming up at a CAGR of 16.7% over
                                     FY2009-12E (earlier industry estimate of 27.4%), which may lead to price competition.

                                     North Mumbai

Mumbai is estimated to have around   North Mumbai is predominantly a business destination. Its proximity to the international
                          (CAGR
7,081 rooms by FY2013E (CAGR of      airport, coupled with the emergence of business districts like the Bandra Kurla Complex
9.4% over FY2009-13E)                (BKC), Andheri, Powai and Malad (Mindspace), has heightened the attractiveness of
                                     this region for players. Premium hotels constitute nearly 65% of the hotel rooms in
                                     North Mumbai, primarily due to the relatively higher cost of land in this region. Prior
                                     to the global meltdown, it was estimated that the supply in North Mumbai would rise
                                     at a CAGR of 15.2% over FY2009-13E, from 4,941 rooms in FY2009 to 8,709 rooms
                                     in FY2013E. However, with several players delaying and cancelling their plans, Mumbai
                                     is estimated to have around 7,081 rooms by FY2013E (CAGR of 9.4% over
                                     FY2009-13E), a shortfall of 18.7% over the earlier projection. This, we believe, would
                                     result in the firming up of ORs and ARRs, going ahead.

                                     Exhibit 9: HLVL Mumbai - ARR and OR trends
                                             14,000                                                                            90
                                                        80
                                                                                                         73            75      80
                                             12,000                    68                66
                                                                                                                               70
                                             10,000
                                                                                                                               60
                                              8,000                                                                            50
                                      (Rs)


                                                                                                                                    (%)


                                              6,000                                                                            40
                                                                                                                               30
                                              4,000
                                                                                                                               20
                                              2,000
                                                                                                                               10
                                                  0                                                                            0
                                                      FY2008      FY2009               FY2010         FY2011E        FY2012E
                                                                   ARR's (in Rs) (LHS)          OR's (in %) (RHS)

                                     Source: Company, Angel Research


June 11, 2010                                                                                                                         7
Hotel Leela Venture | Initiating Coverage


                                            HLVL's Mumbai property has witnessed a de-growth in ARRs to the tune of 24.6% yoy
                                            in FY2010, with ORs at ~66% levels. Further, we expect the ARRs and ORs to see a
                                            northward trajectory from FY2011E onward. We expect HLVL to witness a rebound of
                                            9% in ARRs on a yoy basis in FY2011E and FY2012E respectively, while ORs to rise to
                                            73% and 75% in FY2011E and FY2012E, respectively.

                                            Goa

Goa is the only exception among the key     Goa is one of the most popular tourist destinations in India. Goa had 3,255 rooms in
cities in India, where supply is expected   FY2009 in the premium category segment, and, of these, 71% are located in South
                  pre-global
to exceed the pre -global meltdown          Goa. Goa is the only exception among the key cities in India where supply is expected
estimates                                   to exceed the pre-global meltdown estimates. Premium room supply is expected to
                                            witness a CAGR of 4.4% over FY2009-13E (earlier industry estimates were of a CAGR
                                            of 2.1%). Demand in Goa is estimated to be robust going ahead, as it is one of the
                                            prime leisure destinations and a hot-spot for foreign as well as domestic tourists.
                                            Demand is expected to be higher than the estimated supply, going ahead, and we
                                            expect ORs and ARRs to firm up from FY2011E onward.

                                            Exhibit 10: HLVL Goa- ARR and OR trends
                                                    12,500                                                                         76
                                                              74                                                           74
                                                                                                                                   74
                                                    12,000                                                     72
                                                                                                                                   72
                                                    11,500                                      69                                 70
                                                    11,000                                                                         68
                                             (Rs)


                                                                                                                                        (%)
                                                    10,500                    64                                                   66
                                                                                                                                   64
                                                    10,000
                                                                                                                                   62
                                                    9,500
                                                                                                                                   60
                                                    9,000                                                                          58
                                                             FY2008      FY2009             FY2010          FY2011E      FY2012E
                                                                          ARR's (in Rs) (LHS)        OR's (in %) (RHS)
                                            Source: Company, Angel Research


                                            HLVL's Goa property to has witnessed a marginal de-growth in ARRs to the tune of
                                            1.3% yoy in FY2010, with ORs at ~69% levels. Going ahead, we expect the ARRs to
                                            witness a 9% surge in FY2011E and FY2012E each, and ORs to rise to 72% and 74%
                                            in FY2011E and FY2012E, respectively.

                                            Kovalam

                                            Kovalam is one of the main leisure tourist attractions in Kerala, and enjoys the highest
                                            ARRs and ORs during the tourist season from November to March. HLVL purchased its
                                            Kovalam property in 1994, prior to which it was owned and managed by the Kerala
                                            Tourism Development Corporation. It is a 194-room hotel, spread across 84 acres
                                            and is situated on a hillock facing the sea near Trivandrum in Kerala.


June 11, 2010                                                                                                                             8
Hotel Leela Venture | Initiating Coverage


                Exhibit 11: HLVL Kovalam - ARR and OR trends
                        9,000                                                                             74     75
                        8,000                                                                                    74
                        7,000
                                                                                                                 73
                        6,000
                        5,000                                                                                    72


                 (Rs)


                                                                                                                      (%)
                                   71              71
                        4,000                                                                                    71
                                                                       70              70
                        3,000
                                                                                                                 70
                        2,000
                                                                                                                 69
                        1,000
                            0                                                                                    68
                                 FY2008          FY2009           FY2010            FY2011E            FY2012E
                                                 ARR's (in Rs) (LHS)          OR's (in %) (RHS)

                Source: Company, Angel Research

                HLVL's Kovalam property has witnessed a marginal de-growth in ARRs of 1.8% yoy in
                FY2010, with ORs being maintained at ~70% levels. We expect the Kovalam property
                to witness a surge of 8% and 9% in ARRs in FY2011E and FY2012E, respectively while
                ORs to rise to 70% and 74% in FY2011E and FY2012E, respectively.

                Udaipur

                Udaipur is one of India's foremost leisure and conference destinations, equally popular
                with both domestic and international tourists. HLVL launched its property consisting of
                86 rooms in Udaipur in 2QFY2010. We believe that HLVL's Udaipur property would
                have witnessed lower ARRs and ORs in FY2010, since this is the first year of its
                operations. Going ahead, we expect the ARRs to witness an 8% surge in FY2011E and
                FY2012E each, and ORs to rise to 65% and 70% in FY2011E and FY2012E, respectively.

                Exhibit 12: HLVL Udaipur - ARR and OR trends
                        26,000                                                                                   80
                                                                                                     70
                                                                         65                                      70
                        25,000
                                                                                                                 60
                        24,000
                                                                                                                 50
                        23,000
                (Rs)


                                                                                                                      (%)

                                                                                                                 40
                        22,000
                                                                                                                 30
                        21,000
                                          12                                                                     20
                        20,000                                                                                   10

                        19,000                                                                                   0
                                        FY2010                    FY2011E                          FY2012E
                                                   ARR's (in Rs) (LHS)         OR's (in %) (RHS)
                Source: Company, Angel Research

                Gurgaon

                Gurgaon is primarily a business destination, with the presence of industries such as
                IT/ITeS, auto and automotive components. Various real estate players like DLF Unitech
                                                                                             ,
                and Parsvanath have planned IT parks and SEZs, which will further enhance the demand
                in the city. Traditionally, hotels in Gurgaon have enjoyed higher ARRs and ORs, due to
                a significant demand-supply mismatch. However, going ahead, the ARRs


June 11, 2010                                                                                                               9
Hotel Leela Venture | Initiating Coverage


                and ORs are likely to get toned down, due to supply coming up at an estimated CAGR
                of 36.7% (earlier estimates were 57.3%) over FY2009-13E. As per the revised estimates,
                the number of premium category rooms in Gurgaon is likely to go up from 578 rooms
                in FY2009 to 2,021 rooms in FY2013E.

                HLVL's launched its property in Gurgaon (409 rooms operational in April 2009) via a
                management contract agreement with the Ambience group. This is the first property
                operated by the company under the management contract arrangement. Since the
                property is under management contract, it is expected to contribute only 2-3% to the
                overall revenues.

                Exhibit 13: HLVL Gurgaon - ARR and OR trends

                        12,000                                                                         71
                                                                                              70
                        11,500                                                                         70
                        11,000                                                                         69
                                                                    68
                        10,500
                                                                                                       68
                        10,000
                                                                                                       67
                 (Rs)


                                                                                                            (%)
                         9,500
                                                                                                       66
                         9,000       65
                                                                                                       65
                         8,500
                         8,000                                                                         64

                         7,500                                                                         63
                         7,000                                                                         62
                                    FY2010                     FY2011E                       FY2012E
                                              ARR's (in Rs) (LHS)        OR's (in %) (RHS)

                Source: Company, Angel Research

                HLVL’s Gurgaon property witnessed lower ARRs and ORs in FY2010, since it was the
                first year of its operations. Going ahead, we expect the ARRs to witness a growth of 5%
                and 3% in FY2011E and FY2012E, respectively, and ORs to rise to 68% and 70% in
                FY2011E and FY2012E, respectively.


June 11, 2010                                                                                                10
Hotel Leela Venture | Initiating Coverage


                                                        New property additions to diversify geographical risk
Geographical diversification to reduce                  Traditionally, HLVL's revenue has been primarily dependent on the Bangalore and
dependence on Bangalore and Mumbai                      Mumbai properties, as these constituted around 69% of its total room inventory and
                                                        contribute around 76% to its total revenues in FY2009. Overdependence on these
                                                        markets also exposed the company to area risk, as any adverse event in any of these
                                                        cities can seriously hamper HLVL's financials. In order to mitigate the risk and to tap
                                                        new geographies, HLVL expanded its presence in Gurgaon (409 rooms operational in
                                                        April 2009) via a management contract agreement with the Ambience group, and
                                                        also added Udaipur property (81 rooms, operational in May 2009) to its portfolio.
                                                        These additions have brought down the share of the Mumbai and Bangalore properties,
                                                        in terms of room inventory concentration.

Exhibit 14: City-wise rooms presence (FY2010)                                 Exhibit 15: City-wise revenue contribution (FY2010)
                                                                                               Udaipur, 3%             Gurgaon, 3%


                                                                                        Kovalam, 13%

                                                                                                                       Goa, 18%
                                     Bangalore, 22%
                  Gurgaon, 25%


                       r, 5%
                Udaipu
                               1%         Mumbai, 24%
                          ,1                                                                       Bangalore, 33
                                                                                                                        Mumbai, 29%
                        am
                    val                                                                                 %
                  Ko

                               Goa, 12%


Source: Company, Angel Research                                                Source: Company, Angel Research

                                                        However, as the Gurgaon property is under management contract, it is expected to
                                                        contribute only ~2% to the overall revenues, while the company-owned Udaipur
                                                        property (consisting of only 81 rooms) contributed ~3% in FY2010, since its the first
                                                        year of its operation . Hence, even though the company's geographical presence has
                                                        widened, HLVL’s Mumbai and Bangalore properties have contributed ~62% (combined)
                                                        of the total revenue in FY2010.

HLVL has chalked out an expansion plan
HLVL                                                    We expect significant delta in terms of diversification, both geographically and
                  Phase-I,
in two phases. In Phase-I, the company                  financially, to take effect from 2QFY2011E, as HLVL has chalked out an expansion
plans to launch hotels in Delhi and                     plan in two phases. In Phase-I, the company plans to launch hotels in Delhi and
Chennai                                                 Chennai, for which the work has already commenced. The Delhi property comprising
                                                        of 290 rooms, catering primarily to the business segment, is scheduled to be launched
                                                        in July 2010, a few months before the start of the Commonwealth Games (to be held
                                                        from October 2010 onwards). The 340-room Chennai property, catering primarily to
                                                        the business segment, is expected to get operational in 1QFY2012E. Moreover, in
                                                        case of HLVL's Udaipur property which commenced operations in 2HFY2010, FY2011E
                                                        will be the first year of full operations (estimated to contribute 10% to total revenues in
                                                        FY2012E), thereby resulting in further diversification of revenues. With the new
                                                        properties getting operational, HLVL's concentration in Mumbai and Bangalore, both
                                                        in terms of room inventory and revenue contribution, will get diluted substantially,
                                                        (33% in Room Inventory terms and 40% in revenue contribution terms including
                                                        Gurgaon) thereby de-risking HLVL's business model.


June 11, 2010                                                                                                                                   11
Hotel Leela Venture | Initiating Coverage


Exhibit 16: HLVL: City-wise rooms presence (FY2012E)                                   Exhibit 17: HLVL: City-wise Revenue Contribution (FY2012E)

                                                                                                           Chennai, 8%

                                                                                                                         Goa, 11%
                 Chennai, 15%           Bangalore,
                                           16%

                                                                                                       New
               New                                                                                  Delhi, 23%
            Delhi, 13%                                                                                                        Mumbai, 19%
                                                    Mumbai, 18%


              Gurgaon, 18%                                                                  Gurgaon, 2%
                                       Kov


                                                                                                                         Bangalore, 21%
                               r, 4%


                                                    Goa, 8%
                                           alam


                                                                                                Udaipur, 10%
                             Udaipu


                                             8% ,


                                                                                                          Kovalam, 7%


Source: Company, Angel Research                                                        Source: Company, Angel Research


               HLVL
In Phase -II, HLVL plans to launch                                In Phase-II of the expansion, HLVL plans to launch properties in Agra, Hyderabad and
properties in Agra, Hyderabad and Pune                            Pune. Although the company has already acquired land at these locations, we expect
                                                                  the work on the same to commence post-FY2012E. We have not factored in Phase-II
                                                                  expansion plans in our calculations.


June 11, 2010                                                                                                                                      12
Hotel Leela Venture | Initiating Coverage


                                                                     Financial Outlook
                                                                     Tough year behind us; Recovery expected from FY2011E
New Delhi and Chennai properties to                                  During FY2007 and FY2008, HLVL's revenues rose by 17% and 36.3% respectively,
      top-line
drive top-line growth                                                driven mainly by favorable industry dynamics. However, HLVL witnessed de-growth of
                                                                     12.4% in its top-line in FY2009, as the global meltdown started talking its toll on the
                                                                     industry's fortunes in 2HFY2009, which was further aggravated by terrorist attacks in
                                                                     November 2008 in Mumbai. This resulted in pulling down the revenue CAGR over
                                                                     FY2006-09 to 11.8%.

                                                                     HLVL witnessed declines in the ARRs and ORs across its properties, thereby negatively
                                                                     affecting its top-line till 2QFY2010. Although signs of recovery were visible from
                                                                     December 2009, HLVL's top-line witnessed a dip of 7.2% yoy in FY2010, as lower
                                                                     ORs and ARRs were witnessed for a major part of the year.

                                                                     On the back of 31.5% CAGR growth in occupied rooms and 6.8% CAGR growth in
                                                                     ARR's over FY2010-12E, we expect HLVL's top-line to post a CAGR of 41.6% over
                                                                     FY2010-12E, from Rs436.2cr in FY2010 to Rs874.1cr in FY2012E. Apart from the
                                                                     changing dynamics of the industry resulting in higher ORs and ARRs in the future,
                                                                     growth will also be driven by the new properties (New Delhi and Chennai) of the
                                                                     company coming on stream and the recently-launched properties (Udaipur and
                                                                     Gurgaon) stabilising, as FY2010 has been their first year of operations.

Exhibit 18: HLVL - ARR and OR trends                                                              Exhibit 19: Sales trend

       14,000    76        75                                                          80                1,000                                           44.9                 50.0
                                                                     70        71
                                                                                                           900    36.2                                               38.3
                                           65                                          70                                                                                     40.0
       12,000                                          63
                                                                                                           800
                                                                                       60                                                                                     30.0
       10,000                                                                                              700
                                                                                                   (Rs cr)


                                                                                       50                  600                                                                20.0


                                                                                                                                                                                       (%)
        8,000
                                                                                                           500
(Rs)


                                                                                            (%)


                                                                                       40
        6,000                                                                                              400                                                                10.0
                                                                                       30
                                                                                                           300                             (7.2)                              -
        4,000
                                                                                       20                  200              (12.4)
        2,000
                                                                                                                                                                              (10.0)
                                                                                       10                  100
           0                                                                           0
                                                                                                             0                                                                (20.0)
                FY2007   FY2008         FY2009        FY2010      FY2011E    FY2012E                             FY2008    FY2009         FY2010       FY2011E      FY2012E
                                ARR's (in Rs) (LHS)      OR's (in %) (RHS)                                                   Net Sales (LHS)       Growth % (RHS)
Source: Crisil, Angel Research                                                                    Source: Company, Angel Research

                                                                     Operating Leverage to boost OPM; interest cost to hit bottom-line
                                                                     Due to the fixed cost structure of the hotel business, players benefit significantly in the
                                                                     up-cycle of ARRs and ORs, while margins erode faster in the down-cycle. During
                                                                     FY2006-08, HLVL witnessed robust EBITDA margins within a range of 42-47%. However,
                                                                     with the slowdown in demand after 2HFY2009, the EBITDA margins for HLVL contracted,
                                                                     and ended FY2009 with a 1,200bp decline (from 42.8% in FY2008 to 30.8% in
                                                                     FY2009). In the case of HLVL, almost 50% of its expenditure consists of fixed costs,
                                                                     which take a toll on the company's profitability during a downturn. With revenues over
                                                                     FY2010-12E expected to rise at a CAGR of 41.6%, we expect HLVL's EBITDA to witness
                                                                     a CAGR of 69.4% over FY2010-12E. Operating margins are expected to rise from
                                                                     29% in FY2010 to 40.3% and 41.6% in FY2011E and FY2012E, respectively.


June 11, 2010                                                                                                                                                                        13
Hotel Leela Venture | Initiating Coverage


We expect the Adjusted PAT to witness a
                       PA                 On the bottom-line front, we expect the Adjusted PAT to witness a CAGR of 57.9%
CAGR
CAGR of 33.3% over FY2010-12E             over FY2010-12E, from Rs41cr in FY2010 to Rs102.3cr in FY2012E. The PAT growth
                                          is expected to be lower than EBIDTA growth mainly due to surge in the depreciation
                                          and interest costs due to its high debt-levels and ongoing expansion plans.

                                          Exhibit 20: Profitability trend
                                                     400                                                                                      45
                                                                42.8                                                                   41.6
                                                     350                                                               40.3                   40

                                                     300                                                                                      35
                                                                              30.8                                                            30
                                                     250                                            29.0
                                           (Rs cr)

                                                                                                                                              25


                                                                                                                                                   (%)
                                                     200
                                                                19.4                                                                          20
                                                     150
                                                                                                                       11.9          11.7     15
                                                                                                   9.4
                                                     100                      8.2                                                             10
                                                      50                                                                                      5
                                                      0                                                                                       0
                                                           FY2008         FY2009            FY2010             FY2011E          FY2012E
                                                               EBITDA (LHS)        Adj PAT (LHS)           OPM (RHS)          PATM (RHS)
                                          Source: Company, Angel Research


                                          Fund raising on the cards

                                          HLVL has been on an expansion mode over a past few years and have added significant
                                          debt (including FCCB’s) on its balance-sheet to fund its expansion plans. The debt-
                                          equity ratio of the company including revaluation reserve of Rs1237cr in FY2010
                                          stands at 1.2x as on FY2010 (3.3x excluding revaluation reserve).

                                          Recently, HLVL has approved a proposal to raise funds of up to Rs750cr to reduce
                                          debt and also to part-finance expansion plans. The funds will be raised through a mix
                                          of issue of equity shares via Qualified Institutional Placement (QIP) and/or FCCBs.
                                          The board has decided to issue Rs350cr through the QIP while the rest may be raised
                                                                                                     ,
                                          through the issue of FCCBs. We estimate the company to utilize the part of QIP funds
                                          to retire the FCCB maturing in September 2010 (convertible at the rate of Rs47 and
                                          having a redemption clause set at 125%) since the chances of the FCCB getting
                                          converted appear bleak. The balance amount from the QIP and the entire amount
                                          from FCCB are likely to be utilized for the company's upcoming New Delhi and Chennai
                                          property. We have not factored in these developments in our projections as the funds
                                          are still to be raised. However, raising funds by QIP route would dilute the company's
                                          future earnings while issue of additional FCCB's is likely to leave the debt-equity levels
                                          (including revaluation reserves) unchanged at 1.1x in FY2012E.


June 11, 2010                                                                                                                                      14
Hotel Leela Venture | Initiating Coverage


                Concerns
                Equity Dilution: HLVL has plans to raise additional funds for expansion and retirement
                of debt through QIP/FCCB in near future. Action on the aforesaid front may lead to
                equity dilution which may inturn dilute our earning estimates.

                Delays in execution of projects: Since our future revenue projections are based on
                new room additions, any further delays in upcoming properties would impact revenue
                estimates and, consequently, affect the profitability.

                Ongoing European crisis: The ongoing European crisis may affect the hotel industry
                in India, as FTAs from Western Europe constitute ~30-33% of the total FTAs in India.
                Any aggravation of the financial crisis, going ahead, may affect the performance of
                the premium segment hoteliers in India.

                Rising terrorist activities: The travel and tourism industry is highly sensitive to risks
                arising from terrorist activities. In the past, attacks on the Parliament and bomb blasts
                across some of the key metro cities badly affected tourist sentiment. A recent example
                is the 26/11 terror attack at the Taj Mahal Hotel and the Hotel Trident in Mumbai.
                After this attack, foreign tourist arrivals (FTAs) to India have reduced drastically. Hence,
                such terror attacks make travel, especially leisure travel, more difficult, resulting in
                delays/cancellations by tourists.


June 11, 2010                                                                                            15
Hotel Leela Venture | Initiating Coverage


                                                                                                                                                            Outlook and Valuation
                                                                                                                                                            The global economic meltdown, along with the terrorist attacks in India, affected the
                                                                                                                                                            hospitality industry, and the hotel players were facing the heat through lower ARRs
                                                                                                                                                            and ORs till 2QFY2010. However, as the business sentiment gathered steam, with the
                                                                                                                                                            overall decent performance by India Inc, coupled with the tourist season that
                                                                                                                                                            commenced in 3QFY2010, the dynamics of the industry seem to be changing. ORs,
                                                                                                                                                            which were hovering ~60-62% levels in major cities in India in 2QFY2010, have
                                                                                                                                                            already surpassed 70% levels in 3QFY2010 and have sustained those leves in
                                                                                                                                                            4QFY2010. With ORs stabilising, the next logical move from hoteliers will be a hike in
                                                                                                                                                            the ARRs, resulting in a revival in their financials. The data of foreign tourist arrivals
                                                                                                                                                            (FTAs) in India during December 2009-March 2010 further fortifies our belief of a
                                                                                                                                                            reversal in the trend. The month of December 2009 recorded the highest number of
                                                                                                                                                            foreign tourist arrivals (in absolute terms) in the last 5 years, registering a rise of 21%
                                                                                                                                                            yoy, while in January 2010, February 2010 and March 2010, FTAs rose by 16.4%,
                                                                                                                                                            9.9% and 13% yoy, respectively. We believe that this provides a clear indication of the
                                                                                                                                                            good times that lie ahead for the hoteliers.

                                                                                                                                                            Although HLVL’s financials are currently on the verge of recovery, we believe that
                                                                                                                                                            EV/Room is the ideal parameter for valuing the company, considering the debt on its
                                                                                                                                                            books. At the CMP HLVL trades at an FY2012E EV/Room of Rs2.2cr, which is higher
                                                                                                                                                                             ,
                                                                                                                                                            than the company's replacement cost of ~Rs1.8-2cr. Moreover, at current valuations,
                                                                                                                                                            HLVL is expensive as compared to its peers. Among the mid-cap hotel players, we
                                                                                                                                                            favour TAJGVK over HLVL, due to its superior financials and robust growth outlook.
                                                                                                                                                            Hence, considering the risk-reward, we Initiate Coverage on the stock with a Neutral
                                                                                                                                                            view.
                                                                                                                                                            view.
Exhibit 21: Peer valuation
                                            Mcap                       EV/Room (Rs cr)                                                  P/E (x)                                          P/B (x) #                           EV/Sales (x)                                   EV/EBITDA (x)
                                                                                                                                                                                                                                                                            EV/EBITDA                                                                    RoE (%) #                                             RoCE (%) #
                                           (Rs cr)                     FY11E                    FY12E FY11E                                       FY12E                        FY11E FY12E FY11E FY12E FY11E FY12E                                                                                                                      FY11E                              FY12E FY11E                                                     FY12E
        TAJGVK                                      966                          1.1                    1.0                17.2                      12.7                            2.8                     2.4             3.7                      3.1                           9.2                              7.2                        17.7                            20.3                           20.3                            23.5
        HLVL                               1,738                                 2.7                    2.2                23.2                      17.0                            2.2                     2.0             6.4                      4.6                        16.0                         11.1                                  9.8                         12.2                               5.3                              8.3
        IHCL*                              7,257                                 1.4                    1.2               46.8                      23.3                             2.5                     2.3             3.5                               3                 14.9                         11.1                                  4.5                             9.1                            6.2                              9.7
Source: Bloomberg, Angel Research; Note: #Excluding revaluation reserves for HLVL, *Indian Hotels Ltd’s EV/Room reflective of domestic operations


Exhibit 22: One-year forward P/E Band                                                                                                                                                                              Exhibit 23: EV/Room Band
                   120                                                                                                                                                                                                        5.0
                                                                                                                                                                                                                              4.5
                   100                                                                                                                                                                                                        4.0
                                                                                                                                                                                                                              3.5
                    80                                                                                                                                                                                                        3.0
Share Price (Rs)


                                                                                                                                                                                                                   (Rs cr)


                                                                                                                                                                                                            36x
                                                                                                                                                                                                                              2.5
                    60
                                                                                                                                                                                                            29x               2.0

                                                                                                                                                                                                            22x               1.5
                    40
                                                                                                                                                                                                                              1.0
                                                                                                                                                                                                            15x
                    20
                                                                                                                                                                                                                              0.5
                                                                                                                                                                                                                              0.0
                                                                                                                                                                                                                                             Jul-04


                                                                                                                                                                                                                                                                                 Jul-05


                                                                                                                                                                                                                                                                                                                     Jul-06


                                                                                                                                                                                                                                                                                                                                                         Jul-07


                                                                                                                                                                                                                                                                                                                                                                                             Jul-08


                                                                                                                                                                                                                                                                                                                                                                                                                                  Jul-09
                                                                                                                                                                                                                                    Apr-04


                                                                                                                                                                                                                                                      Oct-04
                                                                                                                                                                                                                                                               Jan-05
                                                                                                                                                                                                                                                                        Apr-05


                                                                                                                                                                                                                                                                                          Oct-05
                                                                                                                                                                                                                                                                                                   Jan-06
                                                                                                                                                                                                                                                                                                            Apr-06


                                                                                                                                                                                                                                                                                                                              Oct-06
                                                                                                                                                                                                                                                                                                                                       Jan-07
                                                                                                                                                                                                                                                                                                                                                Apr-07


                                                                                                                                                                                                                                                                                                                                                                  Oct-07
                                                                                                                                                                                                                                                                                                                                                                           Jan-08
                                                                                                                                                                                                                                                                                                                                                                                    Apr-08


                                                                                                                                                                                                                                                                                                                                                                                                      Oct-08
                                                                                                                                                                                                                                                                                                                                                                                                                Jan-09
                                                                                                                                                                                                                                                                                                                                                                                                                         Apr-09


                                                                                                                                                                                                                                                                                                                                                                                                                                           Oct-09
                                                                                                                                                                                                                                                                                                                                                                                                                                                    Jan-10
                                                                                                                                                                                                                                                                                                                                                                                                                                                             Apr-10


                    0
                                           Dec-04


                                                                        Dec-05


                                                                                                    Dec-06


                                                                                                                               Dec-07


                                                                                                                                                             Dec-08


                                                                                                                                                                                          Dec-09
                         Apr-04

                                  Aug-04


                                                     Apr-05

                                                              Aug-05


                                                                                  Apr-06

                                                                                           Aug-06


                                                                                                             Apr-07

                                                                                                                      Aug-07


                                                                                                                                         Apr-08

                                                                                                                                                   Aug-08


                                                                                                                                                                      Apr-09

                                                                                                                                                                                Aug-09


                                                                                                                                                                                                   Apr-10


                                                                                                                                                                                                                                                                                                                EV/Room                                   Average EV/Room
Source: Company, Angel Research                                                                                                                                                                                    Source: Company, Angel Research


June 11, 2010                                                                                                                                                                                                                                                                                                                                                                                                                                                16
Hotel Leela Venture | Initiating Coverage


                Company Background
                Hotel Leela Venture is one of the leading players in the Indian hospitality industry. The
                company is in the business of owning and operating five star deluxe hotels in the
                country, and caters to both, the leisure and business sectors. The company presently
                operates six hotels within the country (in Mumbai, Bangalore, Goa, Kovalam, Udaipur
                and Gurgaon), and has an inventory of around 1,190 owned rooms and 409 rooms
                under management contracts (in Gurgaon). The company has a management alliance
                with Kempinski Hotels for its hotels in India. The company has expansions plans lined
                up in the near future, with new properties in New Delhi and Chennai expected in
                FY2011E.

                Property-wise Details

                Until FY2009, HLVL had 4 operational properties at Mumbai, Bangalore, Goa and
                Kovalam, with an inventory of around 1,076 rooms. Recently, the company's Gurgaon
                property (in 1QFY2010) and its Udaipur property (in 1QFY2010) became operational,
                thereby spreading HLVL's presence to six locations in India, with around 1,600 rooms
                in its inventory.

                Exhibit 24: HLVL’s Properties
                Name                               Star rating   No. of rooms                     Status
                The Leela Kempinski, Mumbai                5D              390                  Owned
                The Leela Kempinski, Bangalore             5D              352                  Owned
                The Leela Kempinski, Goa                   5D              185                  Owned
                The Leela Kempinski, Kovalam               5D              182                  Owned
                The Leela Kempinski, Gurgaon               5D              409   Management Contract
                The Leela Kempinski, Udaipur               5D               81                  Owned
                Source: Company, Angel Research

                The company has an ambitious expansion strategy, and plans to spread its presence
                in New Delhi, Chennai, Pune, Hyderabad and Agra. The construction work in New
                Delhi and Chennai is at an advanced stage, and the properties are likely to be
                operational in FY2011E. With respect to the Pune, Hyderabad and Agra plans, HLVL
                has already acquired land for the same, and is expected to commence work after the
                completion of the New Delhi and Chennai properties


June 11, 2010                                                                                         17
Hotel Leela Venture | Initiating Coverage


                Annexure
                Indian Hotel Industry Overview

                The hotel industry in India was on a dream run during CY2004-08, with Occupancy
                rates (ORs) and Average Room Rates (ARRs) rising steadily due to the demand for
                rooms outstripping their supply. However, in the past year, the Indian (as well as the
                global) economy witnessed a very high degree of uncertainty and volatility. The
                slowdown in developed economies, resulted in a contraction in their GDP for the first
                time since World War II. The effects also spread to major emerging markets, such as
                China, India and Brazil, affecting several sectors including hospitality. According to
                the Travel and Tourism Competitiveness Report, 2009, brought out by the World
                Economic Forum, India is ranked 11th in the Asia-Pacific region and 62nd overall in
                a list of 133 assessed countries in 2008, up three places since 2007. In terms of
                travel, India stands 9th in the index of relative cost of access (ticket taxes and airport
                charges) to international air transport services, having among the lowest costs in the
                world. India also ranks second in medical tourism. The domestic tourism industry has
                a huge untapped potential, considering its land-mass, the diversity of its various locales
                and a roaring economy, which attract all types of tourists. Currently, India's share in
                the global tourism industry is just 1.2%. Meanwhile, the contribution of travel and
                tourism to the domestic GDP is expected to be at 6% (US $67.3bn) in 2009, and is
                estimated to rise to US $187.3bn by 2019 registering a CAGR of 10.8% over
                FY2009-19E.

                Dynamics across major areas

                The major cities in India can be differentiated into Leisure destinations and Business
                destinations. Places like Mumbai, Bangalore, Kolkata, Chennai, Delhi, Hyderabad,
                Pune, Ahmedabad and the NCR region primarily attract business travelers, due to the
                dominant corporate presence in these cities. Places like Agra, Jaipur, Goa and Kerala
                fall under the category of leisure destinations, since they attract the maximum tourist
                traffic. Many hotel players already have a presence, or plan to expand their presence
                in all these cities, due to a continuous surge in the demand for rooms. Out of the
                estimated 32,315 premium rooms in India in FY2009, around 90% fall in these major
                cities. With the demand for rooms outstripping their supply, the hotel players were on
                a dream-run over the past four to five years, helping them garner higher ORs and ARRs.

                Exhibit 25: ARR trends across major cities
                             16,000
                             14,000
                 ARRs (Rs)


                             12,000
                             10,000
                              8,000
                              6,000
                              4,000
                              2,000
                                  0
                                      Ahmadabad


                                                                                                                                                              Jaipur
                                                                        Kolkata


                                                                                  Hyderabad


                                                                                                       North Mumbai
                                                              Chennai


                                                                                                                                                        Goa
                                                                                                                                       Pune
                                                                                               Delhi


                                                                                                                                                                       Kerala
                                                                                                                        South Mumbai
                                                  Bangalore


                                                                                                                                                 Agra


                                                                        FY2006                FY2007                  FY2008                  FY2009
                Source: Crisil, Angel Research


June 11, 2010                                                                                                                                                             18
Hotel Leela Venture | Initiating Coverage


                Moreover, factors like the increased awareness about India as an attractive tourist
                destination, government initiatives, robust economic growth, an increase in average
                income levels and a change in the spending patterns of Indians, contributed towards
                increasing the tourist movement across India (from foreign and domestic travelers).
                However, this demand started declining in the latter half of CY2008, mainly due to the
                global economic slowdown, followed by the Mumbai terrorist attacks. This resulted in
                ORs and ARRs falling sharply across cities. However, with Foreign Tourist Arrivals (FTAs)
                trends improving substantially from December 2009, we expect the demand to improve
                in the coming months.

                Exhibit 26: Occupancy Trends across major cities
                                       90
                                       80
                 Occupancy rates (%)


                                       70
                                       60
                                       50
                                       40
                                       30
                                       20
                                       10
                                        0
                                            Ahmadabad


                                                                                                       Delhi
                                                        Bangalore


                                                                               Kolkata


                                                                                                                                                            Agra
                                                                    Chennai


                                                                                                                                                                    Goa


                                                                                                                                                                          Jaipur
                                                                                                                                                 Pune


                                                                                                                                                                                   Kerala
                                                                                         Hyderabad


                                                                                                                North Mumbai


                                                                                                                                  South Mumbai
                                                                              2005 -06               2006 -07                  2007 -08                 2008 -09P

                Source: Crisil, Angel Research,


                Future Outlook

                With India emerging as a frontrunner in recovering from the global turmoil, signs of
                improving demand are visible again, with tourist movement picking up, thereby resulting
                in improving occupancy rates, which would consequently be followed by ARRs. The
                reversal in the trend is apparent from the fact that FTAs have improved by 15.1%
                during December 2009-March 2010 (against -12.7% during the comparable period
                of the previous year). Moreover, we expect the recovery in FTAs to speed up over the
                coming months, on the back of the improving economic activity and upcoming events
                like the Commonwealth Games 2010 and the Cricket Worldcup in India. We expect
                the industry to witness a significant recovery in CY2010E and to stabilise in CY2011E.


June 11, 2010                                                                                                                                                                               19
Hotel Leela Venture | Initiating Coverage


                Profit & Loss Statement                                                        Rs crore
                Y/E March                     FY2007    FY2008   FY2009    FY2010    FY2011E   FY2012E
                Net Sales                      393.7     536.4    470.1     436.2      631.9     874.1
                Other operating income              -        -         -         -         -         -

                Total operating income         393.7     536.4    470.1     436.2      631.9     874.1
                % chg                           17.0      36.2    (12.4)     (7.2)      44.9      38.3

                Total Expenditure              211.6     306.9    325.3     309.6      377.3     510.5

                Net Raw Materials               24.9      33.8     28.8      30.6       44.2      61.2

                Other Mfg costs                 59.7      84.4     87.5      44.0      108.7     143.4

                Personnel                       52.5      80.7     88.4      95.4       94.8     126.7

                Other                           74.6     108.0    120.6     139.6      129.5     179.2

                EBITDA
                EBITDA                         182.1     229.5    144.8     126.6      254.7     363.6
                % chg                           15.5      26.0    (36.9)    (12.5)     101.2      42.8

                (% of Net Sales)                46.2      42.8     30.8      29.0       40.3      41.6

                Depreciation& Amortisation      33.8      45.3     54.9      68.3       76.0      81.1

                EBIT                           148.3     184.1     89.8      58.3      178.7     282.5

                % chg                           18.5      24.1    (51.2)    (35.1)     206.6      58.1

                (% of Net Sales)                37.7      34.3     19.1      13.4       28.3      32.3

                Interest & other Charges        40.7      36.9     27.2      24.5       92.8     151.2

                Other Income                    25.6      29.8     23.7      26.9       26.0      26.0

                (% of PBT)                      19.2      16.8     27.5      44.3       23.2      16.5

                Recurring PBT                  133.2     177.0     86.3      60.7      111.9     157.3

                % chg                           23.3      32.9    (51.2)    (29.7)      84.5      40.6

                Extraordinary Income/(Exp.)    56.29     46.15   106.23

                PBT (reported)                 189.5     223.2    192.6      60.7      111.9     157.3
                Tax                             63.3      73.2     47.6      19.6       36.9      55.1

                (% of PBT)                      33.4      32.8     24.7      32.4       33.0      35.0

                PAT (reported)                 126.2     150.0    145.0      41.0       75.0     102.3

                ADJ. PAT
                ADJ. PA                         70.0     103.8     38.8      41.0       75.0     102.3
                % chg                            0.4      48.4    (62.7)      5.9       82.7      36.4

                (% of Net Sales)                17.8      19.4      8.2       9.4       11.9      11.7

                Basic EPS (Rs)                   1.9       2.7      1.0       1.1        2.0       2.7

                Fully Diluted EPS (Rs)           1.9       2.7      1.0       1.1        2.0       2.7
                 % chg                          (0.1)     45.5    (62.7)      5.9       82.7      36.4


June 11, 2010                                                                                        20
Hotel Leela Venture | Initiating Coverage


                Balance Sheet                                                             Rs crore
                Y/E March                   FY2007   FY2008   FY2009   FY2010   FY2011E   FY2012E
                SOURCES OF FUNDS

                Equity Share Capital           74       76       76       76        76        76

                Preference Capital               -        -        -        -         -         -

                Reserves& Surplus             827      855     1,865    1,897     1,955     2,040

                             Funds
                Shareholders Funds            901      930     1,940    1,973     2,031     2,116

                Total Loans                   953     2,036    2,450    2,450     2,450     2,410

                Deferred Tax Liability         75       91      100      100       100       100

                Total Liabilities            1,929    3,057    4,490    4,522     4,581     4,627

                APPLICATION OF FUNDS
                APPLICATION

                Gross Block                  1,797    2,604    3,833    4,207     4,768     4,843

                Less: Acc. Depreciation       279      336      398      463       539       620

                Net Block                    1,518    2,268    3,435    3,744     4,229     4,223

                Capital Work-in-Progress      193      406      935      561        75        75

                Goodwill                         -        -        -        -         -         -

                Investments                    60        0       46       46        46        46

                Current Assets                274      589      396      422       594       785

                   Cash                        11      296       30       28       113       119

                   Loans & Advances           194      216      292      323       381       527

                   Other                       69       77       73       72       100       139

                Current liabilities           115      206      322      251       364       503

                Net Current Assets            159      383       74      171       231       282

                Mis. Exp. not written off        -        -        -        -         -         -

                Total Assets                 1,929    3,057    4,490    4,522     4,581     4,627


June 11, 2010                                                                                   21
Hotel Leela Venture | Initiating Coverage


                Cash Flow Statement                                                              Rs crore
                Y/E March                     FY2007      FY2008    FY2009    FY2010   FY2011E   FY2012E

                Profit before tax                  190       223       193       61       112       157

                Depreciation                        34        45        55       68        76        81

                Change in Working Capital           (4)       82       120      (69)       84       101

                Less: Other income                 110        77       130       27        26        26

                Direct taxes paid                   63        73        48       20        37        55

                Cash Flow from Operations           46       201       190       13       209       258

                (Inc)./ Dec in Fixed Assets    (199)      (1,008)   (1,751)      (4)      (75)      (75)

                (Inc)./ Dec in Investments            -       60       (46)        -         -         -

                (Inc)/ Dec in loans and advances     5       (22)      (76)     (30)      (58)     (146)

                Other income                       110        77       130       27        26        26

                Cash Flow from Investing           (84)    (894)    (1,743)      (7)     (107)     (195)

                Issue of Equity                      0         2          -        -         -         -

                Inc./(Dec.) in loans           (104)       1,083       414         -        1       (40)

                Dividend Paid (Incl. Tax)          (17)      (19)      (15)      (8)      (15)      (15)

                Others                               6       (88)      889       (1)       (2)       (2)

                               Financing
                Cash Flow from Financing       (114)         978     1,288       (8)      (16)      (57)

                Inc./(Dec.) in Cash            (152)         285      (265)      (3)       85         6

                Opening Cash balances              163        11       296       30        28       113

                Closing Cash balances               11       296        30       28       113       119


June 11, 2010                                                                                          22
Hotel Leela Venture | Initiating Coverage


                Key Ratios
                Y/E March                         FY2007     FY2008   FY2009   FY2010   FY2011E   FY2012E
                Valuation Ratio (x)
                P/E (on FDEPS)                       24.4      16.7     44.8     42.4      23.2      17.0
                P/CEPS                               16.4      11.7     18.6     15.9      11.5       9.5
                P/BV #                                2.5       2.4      2.5      2.4       2.2       2.0
                Dividend yield (%)                    1.0       1.1      0.9      0.4       0.9       0.9
                EV/Sales                              6.8       6.5      8.8      9.5       6.4       4.6
                EV/EBITDA                            14.7      15.2     28.7     32.9      16.0      11.1
                EV / Total Assets                     1.3       1.0      0.7      0.8       0.9       0.9
                EV/Room                               2.5       3.2      3.9      3.5       2.2       2.2
                Per Share Data (Rs)
                EPS (Basic)                           1.9       2.7      1.0      1.1       2.0       2.7
                EPS (fully diluted)                   1.9       2.7      1.0      1.1       2.0       2.7
                Cash EPS                              2.8       3.9      2.5      2.9       4.0       4.9
                DPS                                   0.5       0.5      0.4      0.2       0.4       0.4
                Book Value #                         18.5      19.0     18.6     19.5      21.0      23.2
                Dupont Analysis
                EBIT margin                          37.7      34.3     19.1     13.4      28.3      32.3
                Tax retention ratio                   0.7       0.7      0.8      0.7       0.7       0.7
                Asset turnover (x)                    0.2       0.3      0.2      0.1       0.2       0.3
                ROIC (Post-tax) #                     5.9       5.9      2.3      1.2       3.7       5.6
                Cost of Debt (Post Tax)               2.7       1.7      0.9      0.6       2.5       4.0
                Leverage (x)                          1.4       1.9      2.9      3.4       3.1       2.8
                Operating ROE #                      10.4      14.0      6.2      3.0       7.5      10.1
                Returns (%)
                ROCE (Pre-tax) #                      8.7       6.5      2.8      1.8       5.3       8.3
                Angel ROIC (Pre-tax) #                9.2       8.7      3.1      1.8       5.5       8.7
                ROE #                                10.8      14.8      5.5      5.7       9.8      12.2
                Turnover ratios (x)
                Asset Turnover (Gross Block)          0.2       0.2      0.1      0.1       0.1       0.2
                Inventory / Sales (days)               27       24       31       33        24        24
                Receivables (days)                     29       26       27       28        25        26
                Payables (days)                       157      116      149      186       170       177
                WC cycle (ex-cash) (days)             275      160      102      157       151       117
                Solvency ratios (x)
                Net debt to equity                    1.0       1.9      1.2      1.2       1.2       1.1
                Net debt to EBITDA                    5.2       7.6     16.7     19.1       9.2       6.3
                Interest Coverage (EBIT / Interest) 3.6         5.0      3.3      2.4       1.9       1.9
                Note:   #
                            Excluding revaluation reserves


June 11, 2010                                                                                           23
Hotel Leela Venture


Disclaimer
This document is solely for the personal information of the recipient, and must not be singularly used as the basis of any investment
decision. Nothing in this document should be construed as investment or financial advice. Each recipient of this document should make
such investigations as they deem necessary to arrive at an independent evaluation of an investment in the securities of the companies
referred to in this document (including the merits and risks involved), and should consult their own advisors to determine the merits and
risks of such an investment.

Angel Securities Limited, its affiliates, directors, its proprietary trading and investment businesses may, from time to time, make investment
decisions that are inconsistent with or contradictory to the recommendations expressed herein. The views contained in this document are
those of the analyst, and the company may or may not subscribe to all the views expressed within.

Reports based on technical and derivative analysis center on studying charts of a stock's price movement, outstanding positions and trading
volume, as opposed to focusing on a company's fundamentals and, as such, may not match with a report on a company's fundamentals.

The information in this document has been printed on the basis of publicly available information, internal data and other reliable sources
believed to be true, and is for general guidance only. Angel Securities Limited has not independently verified all the information contained
within this document. Accordingly, we cannot testify, nor make any representation or warranty, express or implied, to the accuracy, contents
or data contained within this document. While Angel Securities Limited endeavours to update on a reasonable basis the information
discussed in this material, there may be regulatory, compliance, or other reasons that prevent us from doing so.

This document is being supplied to you solely for your information, and its contents, information or data may not be reproduced, redistributed
or passed on, directly or indirectly.

Angel Securities Limited and its affiliates may seek to provide or have engaged in providing corporate finance, investment banking or other
advisory services in a merger or specific transaction to the companies referred to in this report, as on the date of this report or in the past.

Neither Angel Securities Limited, nor its directors, employees or affiliates shall be liable for any loss or damage that may arise from or in
connection with the use of this information.

Note: Please refer to the important `Stock Holding Disclosure' report on the Angel website (Research Section).


 Disclosure of Interest Statement                                              Hotel Leela
                                                                                     Leela
 1. Analyst ownership of the stock                                                 No
 2. Angel and its Group companies ownership of the stock                           No
 3. Angel and its Group companies' Directors ownership of the stock                No
 4. Broking relationship with company covered                                      No
Note: We have not considered any Exposure below Rs 1 lakh for Angel, its Group companies and Directors.


  Ratings (Returns) :                Buy (> 15%)                           Accumulate (5% to 15%)                      Neutral (-5 to 5%)
                                     Reduce (-5% to 15%)                   Sell (< -15%)
Hotel Leela Venture


               Address: Acme Plaza, ‘A’ Wing, 3rd Floor, M.V. Road, Opp. Sangam Cinema, Andheri (E), Mumbai - 400 059.
                                                        Tel : (022) 3952 4568 / 4040 3800

Research Team
Fundamental:
Sarabjit Kour Nangra                                                                               VP-Research, Pharmaceutical                                                            sarabjit@angeltrade.com
Vaibhav Agrawal                                                                                    VP-Research, Banking                                                                   vaibhav.agrawal@angeltrade.com
Vaishali Jajoo                                                                                     Automobile                                                                             vaishali.jajoo@angeltrade.com
Shailesh Kanani                                                                                    Infrastructure, Real Estate                                                            shailesh.kanani@angeltrade.com
Anand Shah                                                                                         FMCG , Media                                                                           anand.shah@angeltrade.com
Deepak Pareek                                                                                      Oil & Gas                                                                              deepak.pareek@angeltrade.com
Puneet Bambha                                                                                      Capital Goods, Engineering                                                             puneet.bambha@angeltrade.com
Sushant Dalmia                                                                                     Pharmaceutical                                                                         sushant.dalmia@angeltrade.com
Rupesh Sankhe                                                                                      Cement, Power                                                                          rupeshd.sankhe@angeltrade.com
Param Desai                                                                                        Real Estate, Logistics, Shipping                                                       paramv.desai@angeltrade.com
Sageraj Bariya                                                                                     Fertiliser, Mid-cap                                                                    sageraj.bariya@angeltrade.com
Viraj Nadkarni                                                                                     Retail, Hotels, Mid-cap                                                                virajm.nadkarni@angeltrade.com
Paresh Jain                                                                                        Metals & Mining                                                                        pareshn.jain@angeltrade.com
Amit Rane                                                                                          Banking                                                                                amitn.rane@angeltrade.com
Rahul Jain                                                                                         IT, Telecom                                                                            rahul.j@angeltrade.com
Jai Sharda                                                                                         Mid-cap                                                                                jai.sharda@angeltrade.com
Sharan Lillaney                                                                                    Mid-cap                                                                                sharanb.lillaney@angeltrade.com

Amit Vora                                                                                          Research Associate (Oil & Gas)                                                         amit.vora@angeltrade.com
V Srinivasan                                                                                       Research Associate (Cement, Power)                                                     v.srinivasan@angeltrade.com
Aniruddha Mate                                                                                     Research Associate (Infra, Real Estate)                                                aniruddha.mate@angeltrade.com
Mihir Salot                                                                                        Research Associate (Logistics, Shipping)                                               mihirr.salot@angeltrade.com
Chitrangda Kapur                                                                                   Research Associate (FMCG, Media)                                                       chitrangdar.kapur@angeltrade.com
Vibha Salvi                                                                                        Research Associate (IT, Telecom)                                                       vibhas.salvi@angeltrade.com
Pooja Jain                                                                                         Research Associate (Metals & Mining)                                                   pooja.j@angeltrade.com

Technicals:
Shardul Kulkarni                                                                                   Sr. Technical Analyst                                                                  shardul.kulkarni@angeltrade.com
Mileen Vasudeo                                                                                     Technical Analyst                                                                      vasudeo.kamalakant@angeltrade.com

Derivatives:
Siddarth Bhamre                                                                                    Head - Derivatives                                                                     siddarth.bhamre@angeltrade.com
Jaya Agarwal                                                                                       Derivative Analyst                                                                     jaya.agarwal@angeltrade.com
Sandeep Patil                                                                                      Jr. Derivative Analyst                                                                 patil.sandeep@angeltrade.com


Institutional Sales Team:
Mayuresh Joshi                                                                                     VP - Institutional Sales                                                               mayuresh.joshi@angeltrade.com
Abhimanyu Sofat                                                                                    AVP - Institutional Sales                                                              abhimanyu.sofat@angeltrade.com
Nitesh Jalan                                                                                       Sr. Manager                                                                            niteshk.jalan@angeltrade.com
Pranav Modi                                                                                        Sr. Manager                                                                            pranavs.modi@angeltrade.com
Sandeep Jangir                                                                                     Sr. Manager                                                                            sandeepp.jangir@angeltrade.com
Ganesh Iyer                                                                                        Sr. Manager                                                                            ganeshb.Iyer@angeltrade.com
Jay Harsora                                                                                        Sr. Dealer                                                                             jayr.harsora@angeltrade.com
Meenakshi Chavan                                                                                   Dealer                                                                                 meenakshis.chavan@angeltrade.com
Gaurang Tisani                                                                                     Dealer                                                                                 gaurangp.tisani@angeltrade.com


Production Team:
Bharathi Shetty                                                                                    Research Editor                                                                        bharathi.shetty@angeltrade.com
Bharat Patil                                                                                       Production                                                                             bharat.patil@angeltrade.com
Dilip Patel                                                                                        Production                                                                             dilipm.patel@angeltrade.com


Angel Broking Ltd: BSE Sebi Regn No : INB 010996539 / CDSL Regn No: IN - DP - CDSL - 234 - 2004 / PMS Regn Code: PM/INP000001546 Angel Securities Ltd:BSE: INB010994639/INF010994639 NSE: INB230994635/INF230994635 Membership numbers: BSE 028/NSE:09946
Angel Capital & Debt Market Ltd: INB 231279838 / NSE FNO: INF 231279838 / NSE Member code -12798 Angel Commodities Broking (P) Ltd: MCX Member ID: 12685 / FMC Regn No: MCX / TCM / CORP / 0037 NCDEX : Member ID 00220 / FMC Regn No: NCDEX / TCM / CORP / 0302

Hotel leela venture 11-06-10

  • 1.
    Initiating Coverage |Hotels June 11, 2010 Leela Venture Hotel Leela Venture NEUTRAL CMP Rs46 Not much room Target Price - Hotel Leela Venture (HLVL) is one of the key players in the premium segment of the Investment Period - hospitality industry in India, with operations across six locations, and a portfolio of Stock Info 1,190 owned rooms. HLVL has expansion plans lined up in two phases, of which Sector Hotels the New Delhi and Chennai properties are expected to get operational in FY2011E. With tourist activity (domestic and foreign) picking up, we expect the industry and, Market Cap (Rs cr) 1,736 in turn, hoteliers, to regain their lost glory. At the CMP HLVL trades at an FY2012E , Beta 1.2 EV/Room of Rs2.2cr, which is higher than the company's replacement cost of 52 Week High / Low 53/26 ~Rs1.8-2cr. Moreover, at current valuations, HLVL is expensive as compared to its Avg Daily Volume 505208 peers. Hence, we Initiate Coverage on the stock with a Neutral view. view. Face Value (Rs) 2 Improving industry dynamics to boost HLVL's performance: HLVL has started HLVL's BSE Sensex 17,065 witnessing the positive effects of the changing industry dynamics. Its Bangalore Nifty 5,119 and Mumbai properties (contributing ~62% to revenues in FY2010) witnessed Reuters Code HTLE.BO Occupancy Rates (ORs) of 70-80% in 4QFY2010, a marked improvement over the Bloomberg Code LELA@IN 55-65% levels on a yoy basis. Moreover, we believe the improving trend is bolstered Shareholding Pattern (%) by the firming up of Average Room Rates (ARRs) recently, indicating a stout recovery. Hence, we estimate HLVL’s Top-line, EBIDTA and PAT to witness a CAGR of 41.6%, Promoters 53.3 69.5% and 57.9% respectively, over FY2010-12E. MF / Banks / Indian FIs 20.1 FII / NRIs / OCBs 5.6 New property additions to diversify geographical risks: To diversify location risks Indian Public / Others 21.0 and tap new geographies, HLVL is spreading its presence in India. We expect significant delta in terms of diversification, both geographically and financially, to Abs. (%) 3m 1yr 3yr take effect from 2HFY2011E onwards, as its properties in Delhi and in Chennai get operational. These properties, along with the recently opened ones in Gurgaon Sensex (0.6) 10.7 131.3 and Udaipur, would enable HLVL in toning down its revenue dependence on Mumbai Hotel leela (0.5) 25.2 (15.3) and Bangalore (combined) to ~40% in FY2012E. Key Financials Y/E March (Rs cr) FY2009 FY2010 FY2011E FY2012E Net Sales 470 436 632 874 % chg (12.4) (7.2) 44.9 38.3 Adj. Net Profit Profit 38.8 41.0 75.0 102.3 % chg (62.7) 5.9 82.7 36.4 EPS (Rs) 1.0 1.1 2.0 2.7 EBITDA Margin (%) 30.8 29.0 40.3 41.6 P/E (x) 44.8 42.4 23.2 17.0 RoE (%) # 5.5 5.7 9.8 12.2 RoCE (%) # 2.8 1.8 5.3 8.3 P/BV (x) # 2.5 2.4 2.2 2.0 EV/Room (Rs cr) 3.9 3.5 2.2 2.2 EV/Sales (x) 8.8 9.5 6.4 4.6 Viraj Nadkarni Tel: 022 - 4040 3800 Ext: 309 EV/EBITDA (x) 28.7 32.9 16.0 11.1 E-mail: virajm.nadkarni@angeltrade.com Source: Company, Angel Research; Note: # Excluding revaluation reserves Please refer to important disclosures at the end of this report
  • 2.
    Hotel Leela Venture| Initiating Coverage Investment Arguments Hospitality Industry: On the growth path Foreign Tourist Arrival trend recovering from its lows The global meltdown and terrorist During FY2009, the Indian tourism industry had to cope with terrorism and with the attacks on Mumbai affected the global economic downturn. This slammed the brakes on a decade of ~9% CAGR hospitality industry in FY2009 growth in international arrivals (CY1998-2007), which was driven by the successful 'Incredible India' marketing campaign and steady improvements in the tourism infrastructure. Exhibit 1: FTAs, Foreign Exchange Earnings (FEE) over CY1998-2009 6,000 14 5,000 12 (Number of Tourists) 10 4,000 (US$ bn) 8 3,000 6 2,000 4 1,000 2 0 0 CY2009 CY1998 CY1999 CY2000 CY2001 CY2002 CY2003 CY2004 CY2005 CY2006 CY2007 CY2008 Foreign Tourist Arrivals (in '000) (LHS) FEE (RHS) Source: Ministry of Tourism, Angel Research For the Indian hospitality industry, CY2008 began on a reasonably optimistic note; however, the sentiment reversed completely by the end of the year. The tourism demand slowed significantly after September 2008, due to dire global economic conditions. This, coupled with the terrorist attacks in November 2008 in Mumbai, added to the concerns of the hospitality industry. After the terrorist attacks, the industry recorded cancellations as high as 20%, particularly in the western region of the country. The Foreign Tourist Arrivals (FTA) growth decelerated significantly in October 2008, registering only a marginal rise of 1.8% yoy (13.6% in October 2007). The decline continued during the year, with FTAs posting a de-growth of 2.1% and 12.5% in November and December 2008, respectively, thereby ending CY2008 with a 5.6% growth (against 14.3% in CY2007). Exhibit 2: Impact of slowdown and terrorist attacks on FTAs in 4QCY2008 25.0 20.0 15.0 FTA Growth (%) 10.0 Global slowdown 5.0 & Terrorism Impact 0.0 April August June May July March October September January December February November (5.0) (10.0) (15.0) CY2006-07 (% growth) CY2007-08 (% growth) Source: Crisil, Angel Research June 11, 2010 2
  • 3.
    Hotel Leela Venture| Initiating Coverage FTAs have improved by 15.1% during FTAs The scenario turned even bleaker for the hospitality industry in CY2009, with FTAs December 2009-March 2010 declining by 11% during January-May, 2009, as against a growth of 11% in the (against -12.7% during the comparable comparable period of the previous year. Over the period of October 2008 to May period of the previous year). 2009, FTAs declined by 8.3% yoy. However, with India emerging as a frontrunner in recovering from the global turmoil, signs of improving demand are visible again, with tourist movement picking up, thereby resulting in improving occupancy rates, which would consequently be followed by ARRs. The reversal in the trend is apparent from the fact that FTAs have improved by 15.1% during December 2009-March 2010 (against -12.7% during the comparable period of the previous year). Moreover, we expect the recovery in FTAs to speed up over the coming months, on the back of the improving economic activity and upcoming events like the Commonwealth Games 2010 and the Cricket Worldcup in India. Exhibit 3: FTAs on recovery path 25.0 90 20.0 80 15.0 70 10.0 60 5.0 Tourist Arrival trend 50 Global slowdown & recoveringg (%) (%) Terrorism Impact 0.0 40 Jul-08 Sep-08 Nov-08 Jan-09 Mar-09 May-09 Jul-09 Sep-09 Nov-09 Jan-10 Mar-10 (5.0) 30 (10.0) 20 (15.0) 10 (20.0) 0 FTA's growth trend (July 2008- March 2010) Occupancy rates Source: Crisil, Angel Research June 11, 2010 3
  • 4.
    Hotel Leela Venture| Initiating Coverage Demand continues to outstrip supply Premium room demand expected to record CAGR of 13% over FY2010-13E Historically, the industry has witnessed a Historically, Currently, India has 1,10,000 hotel rooms, and the estimated shortfall is of 1,50,000 volume growth in premium room rooms, as per the estimates of the Ministry of Tourism, for 2010. In contrast to this, CAGR demand at a CAGR of 10.1% over there are more than 4.3mn rooms in the US, and almost 74,000 in New York City FY2002-08 alone. The impact of such a shortfall will only be accentuated in the future, given the steady growth in demand and India's emergence as a global economic power (foreign tourist arrivals rose at a CAGR of 13.7% over CY2004-07). We believe that the downturn, which began from the second half of CY2008, led to temporary demand destruction and things have started looking brighter again from 3QFY2010. Exhibit 4: Demand Driver - FTAs and Growth rates (CY1998-2009P) 6,000 30 25 5,000 20 (’000) 4,000 15 (%) 3,000 10 5 2,000 0 1,000 (5) 0 (10) CY2009 CY1998 CY1999 CY2000 CY2001 CY2002 CY2003 CY2004 CY2005 CY2006 CY2007 CY2008 Foreign Tourist Arrivals (LHS) Growth (RHS) Source: Ministry of Tourism, Angel Research The industry witnessed a tough phase in FY2010, however, signs of recovery are visible after December 2009, with FTA growth of 21% (10.5%), 16.4% (-17.6%), 9.9% (-10.6%) and 13% (- 12.9%) during December 2009, January 2010, February 2010 and March 2010 respectively. We expect the demand growth to normalise from FY2011E. As per industry sources, the growth in the Indian economy is expected to drive the demand for rooms at a CAGR of 12-14% over the next three to five years. Historically, the industry has witnessed a volume growth in premium room demand at a CAGR of 10.1% over FY2002-08. Considering the latest signs of economic revival and the probability of India emerging out of the current crisis at a faster pace, we estimate the demand for premium-segment rooms to witness a CAGR of 13% (in line with Crisil estimates) over FY2010E-13E. Premium Room Supply expected to record a CAGR of 10.8% over FY2010-13E Delay in capacity additions to tone down Over FY2004-08, the total room supply in India, across all classes of hotels, witnessed supply of rooms a CAGR of 5.7%. During the same period, the supply of premium rooms witnessed a CAGR of 4.4%. Considering the expansion plans announced by several players in the recent past, it was feared that the industry may witness oversupply concerns in the near future, and would tone down the ARRs and occupancy levels of hotel players. The supply over the period FY2009-13E was estimated to witness a CAGR of 18-19%, with the number of rooms likely to rise from ~32,000 rooms in FY2009 to ~60,000 rooms in FY2013E. June 11, 2010 4
  • 5.
    Hotel Leela Venture| Initiating Coverage However, due to the global meltdown, the tight liquidity conditions and a downturn in the industry, many players have delayed their roll-out plans. We estimate the premium rooms supply to witness a CAGR of 10.8% over FY2010-13E, to around 45,000 rooms from 33,218 rooms in FY2009. Exhibit 5: Supply Projections - Premium Segment Destinations FY2010P FY2011E FY2012E FY2013E CAGR (%) CAGR Business 24,797 27,726 30,869 35,156 12.3 Leisure 8,421 8,939 9,395 9,991 5.9 Total 33,218 36,665 40,264 45,147 10.8 Source: Crisil, Angel Research To get clarity on occupancy levels, we Occupancy rates (OR's) to witness uptrend, Average Room Rates (ARR) have considered three different supply may follow scenarios In order to get clarity on the probable occupancy levels, we have considered three different supply scenarios. In all the three cases, we have assumed the demand to CAGR FY2010-13E. witness a CAGR of 13% over FY2010-13E. Base Case Scenario: In this scenario, we have assumed the most likely demand supply situation going ahead. We have assumed that supply will witness a CAGR of 10.8% over FY2010-13E. Based on this assumption, we foresee occupancy levels to climb back to 73% levels by FY2013E, thereby helping the industry restore its growth trajectory. Best Case Scenario: Over FY2004-08, the total room supply in India, across all classes of hotels, witnessed a CAGR of 5.7%. During the same period, the supply of premium rooms witnessed a CAGR of 4.4%. In our Best case scenario, we have assumed the supply to witness a CAGR at its historical pace of around 4.5%. On this assumption, we foresee occupancy levels to surge to 90% levels by FY2013E. We expect this scenario to be less likely in the future. Worst Case Scenario: Under this scenario, we have assumed supply witnessing a CAGR of 15% outpacing demand growth. On this assumption we foresee occupancy levels to significantly decline to 61% levels by FY2013E, thereby affecting the profitability of hotel players. We expect this scenario to be highly improbable in the future. Exhibit 6: Occupancy levels: Sensitivity Analysis 40,000 90 35,000 85 30,000 80 (No. of Rooms) 25,000 75 OR (%) 20,000 70 15,000 65 10,000 5,000 60 - 55 FY2011E FY2012E FY2013E Room Demand @ 13% growth Base Case-Occupancy @ 10.8% supply growth Best Case- Occupancy @ 4.5% supply growth Worst Case- Occupancy @ 16% supply growth Source: Angel Research June 11, 2010 5
  • 6.
    Hotel Leela Venture| Initiating Coverage Improving industry dynamics to boost HLVL's performance Occupancy levels on rise; ARRs may Currently, HLVL has six operational hotels within the country (Mumbai, Bangalore, follow in the coming months Goa, Kovalam, Udaipur and Gurgaon), and has an inventory of around 1,190 owned rooms and 409 rooms under management contract (in Gurgaon). The signs of revival in demand can be witnessed from the fact that HLVL's properties in Mumbai and Bangalore (currently contributing ~62% to HLVL's revenues) enjoyed occupancies between 70-80% during 4QFY2010, a marked improvement from ~55-65% during 4QFY2009. Moreover, with ARRs firming up recently, our view of firm positive changes happening in the industry (benefiting HLVL in turn) has been further bolstered. Exhibit 7: HLVL - ARR and OR trends 14,000 76 75 80 70 71 65 70 12,000 63 60 10,000 50 8,000 (Rs) (%) 40 6,000 30 4,000 20 2,000 10 0 0 FY2007 FY2008 FY2009 FY2010 FY2011E FY2012E ARR's (in Rs) (LHS) OR's (in %) (RHS) Source: Crisil, Angel Research We believe the ongoing recovery trend in ARR’s and OR’s to continue and stabilize going ahead. We expect HLVL to witness a surge in OR's from 63% in FY2010 to 70% and 71% in FY2011E and FY2012E respectively. Although the old properties are expected to witness OR's above 70% levels, the upcoming properties in New Delhi and Chennai would take time to stabilize thereby toning down the overall OR's. We expect HLVL's properties to witness ARR growth of ~8-9% in FY2011E and FY2012E as stabilizing OR's would enable the company to gradually increase its ARR's. Considering the changing scenario, we estimate HLVL's Revenues to witness a CAGR of 41.6% over FY2010-12E. Major destinations catered to by HLVL Bangalore Supply in Bangalore would rise at a The Bangalore hospitality market has around 7,824 rooms in the 3-star and above CAGR FY2009-13E, CAGR of 27.4% over FY2009-13E, from categories. The market is skewed toward 3-star category rooms, which have the highest 2,558 rooms in FY2009 to around 6,461 concentration at ~49% of the total inventory. Premium segment rooms constitute ~33% rooms in FY2013E of the total, while the balance is the share of the 4-star category rooms. Prior to the global meltdown, it was estimated that the supply in Bangalore would rise at a CAGR of 27.4% over FY2009-13E, from 2,558 rooms in FY2009 to around 6,461 rooms in FY2013E. However, with several players delaying and cancelling their plans, Bangalore is estimated to have around 4,554 rooms by FY2013E, a shortfall of 29% over the earlier projection. This, we believe, would result in the firming up of the ORs and ARRs in the city, going ahead. June 11, 2010 6
  • 7.
    Hotel Leela Venture| Initiating Coverage Exhibit 8: HLVL Bangalore - ARR and OR trends 18,000 72 74 71 71 16,000 72 14,000 70 68 12,000 64 66 10,000 (Rs) (%) 64 8,000 60 62 6,000 60 4,000 58 2,000 56 0 54 FY2008 FY2009 FY2010 FY2011E FY2012E ARR's (in Rs) (LHS) OR's (in %) (RHS) Source: Company, Angel Research HLVL's Bangalore property has witnessed a de-growth in ARRs to the tune of 32.1% yoy in FY2010, with ORs at ~63% levels. Further, we expect the ARRs and ORs to see a northward trajectory from FY2011E onward. We expect the ARRs to witness an 8% and 9% surge in FY2011E and FY2012E respectively, and ORs to rise to 71% and 72% in FY2011E and FY2012E, respectively. We have built in conservative estimates in ARR growth, despite ORs reaching close to the FY2008 peak levels, mainly considering the revised estimates of additional supply coming up at a CAGR of 16.7% over FY2009-12E (earlier industry estimate of 27.4%), which may lead to price competition. North Mumbai Mumbai is estimated to have around North Mumbai is predominantly a business destination. Its proximity to the international (CAGR 7,081 rooms by FY2013E (CAGR of airport, coupled with the emergence of business districts like the Bandra Kurla Complex 9.4% over FY2009-13E) (BKC), Andheri, Powai and Malad (Mindspace), has heightened the attractiveness of this region for players. Premium hotels constitute nearly 65% of the hotel rooms in North Mumbai, primarily due to the relatively higher cost of land in this region. Prior to the global meltdown, it was estimated that the supply in North Mumbai would rise at a CAGR of 15.2% over FY2009-13E, from 4,941 rooms in FY2009 to 8,709 rooms in FY2013E. However, with several players delaying and cancelling their plans, Mumbai is estimated to have around 7,081 rooms by FY2013E (CAGR of 9.4% over FY2009-13E), a shortfall of 18.7% over the earlier projection. This, we believe, would result in the firming up of ORs and ARRs, going ahead. Exhibit 9: HLVL Mumbai - ARR and OR trends 14,000 90 80 73 75 80 12,000 68 66 70 10,000 60 8,000 50 (Rs) (%) 6,000 40 30 4,000 20 2,000 10 0 0 FY2008 FY2009 FY2010 FY2011E FY2012E ARR's (in Rs) (LHS) OR's (in %) (RHS) Source: Company, Angel Research June 11, 2010 7
  • 8.
    Hotel Leela Venture| Initiating Coverage HLVL's Mumbai property has witnessed a de-growth in ARRs to the tune of 24.6% yoy in FY2010, with ORs at ~66% levels. Further, we expect the ARRs and ORs to see a northward trajectory from FY2011E onward. We expect HLVL to witness a rebound of 9% in ARRs on a yoy basis in FY2011E and FY2012E respectively, while ORs to rise to 73% and 75% in FY2011E and FY2012E, respectively. Goa Goa is the only exception among the key Goa is one of the most popular tourist destinations in India. Goa had 3,255 rooms in cities in India, where supply is expected FY2009 in the premium category segment, and, of these, 71% are located in South pre-global to exceed the pre -global meltdown Goa. Goa is the only exception among the key cities in India where supply is expected estimates to exceed the pre-global meltdown estimates. Premium room supply is expected to witness a CAGR of 4.4% over FY2009-13E (earlier industry estimates were of a CAGR of 2.1%). Demand in Goa is estimated to be robust going ahead, as it is one of the prime leisure destinations and a hot-spot for foreign as well as domestic tourists. Demand is expected to be higher than the estimated supply, going ahead, and we expect ORs and ARRs to firm up from FY2011E onward. Exhibit 10: HLVL Goa- ARR and OR trends 12,500 76 74 74 74 12,000 72 72 11,500 69 70 11,000 68 (Rs) (%) 10,500 64 66 64 10,000 62 9,500 60 9,000 58 FY2008 FY2009 FY2010 FY2011E FY2012E ARR's (in Rs) (LHS) OR's (in %) (RHS) Source: Company, Angel Research HLVL's Goa property to has witnessed a marginal de-growth in ARRs to the tune of 1.3% yoy in FY2010, with ORs at ~69% levels. Going ahead, we expect the ARRs to witness a 9% surge in FY2011E and FY2012E each, and ORs to rise to 72% and 74% in FY2011E and FY2012E, respectively. Kovalam Kovalam is one of the main leisure tourist attractions in Kerala, and enjoys the highest ARRs and ORs during the tourist season from November to March. HLVL purchased its Kovalam property in 1994, prior to which it was owned and managed by the Kerala Tourism Development Corporation. It is a 194-room hotel, spread across 84 acres and is situated on a hillock facing the sea near Trivandrum in Kerala. June 11, 2010 8
  • 9.
    Hotel Leela Venture| Initiating Coverage Exhibit 11: HLVL Kovalam - ARR and OR trends 9,000 74 75 8,000 74 7,000 73 6,000 5,000 72 (Rs) (%) 71 71 4,000 71 70 70 3,000 70 2,000 69 1,000 0 68 FY2008 FY2009 FY2010 FY2011E FY2012E ARR's (in Rs) (LHS) OR's (in %) (RHS) Source: Company, Angel Research HLVL's Kovalam property has witnessed a marginal de-growth in ARRs of 1.8% yoy in FY2010, with ORs being maintained at ~70% levels. We expect the Kovalam property to witness a surge of 8% and 9% in ARRs in FY2011E and FY2012E, respectively while ORs to rise to 70% and 74% in FY2011E and FY2012E, respectively. Udaipur Udaipur is one of India's foremost leisure and conference destinations, equally popular with both domestic and international tourists. HLVL launched its property consisting of 86 rooms in Udaipur in 2QFY2010. We believe that HLVL's Udaipur property would have witnessed lower ARRs and ORs in FY2010, since this is the first year of its operations. Going ahead, we expect the ARRs to witness an 8% surge in FY2011E and FY2012E each, and ORs to rise to 65% and 70% in FY2011E and FY2012E, respectively. Exhibit 12: HLVL Udaipur - ARR and OR trends 26,000 80 70 65 70 25,000 60 24,000 50 23,000 (Rs) (%) 40 22,000 30 21,000 12 20 20,000 10 19,000 0 FY2010 FY2011E FY2012E ARR's (in Rs) (LHS) OR's (in %) (RHS) Source: Company, Angel Research Gurgaon Gurgaon is primarily a business destination, with the presence of industries such as IT/ITeS, auto and automotive components. Various real estate players like DLF Unitech , and Parsvanath have planned IT parks and SEZs, which will further enhance the demand in the city. Traditionally, hotels in Gurgaon have enjoyed higher ARRs and ORs, due to a significant demand-supply mismatch. However, going ahead, the ARRs June 11, 2010 9
  • 10.
    Hotel Leela Venture| Initiating Coverage and ORs are likely to get toned down, due to supply coming up at an estimated CAGR of 36.7% (earlier estimates were 57.3%) over FY2009-13E. As per the revised estimates, the number of premium category rooms in Gurgaon is likely to go up from 578 rooms in FY2009 to 2,021 rooms in FY2013E. HLVL's launched its property in Gurgaon (409 rooms operational in April 2009) via a management contract agreement with the Ambience group. This is the first property operated by the company under the management contract arrangement. Since the property is under management contract, it is expected to contribute only 2-3% to the overall revenues. Exhibit 13: HLVL Gurgaon - ARR and OR trends 12,000 71 70 11,500 70 11,000 69 68 10,500 68 10,000 67 (Rs) (%) 9,500 66 9,000 65 65 8,500 8,000 64 7,500 63 7,000 62 FY2010 FY2011E FY2012E ARR's (in Rs) (LHS) OR's (in %) (RHS) Source: Company, Angel Research HLVL’s Gurgaon property witnessed lower ARRs and ORs in FY2010, since it was the first year of its operations. Going ahead, we expect the ARRs to witness a growth of 5% and 3% in FY2011E and FY2012E, respectively, and ORs to rise to 68% and 70% in FY2011E and FY2012E, respectively. June 11, 2010 10
  • 11.
    Hotel Leela Venture| Initiating Coverage New property additions to diversify geographical risk Geographical diversification to reduce Traditionally, HLVL's revenue has been primarily dependent on the Bangalore and dependence on Bangalore and Mumbai Mumbai properties, as these constituted around 69% of its total room inventory and contribute around 76% to its total revenues in FY2009. Overdependence on these markets also exposed the company to area risk, as any adverse event in any of these cities can seriously hamper HLVL's financials. In order to mitigate the risk and to tap new geographies, HLVL expanded its presence in Gurgaon (409 rooms operational in April 2009) via a management contract agreement with the Ambience group, and also added Udaipur property (81 rooms, operational in May 2009) to its portfolio. These additions have brought down the share of the Mumbai and Bangalore properties, in terms of room inventory concentration. Exhibit 14: City-wise rooms presence (FY2010) Exhibit 15: City-wise revenue contribution (FY2010) Udaipur, 3% Gurgaon, 3% Kovalam, 13% Goa, 18% Bangalore, 22% Gurgaon, 25% r, 5% Udaipu 1% Mumbai, 24% ,1 Bangalore, 33 Mumbai, 29% am val % Ko Goa, 12% Source: Company, Angel Research Source: Company, Angel Research However, as the Gurgaon property is under management contract, it is expected to contribute only ~2% to the overall revenues, while the company-owned Udaipur property (consisting of only 81 rooms) contributed ~3% in FY2010, since its the first year of its operation . Hence, even though the company's geographical presence has widened, HLVL’s Mumbai and Bangalore properties have contributed ~62% (combined) of the total revenue in FY2010. HLVL has chalked out an expansion plan HLVL We expect significant delta in terms of diversification, both geographically and Phase-I, in two phases. In Phase-I, the company financially, to take effect from 2QFY2011E, as HLVL has chalked out an expansion plans to launch hotels in Delhi and plan in two phases. In Phase-I, the company plans to launch hotels in Delhi and Chennai Chennai, for which the work has already commenced. The Delhi property comprising of 290 rooms, catering primarily to the business segment, is scheduled to be launched in July 2010, a few months before the start of the Commonwealth Games (to be held from October 2010 onwards). The 340-room Chennai property, catering primarily to the business segment, is expected to get operational in 1QFY2012E. Moreover, in case of HLVL's Udaipur property which commenced operations in 2HFY2010, FY2011E will be the first year of full operations (estimated to contribute 10% to total revenues in FY2012E), thereby resulting in further diversification of revenues. With the new properties getting operational, HLVL's concentration in Mumbai and Bangalore, both in terms of room inventory and revenue contribution, will get diluted substantially, (33% in Room Inventory terms and 40% in revenue contribution terms including Gurgaon) thereby de-risking HLVL's business model. June 11, 2010 11
  • 12.
    Hotel Leela Venture| Initiating Coverage Exhibit 16: HLVL: City-wise rooms presence (FY2012E) Exhibit 17: HLVL: City-wise Revenue Contribution (FY2012E) Chennai, 8% Goa, 11% Chennai, 15% Bangalore, 16% New New Delhi, 23% Delhi, 13% Mumbai, 19% Mumbai, 18% Gurgaon, 18% Gurgaon, 2% Kov Bangalore, 21% r, 4% Goa, 8% alam Udaipur, 10% Udaipu 8% , Kovalam, 7% Source: Company, Angel Research Source: Company, Angel Research HLVL In Phase -II, HLVL plans to launch In Phase-II of the expansion, HLVL plans to launch properties in Agra, Hyderabad and properties in Agra, Hyderabad and Pune Pune. Although the company has already acquired land at these locations, we expect the work on the same to commence post-FY2012E. We have not factored in Phase-II expansion plans in our calculations. June 11, 2010 12
  • 13.
    Hotel Leela Venture| Initiating Coverage Financial Outlook Tough year behind us; Recovery expected from FY2011E New Delhi and Chennai properties to During FY2007 and FY2008, HLVL's revenues rose by 17% and 36.3% respectively, top-line drive top-line growth driven mainly by favorable industry dynamics. However, HLVL witnessed de-growth of 12.4% in its top-line in FY2009, as the global meltdown started talking its toll on the industry's fortunes in 2HFY2009, which was further aggravated by terrorist attacks in November 2008 in Mumbai. This resulted in pulling down the revenue CAGR over FY2006-09 to 11.8%. HLVL witnessed declines in the ARRs and ORs across its properties, thereby negatively affecting its top-line till 2QFY2010. Although signs of recovery were visible from December 2009, HLVL's top-line witnessed a dip of 7.2% yoy in FY2010, as lower ORs and ARRs were witnessed for a major part of the year. On the back of 31.5% CAGR growth in occupied rooms and 6.8% CAGR growth in ARR's over FY2010-12E, we expect HLVL's top-line to post a CAGR of 41.6% over FY2010-12E, from Rs436.2cr in FY2010 to Rs874.1cr in FY2012E. Apart from the changing dynamics of the industry resulting in higher ORs and ARRs in the future, growth will also be driven by the new properties (New Delhi and Chennai) of the company coming on stream and the recently-launched properties (Udaipur and Gurgaon) stabilising, as FY2010 has been their first year of operations. Exhibit 18: HLVL - ARR and OR trends Exhibit 19: Sales trend 14,000 76 75 80 1,000 44.9 50.0 70 71 900 36.2 38.3 65 70 40.0 12,000 63 800 60 30.0 10,000 700 (Rs cr) 50 600 20.0 (%) 8,000 500 (Rs) (%) 40 6,000 400 10.0 30 300 (7.2) - 4,000 20 200 (12.4) 2,000 (10.0) 10 100 0 0 0 (20.0) FY2007 FY2008 FY2009 FY2010 FY2011E FY2012E FY2008 FY2009 FY2010 FY2011E FY2012E ARR's (in Rs) (LHS) OR's (in %) (RHS) Net Sales (LHS) Growth % (RHS) Source: Crisil, Angel Research Source: Company, Angel Research Operating Leverage to boost OPM; interest cost to hit bottom-line Due to the fixed cost structure of the hotel business, players benefit significantly in the up-cycle of ARRs and ORs, while margins erode faster in the down-cycle. During FY2006-08, HLVL witnessed robust EBITDA margins within a range of 42-47%. However, with the slowdown in demand after 2HFY2009, the EBITDA margins for HLVL contracted, and ended FY2009 with a 1,200bp decline (from 42.8% in FY2008 to 30.8% in FY2009). In the case of HLVL, almost 50% of its expenditure consists of fixed costs, which take a toll on the company's profitability during a downturn. With revenues over FY2010-12E expected to rise at a CAGR of 41.6%, we expect HLVL's EBITDA to witness a CAGR of 69.4% over FY2010-12E. Operating margins are expected to rise from 29% in FY2010 to 40.3% and 41.6% in FY2011E and FY2012E, respectively. June 11, 2010 13
  • 14.
    Hotel Leela Venture| Initiating Coverage We expect the Adjusted PAT to witness a PA On the bottom-line front, we expect the Adjusted PAT to witness a CAGR of 57.9% CAGR CAGR of 33.3% over FY2010-12E over FY2010-12E, from Rs41cr in FY2010 to Rs102.3cr in FY2012E. The PAT growth is expected to be lower than EBIDTA growth mainly due to surge in the depreciation and interest costs due to its high debt-levels and ongoing expansion plans. Exhibit 20: Profitability trend 400 45 42.8 41.6 350 40.3 40 300 35 30.8 30 250 29.0 (Rs cr) 25 (%) 200 19.4 20 150 11.9 11.7 15 9.4 100 8.2 10 50 5 0 0 FY2008 FY2009 FY2010 FY2011E FY2012E EBITDA (LHS) Adj PAT (LHS) OPM (RHS) PATM (RHS) Source: Company, Angel Research Fund raising on the cards HLVL has been on an expansion mode over a past few years and have added significant debt (including FCCB’s) on its balance-sheet to fund its expansion plans. The debt- equity ratio of the company including revaluation reserve of Rs1237cr in FY2010 stands at 1.2x as on FY2010 (3.3x excluding revaluation reserve). Recently, HLVL has approved a proposal to raise funds of up to Rs750cr to reduce debt and also to part-finance expansion plans. The funds will be raised through a mix of issue of equity shares via Qualified Institutional Placement (QIP) and/or FCCBs. The board has decided to issue Rs350cr through the QIP while the rest may be raised , through the issue of FCCBs. We estimate the company to utilize the part of QIP funds to retire the FCCB maturing in September 2010 (convertible at the rate of Rs47 and having a redemption clause set at 125%) since the chances of the FCCB getting converted appear bleak. The balance amount from the QIP and the entire amount from FCCB are likely to be utilized for the company's upcoming New Delhi and Chennai property. We have not factored in these developments in our projections as the funds are still to be raised. However, raising funds by QIP route would dilute the company's future earnings while issue of additional FCCB's is likely to leave the debt-equity levels (including revaluation reserves) unchanged at 1.1x in FY2012E. June 11, 2010 14
  • 15.
    Hotel Leela Venture| Initiating Coverage Concerns Equity Dilution: HLVL has plans to raise additional funds for expansion and retirement of debt through QIP/FCCB in near future. Action on the aforesaid front may lead to equity dilution which may inturn dilute our earning estimates. Delays in execution of projects: Since our future revenue projections are based on new room additions, any further delays in upcoming properties would impact revenue estimates and, consequently, affect the profitability. Ongoing European crisis: The ongoing European crisis may affect the hotel industry in India, as FTAs from Western Europe constitute ~30-33% of the total FTAs in India. Any aggravation of the financial crisis, going ahead, may affect the performance of the premium segment hoteliers in India. Rising terrorist activities: The travel and tourism industry is highly sensitive to risks arising from terrorist activities. In the past, attacks on the Parliament and bomb blasts across some of the key metro cities badly affected tourist sentiment. A recent example is the 26/11 terror attack at the Taj Mahal Hotel and the Hotel Trident in Mumbai. After this attack, foreign tourist arrivals (FTAs) to India have reduced drastically. Hence, such terror attacks make travel, especially leisure travel, more difficult, resulting in delays/cancellations by tourists. June 11, 2010 15
  • 16.
    Hotel Leela Venture| Initiating Coverage Outlook and Valuation The global economic meltdown, along with the terrorist attacks in India, affected the hospitality industry, and the hotel players were facing the heat through lower ARRs and ORs till 2QFY2010. However, as the business sentiment gathered steam, with the overall decent performance by India Inc, coupled with the tourist season that commenced in 3QFY2010, the dynamics of the industry seem to be changing. ORs, which were hovering ~60-62% levels in major cities in India in 2QFY2010, have already surpassed 70% levels in 3QFY2010 and have sustained those leves in 4QFY2010. With ORs stabilising, the next logical move from hoteliers will be a hike in the ARRs, resulting in a revival in their financials. The data of foreign tourist arrivals (FTAs) in India during December 2009-March 2010 further fortifies our belief of a reversal in the trend. The month of December 2009 recorded the highest number of foreign tourist arrivals (in absolute terms) in the last 5 years, registering a rise of 21% yoy, while in January 2010, February 2010 and March 2010, FTAs rose by 16.4%, 9.9% and 13% yoy, respectively. We believe that this provides a clear indication of the good times that lie ahead for the hoteliers. Although HLVL’s financials are currently on the verge of recovery, we believe that EV/Room is the ideal parameter for valuing the company, considering the debt on its books. At the CMP HLVL trades at an FY2012E EV/Room of Rs2.2cr, which is higher , than the company's replacement cost of ~Rs1.8-2cr. Moreover, at current valuations, HLVL is expensive as compared to its peers. Among the mid-cap hotel players, we favour TAJGVK over HLVL, due to its superior financials and robust growth outlook. Hence, considering the risk-reward, we Initiate Coverage on the stock with a Neutral view. view. Exhibit 21: Peer valuation Mcap EV/Room (Rs cr) P/E (x) P/B (x) # EV/Sales (x) EV/EBITDA (x) EV/EBITDA RoE (%) # RoCE (%) # (Rs cr) FY11E FY12E FY11E FY12E FY11E FY12E FY11E FY12E FY11E FY12E FY11E FY12E FY11E FY12E TAJGVK 966 1.1 1.0 17.2 12.7 2.8 2.4 3.7 3.1 9.2 7.2 17.7 20.3 20.3 23.5 HLVL 1,738 2.7 2.2 23.2 17.0 2.2 2.0 6.4 4.6 16.0 11.1 9.8 12.2 5.3 8.3 IHCL* 7,257 1.4 1.2 46.8 23.3 2.5 2.3 3.5 3 14.9 11.1 4.5 9.1 6.2 9.7 Source: Bloomberg, Angel Research; Note: #Excluding revaluation reserves for HLVL, *Indian Hotels Ltd’s EV/Room reflective of domestic operations Exhibit 22: One-year forward P/E Band Exhibit 23: EV/Room Band 120 5.0 4.5 100 4.0 3.5 80 3.0 Share Price (Rs) (Rs cr) 36x 2.5 60 29x 2.0 22x 1.5 40 1.0 15x 20 0.5 0.0 Jul-04 Jul-05 Jul-06 Jul-07 Jul-08 Jul-09 Apr-04 Oct-04 Jan-05 Apr-05 Oct-05 Jan-06 Apr-06 Oct-06 Jan-07 Apr-07 Oct-07 Jan-08 Apr-08 Oct-08 Jan-09 Apr-09 Oct-09 Jan-10 Apr-10 0 Dec-04 Dec-05 Dec-06 Dec-07 Dec-08 Dec-09 Apr-04 Aug-04 Apr-05 Aug-05 Apr-06 Aug-06 Apr-07 Aug-07 Apr-08 Aug-08 Apr-09 Aug-09 Apr-10 EV/Room Average EV/Room Source: Company, Angel Research Source: Company, Angel Research June 11, 2010 16
  • 17.
    Hotel Leela Venture| Initiating Coverage Company Background Hotel Leela Venture is one of the leading players in the Indian hospitality industry. The company is in the business of owning and operating five star deluxe hotels in the country, and caters to both, the leisure and business sectors. The company presently operates six hotels within the country (in Mumbai, Bangalore, Goa, Kovalam, Udaipur and Gurgaon), and has an inventory of around 1,190 owned rooms and 409 rooms under management contracts (in Gurgaon). The company has a management alliance with Kempinski Hotels for its hotels in India. The company has expansions plans lined up in the near future, with new properties in New Delhi and Chennai expected in FY2011E. Property-wise Details Until FY2009, HLVL had 4 operational properties at Mumbai, Bangalore, Goa and Kovalam, with an inventory of around 1,076 rooms. Recently, the company's Gurgaon property (in 1QFY2010) and its Udaipur property (in 1QFY2010) became operational, thereby spreading HLVL's presence to six locations in India, with around 1,600 rooms in its inventory. Exhibit 24: HLVL’s Properties Name Star rating No. of rooms Status The Leela Kempinski, Mumbai 5D 390 Owned The Leela Kempinski, Bangalore 5D 352 Owned The Leela Kempinski, Goa 5D 185 Owned The Leela Kempinski, Kovalam 5D 182 Owned The Leela Kempinski, Gurgaon 5D 409 Management Contract The Leela Kempinski, Udaipur 5D 81 Owned Source: Company, Angel Research The company has an ambitious expansion strategy, and plans to spread its presence in New Delhi, Chennai, Pune, Hyderabad and Agra. The construction work in New Delhi and Chennai is at an advanced stage, and the properties are likely to be operational in FY2011E. With respect to the Pune, Hyderabad and Agra plans, HLVL has already acquired land for the same, and is expected to commence work after the completion of the New Delhi and Chennai properties June 11, 2010 17
  • 18.
    Hotel Leela Venture| Initiating Coverage Annexure Indian Hotel Industry Overview The hotel industry in India was on a dream run during CY2004-08, with Occupancy rates (ORs) and Average Room Rates (ARRs) rising steadily due to the demand for rooms outstripping their supply. However, in the past year, the Indian (as well as the global) economy witnessed a very high degree of uncertainty and volatility. The slowdown in developed economies, resulted in a contraction in their GDP for the first time since World War II. The effects also spread to major emerging markets, such as China, India and Brazil, affecting several sectors including hospitality. According to the Travel and Tourism Competitiveness Report, 2009, brought out by the World Economic Forum, India is ranked 11th in the Asia-Pacific region and 62nd overall in a list of 133 assessed countries in 2008, up three places since 2007. In terms of travel, India stands 9th in the index of relative cost of access (ticket taxes and airport charges) to international air transport services, having among the lowest costs in the world. India also ranks second in medical tourism. The domestic tourism industry has a huge untapped potential, considering its land-mass, the diversity of its various locales and a roaring economy, which attract all types of tourists. Currently, India's share in the global tourism industry is just 1.2%. Meanwhile, the contribution of travel and tourism to the domestic GDP is expected to be at 6% (US $67.3bn) in 2009, and is estimated to rise to US $187.3bn by 2019 registering a CAGR of 10.8% over FY2009-19E. Dynamics across major areas The major cities in India can be differentiated into Leisure destinations and Business destinations. Places like Mumbai, Bangalore, Kolkata, Chennai, Delhi, Hyderabad, Pune, Ahmedabad and the NCR region primarily attract business travelers, due to the dominant corporate presence in these cities. Places like Agra, Jaipur, Goa and Kerala fall under the category of leisure destinations, since they attract the maximum tourist traffic. Many hotel players already have a presence, or plan to expand their presence in all these cities, due to a continuous surge in the demand for rooms. Out of the estimated 32,315 premium rooms in India in FY2009, around 90% fall in these major cities. With the demand for rooms outstripping their supply, the hotel players were on a dream-run over the past four to five years, helping them garner higher ORs and ARRs. Exhibit 25: ARR trends across major cities 16,000 14,000 ARRs (Rs) 12,000 10,000 8,000 6,000 4,000 2,000 0 Ahmadabad Jaipur Kolkata Hyderabad North Mumbai Chennai Goa Pune Delhi Kerala South Mumbai Bangalore Agra FY2006 FY2007 FY2008 FY2009 Source: Crisil, Angel Research June 11, 2010 18
  • 19.
    Hotel Leela Venture| Initiating Coverage Moreover, factors like the increased awareness about India as an attractive tourist destination, government initiatives, robust economic growth, an increase in average income levels and a change in the spending patterns of Indians, contributed towards increasing the tourist movement across India (from foreign and domestic travelers). However, this demand started declining in the latter half of CY2008, mainly due to the global economic slowdown, followed by the Mumbai terrorist attacks. This resulted in ORs and ARRs falling sharply across cities. However, with Foreign Tourist Arrivals (FTAs) trends improving substantially from December 2009, we expect the demand to improve in the coming months. Exhibit 26: Occupancy Trends across major cities 90 80 Occupancy rates (%) 70 60 50 40 30 20 10 0 Ahmadabad Delhi Bangalore Kolkata Agra Chennai Goa Jaipur Pune Kerala Hyderabad North Mumbai South Mumbai 2005 -06 2006 -07 2007 -08 2008 -09P Source: Crisil, Angel Research, Future Outlook With India emerging as a frontrunner in recovering from the global turmoil, signs of improving demand are visible again, with tourist movement picking up, thereby resulting in improving occupancy rates, which would consequently be followed by ARRs. The reversal in the trend is apparent from the fact that FTAs have improved by 15.1% during December 2009-March 2010 (against -12.7% during the comparable period of the previous year). Moreover, we expect the recovery in FTAs to speed up over the coming months, on the back of the improving economic activity and upcoming events like the Commonwealth Games 2010 and the Cricket Worldcup in India. We expect the industry to witness a significant recovery in CY2010E and to stabilise in CY2011E. June 11, 2010 19
  • 20.
    Hotel Leela Venture| Initiating Coverage Profit & Loss Statement Rs crore Y/E March FY2007 FY2008 FY2009 FY2010 FY2011E FY2012E Net Sales 393.7 536.4 470.1 436.2 631.9 874.1 Other operating income - - - - - - Total operating income 393.7 536.4 470.1 436.2 631.9 874.1 % chg 17.0 36.2 (12.4) (7.2) 44.9 38.3 Total Expenditure 211.6 306.9 325.3 309.6 377.3 510.5 Net Raw Materials 24.9 33.8 28.8 30.6 44.2 61.2 Other Mfg costs 59.7 84.4 87.5 44.0 108.7 143.4 Personnel 52.5 80.7 88.4 95.4 94.8 126.7 Other 74.6 108.0 120.6 139.6 129.5 179.2 EBITDA EBITDA 182.1 229.5 144.8 126.6 254.7 363.6 % chg 15.5 26.0 (36.9) (12.5) 101.2 42.8 (% of Net Sales) 46.2 42.8 30.8 29.0 40.3 41.6 Depreciation& Amortisation 33.8 45.3 54.9 68.3 76.0 81.1 EBIT 148.3 184.1 89.8 58.3 178.7 282.5 % chg 18.5 24.1 (51.2) (35.1) 206.6 58.1 (% of Net Sales) 37.7 34.3 19.1 13.4 28.3 32.3 Interest & other Charges 40.7 36.9 27.2 24.5 92.8 151.2 Other Income 25.6 29.8 23.7 26.9 26.0 26.0 (% of PBT) 19.2 16.8 27.5 44.3 23.2 16.5 Recurring PBT 133.2 177.0 86.3 60.7 111.9 157.3 % chg 23.3 32.9 (51.2) (29.7) 84.5 40.6 Extraordinary Income/(Exp.) 56.29 46.15 106.23 PBT (reported) 189.5 223.2 192.6 60.7 111.9 157.3 Tax 63.3 73.2 47.6 19.6 36.9 55.1 (% of PBT) 33.4 32.8 24.7 32.4 33.0 35.0 PAT (reported) 126.2 150.0 145.0 41.0 75.0 102.3 ADJ. PAT ADJ. PA 70.0 103.8 38.8 41.0 75.0 102.3 % chg 0.4 48.4 (62.7) 5.9 82.7 36.4 (% of Net Sales) 17.8 19.4 8.2 9.4 11.9 11.7 Basic EPS (Rs) 1.9 2.7 1.0 1.1 2.0 2.7 Fully Diluted EPS (Rs) 1.9 2.7 1.0 1.1 2.0 2.7 % chg (0.1) 45.5 (62.7) 5.9 82.7 36.4 June 11, 2010 20
  • 21.
    Hotel Leela Venture| Initiating Coverage Balance Sheet Rs crore Y/E March FY2007 FY2008 FY2009 FY2010 FY2011E FY2012E SOURCES OF FUNDS Equity Share Capital 74 76 76 76 76 76 Preference Capital - - - - - - Reserves& Surplus 827 855 1,865 1,897 1,955 2,040 Funds Shareholders Funds 901 930 1,940 1,973 2,031 2,116 Total Loans 953 2,036 2,450 2,450 2,450 2,410 Deferred Tax Liability 75 91 100 100 100 100 Total Liabilities 1,929 3,057 4,490 4,522 4,581 4,627 APPLICATION OF FUNDS APPLICATION Gross Block 1,797 2,604 3,833 4,207 4,768 4,843 Less: Acc. Depreciation 279 336 398 463 539 620 Net Block 1,518 2,268 3,435 3,744 4,229 4,223 Capital Work-in-Progress 193 406 935 561 75 75 Goodwill - - - - - - Investments 60 0 46 46 46 46 Current Assets 274 589 396 422 594 785 Cash 11 296 30 28 113 119 Loans & Advances 194 216 292 323 381 527 Other 69 77 73 72 100 139 Current liabilities 115 206 322 251 364 503 Net Current Assets 159 383 74 171 231 282 Mis. Exp. not written off - - - - - - Total Assets 1,929 3,057 4,490 4,522 4,581 4,627 June 11, 2010 21
  • 22.
    Hotel Leela Venture| Initiating Coverage Cash Flow Statement Rs crore Y/E March FY2007 FY2008 FY2009 FY2010 FY2011E FY2012E Profit before tax 190 223 193 61 112 157 Depreciation 34 45 55 68 76 81 Change in Working Capital (4) 82 120 (69) 84 101 Less: Other income 110 77 130 27 26 26 Direct taxes paid 63 73 48 20 37 55 Cash Flow from Operations 46 201 190 13 209 258 (Inc)./ Dec in Fixed Assets (199) (1,008) (1,751) (4) (75) (75) (Inc)./ Dec in Investments - 60 (46) - - - (Inc)/ Dec in loans and advances 5 (22) (76) (30) (58) (146) Other income 110 77 130 27 26 26 Cash Flow from Investing (84) (894) (1,743) (7) (107) (195) Issue of Equity 0 2 - - - - Inc./(Dec.) in loans (104) 1,083 414 - 1 (40) Dividend Paid (Incl. Tax) (17) (19) (15) (8) (15) (15) Others 6 (88) 889 (1) (2) (2) Financing Cash Flow from Financing (114) 978 1,288 (8) (16) (57) Inc./(Dec.) in Cash (152) 285 (265) (3) 85 6 Opening Cash balances 163 11 296 30 28 113 Closing Cash balances 11 296 30 28 113 119 June 11, 2010 22
  • 23.
    Hotel Leela Venture| Initiating Coverage Key Ratios Y/E March FY2007 FY2008 FY2009 FY2010 FY2011E FY2012E Valuation Ratio (x) P/E (on FDEPS) 24.4 16.7 44.8 42.4 23.2 17.0 P/CEPS 16.4 11.7 18.6 15.9 11.5 9.5 P/BV # 2.5 2.4 2.5 2.4 2.2 2.0 Dividend yield (%) 1.0 1.1 0.9 0.4 0.9 0.9 EV/Sales 6.8 6.5 8.8 9.5 6.4 4.6 EV/EBITDA 14.7 15.2 28.7 32.9 16.0 11.1 EV / Total Assets 1.3 1.0 0.7 0.8 0.9 0.9 EV/Room 2.5 3.2 3.9 3.5 2.2 2.2 Per Share Data (Rs) EPS (Basic) 1.9 2.7 1.0 1.1 2.0 2.7 EPS (fully diluted) 1.9 2.7 1.0 1.1 2.0 2.7 Cash EPS 2.8 3.9 2.5 2.9 4.0 4.9 DPS 0.5 0.5 0.4 0.2 0.4 0.4 Book Value # 18.5 19.0 18.6 19.5 21.0 23.2 Dupont Analysis EBIT margin 37.7 34.3 19.1 13.4 28.3 32.3 Tax retention ratio 0.7 0.7 0.8 0.7 0.7 0.7 Asset turnover (x) 0.2 0.3 0.2 0.1 0.2 0.3 ROIC (Post-tax) # 5.9 5.9 2.3 1.2 3.7 5.6 Cost of Debt (Post Tax) 2.7 1.7 0.9 0.6 2.5 4.0 Leverage (x) 1.4 1.9 2.9 3.4 3.1 2.8 Operating ROE # 10.4 14.0 6.2 3.0 7.5 10.1 Returns (%) ROCE (Pre-tax) # 8.7 6.5 2.8 1.8 5.3 8.3 Angel ROIC (Pre-tax) # 9.2 8.7 3.1 1.8 5.5 8.7 ROE # 10.8 14.8 5.5 5.7 9.8 12.2 Turnover ratios (x) Asset Turnover (Gross Block) 0.2 0.2 0.1 0.1 0.1 0.2 Inventory / Sales (days) 27 24 31 33 24 24 Receivables (days) 29 26 27 28 25 26 Payables (days) 157 116 149 186 170 177 WC cycle (ex-cash) (days) 275 160 102 157 151 117 Solvency ratios (x) Net debt to equity 1.0 1.9 1.2 1.2 1.2 1.1 Net debt to EBITDA 5.2 7.6 16.7 19.1 9.2 6.3 Interest Coverage (EBIT / Interest) 3.6 5.0 3.3 2.4 1.9 1.9 Note: # Excluding revaluation reserves June 11, 2010 23
  • 24.
    Hotel Leela Venture Disclaimer Thisdocument is solely for the personal information of the recipient, and must not be singularly used as the basis of any investment decision. Nothing in this document should be construed as investment or financial advice. Each recipient of this document should make such investigations as they deem necessary to arrive at an independent evaluation of an investment in the securities of the companies referred to in this document (including the merits and risks involved), and should consult their own advisors to determine the merits and risks of such an investment. Angel Securities Limited, its affiliates, directors, its proprietary trading and investment businesses may, from time to time, make investment decisions that are inconsistent with or contradictory to the recommendations expressed herein. The views contained in this document are those of the analyst, and the company may or may not subscribe to all the views expressed within. Reports based on technical and derivative analysis center on studying charts of a stock's price movement, outstanding positions and trading volume, as opposed to focusing on a company's fundamentals and, as such, may not match with a report on a company's fundamentals. The information in this document has been printed on the basis of publicly available information, internal data and other reliable sources believed to be true, and is for general guidance only. Angel Securities Limited has not independently verified all the information contained within this document. Accordingly, we cannot testify, nor make any representation or warranty, express or implied, to the accuracy, contents or data contained within this document. While Angel Securities Limited endeavours to update on a reasonable basis the information discussed in this material, there may be regulatory, compliance, or other reasons that prevent us from doing so. This document is being supplied to you solely for your information, and its contents, information or data may not be reproduced, redistributed or passed on, directly or indirectly. Angel Securities Limited and its affiliates may seek to provide or have engaged in providing corporate finance, investment banking or other advisory services in a merger or specific transaction to the companies referred to in this report, as on the date of this report or in the past. Neither Angel Securities Limited, nor its directors, employees or affiliates shall be liable for any loss or damage that may arise from or in connection with the use of this information. Note: Please refer to the important `Stock Holding Disclosure' report on the Angel website (Research Section). Disclosure of Interest Statement Hotel Leela Leela 1. Analyst ownership of the stock No 2. Angel and its Group companies ownership of the stock No 3. Angel and its Group companies' Directors ownership of the stock No 4. Broking relationship with company covered No Note: We have not considered any Exposure below Rs 1 lakh for Angel, its Group companies and Directors. Ratings (Returns) : Buy (> 15%) Accumulate (5% to 15%) Neutral (-5 to 5%) Reduce (-5% to 15%) Sell (< -15%)
  • 25.
    Hotel Leela Venture Address: Acme Plaza, ‘A’ Wing, 3rd Floor, M.V. Road, Opp. Sangam Cinema, Andheri (E), Mumbai - 400 059. Tel : (022) 3952 4568 / 4040 3800 Research Team Fundamental: Sarabjit Kour Nangra VP-Research, Pharmaceutical sarabjit@angeltrade.com Vaibhav Agrawal VP-Research, Banking vaibhav.agrawal@angeltrade.com Vaishali Jajoo Automobile vaishali.jajoo@angeltrade.com Shailesh Kanani Infrastructure, Real Estate shailesh.kanani@angeltrade.com Anand Shah FMCG , Media anand.shah@angeltrade.com Deepak Pareek Oil & Gas deepak.pareek@angeltrade.com Puneet Bambha Capital Goods, Engineering puneet.bambha@angeltrade.com Sushant Dalmia Pharmaceutical sushant.dalmia@angeltrade.com Rupesh Sankhe Cement, Power rupeshd.sankhe@angeltrade.com Param Desai Real Estate, Logistics, Shipping paramv.desai@angeltrade.com Sageraj Bariya Fertiliser, Mid-cap sageraj.bariya@angeltrade.com Viraj Nadkarni Retail, Hotels, Mid-cap virajm.nadkarni@angeltrade.com Paresh Jain Metals & Mining pareshn.jain@angeltrade.com Amit Rane Banking amitn.rane@angeltrade.com Rahul Jain IT, Telecom rahul.j@angeltrade.com Jai Sharda Mid-cap jai.sharda@angeltrade.com Sharan Lillaney Mid-cap sharanb.lillaney@angeltrade.com Amit Vora Research Associate (Oil & Gas) amit.vora@angeltrade.com V Srinivasan Research Associate (Cement, Power) v.srinivasan@angeltrade.com Aniruddha Mate Research Associate (Infra, Real Estate) aniruddha.mate@angeltrade.com Mihir Salot Research Associate (Logistics, Shipping) mihirr.salot@angeltrade.com Chitrangda Kapur Research Associate (FMCG, Media) chitrangdar.kapur@angeltrade.com Vibha Salvi Research Associate (IT, Telecom) vibhas.salvi@angeltrade.com Pooja Jain Research Associate (Metals & Mining) pooja.j@angeltrade.com Technicals: Shardul Kulkarni Sr. Technical Analyst shardul.kulkarni@angeltrade.com Mileen Vasudeo Technical Analyst vasudeo.kamalakant@angeltrade.com Derivatives: Siddarth Bhamre Head - Derivatives siddarth.bhamre@angeltrade.com Jaya Agarwal Derivative Analyst jaya.agarwal@angeltrade.com Sandeep Patil Jr. Derivative Analyst patil.sandeep@angeltrade.com Institutional Sales Team: Mayuresh Joshi VP - Institutional Sales mayuresh.joshi@angeltrade.com Abhimanyu Sofat AVP - Institutional Sales abhimanyu.sofat@angeltrade.com Nitesh Jalan Sr. Manager niteshk.jalan@angeltrade.com Pranav Modi Sr. Manager pranavs.modi@angeltrade.com Sandeep Jangir Sr. Manager sandeepp.jangir@angeltrade.com Ganesh Iyer Sr. Manager ganeshb.Iyer@angeltrade.com Jay Harsora Sr. Dealer jayr.harsora@angeltrade.com Meenakshi Chavan Dealer meenakshis.chavan@angeltrade.com Gaurang Tisani Dealer gaurangp.tisani@angeltrade.com Production Team: Bharathi Shetty Research Editor bharathi.shetty@angeltrade.com Bharat Patil Production bharat.patil@angeltrade.com Dilip Patel Production dilipm.patel@angeltrade.com Angel Broking Ltd: BSE Sebi Regn No : INB 010996539 / CDSL Regn No: IN - DP - CDSL - 234 - 2004 / PMS Regn Code: PM/INP000001546 Angel Securities Ltd:BSE: INB010994639/INF010994639 NSE: INB230994635/INF230994635 Membership numbers: BSE 028/NSE:09946 Angel Capital & Debt Market Ltd: INB 231279838 / NSE FNO: INF 231279838 / NSE Member code -12798 Angel Commodities Broking (P) Ltd: MCX Member ID: 12685 / FMC Regn No: MCX / TCM / CORP / 0037 NCDEX : Member ID 00220 / FMC Regn No: NCDEX / TCM / CORP / 0302