Download to read offline
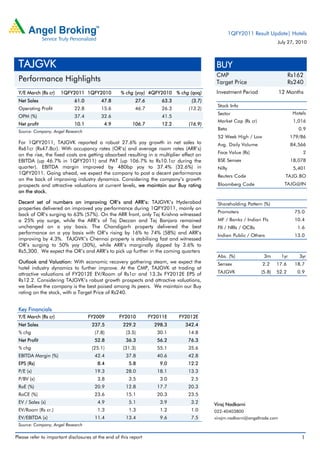


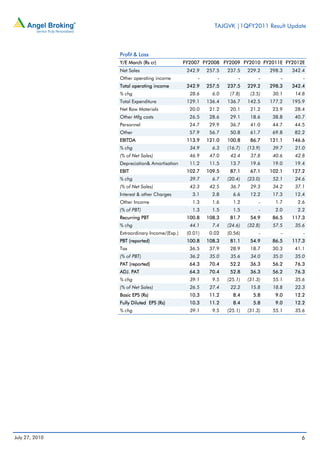


TAJGVK reported a 27.6% year-over-year growth in net sales to Rs61 crore for the first quarter of FY2011, driven by rising occupancy rates and average room rates. Operating profit grew 46.7% due to higher sales absorbing fixed costs, and net profit increased 106.7% as improved operating performance flowed down to the bottom line. Going forward, the company expects to benefit from the economic recovery and expanding presence across markets like Hyderabad, Chennai, and Bangalore through both organic and inorganic growth initiatives. The analyst maintains a buy rating on TAJGVK due to its dominant position, expansion plans, and attractive valuation at current levels.


