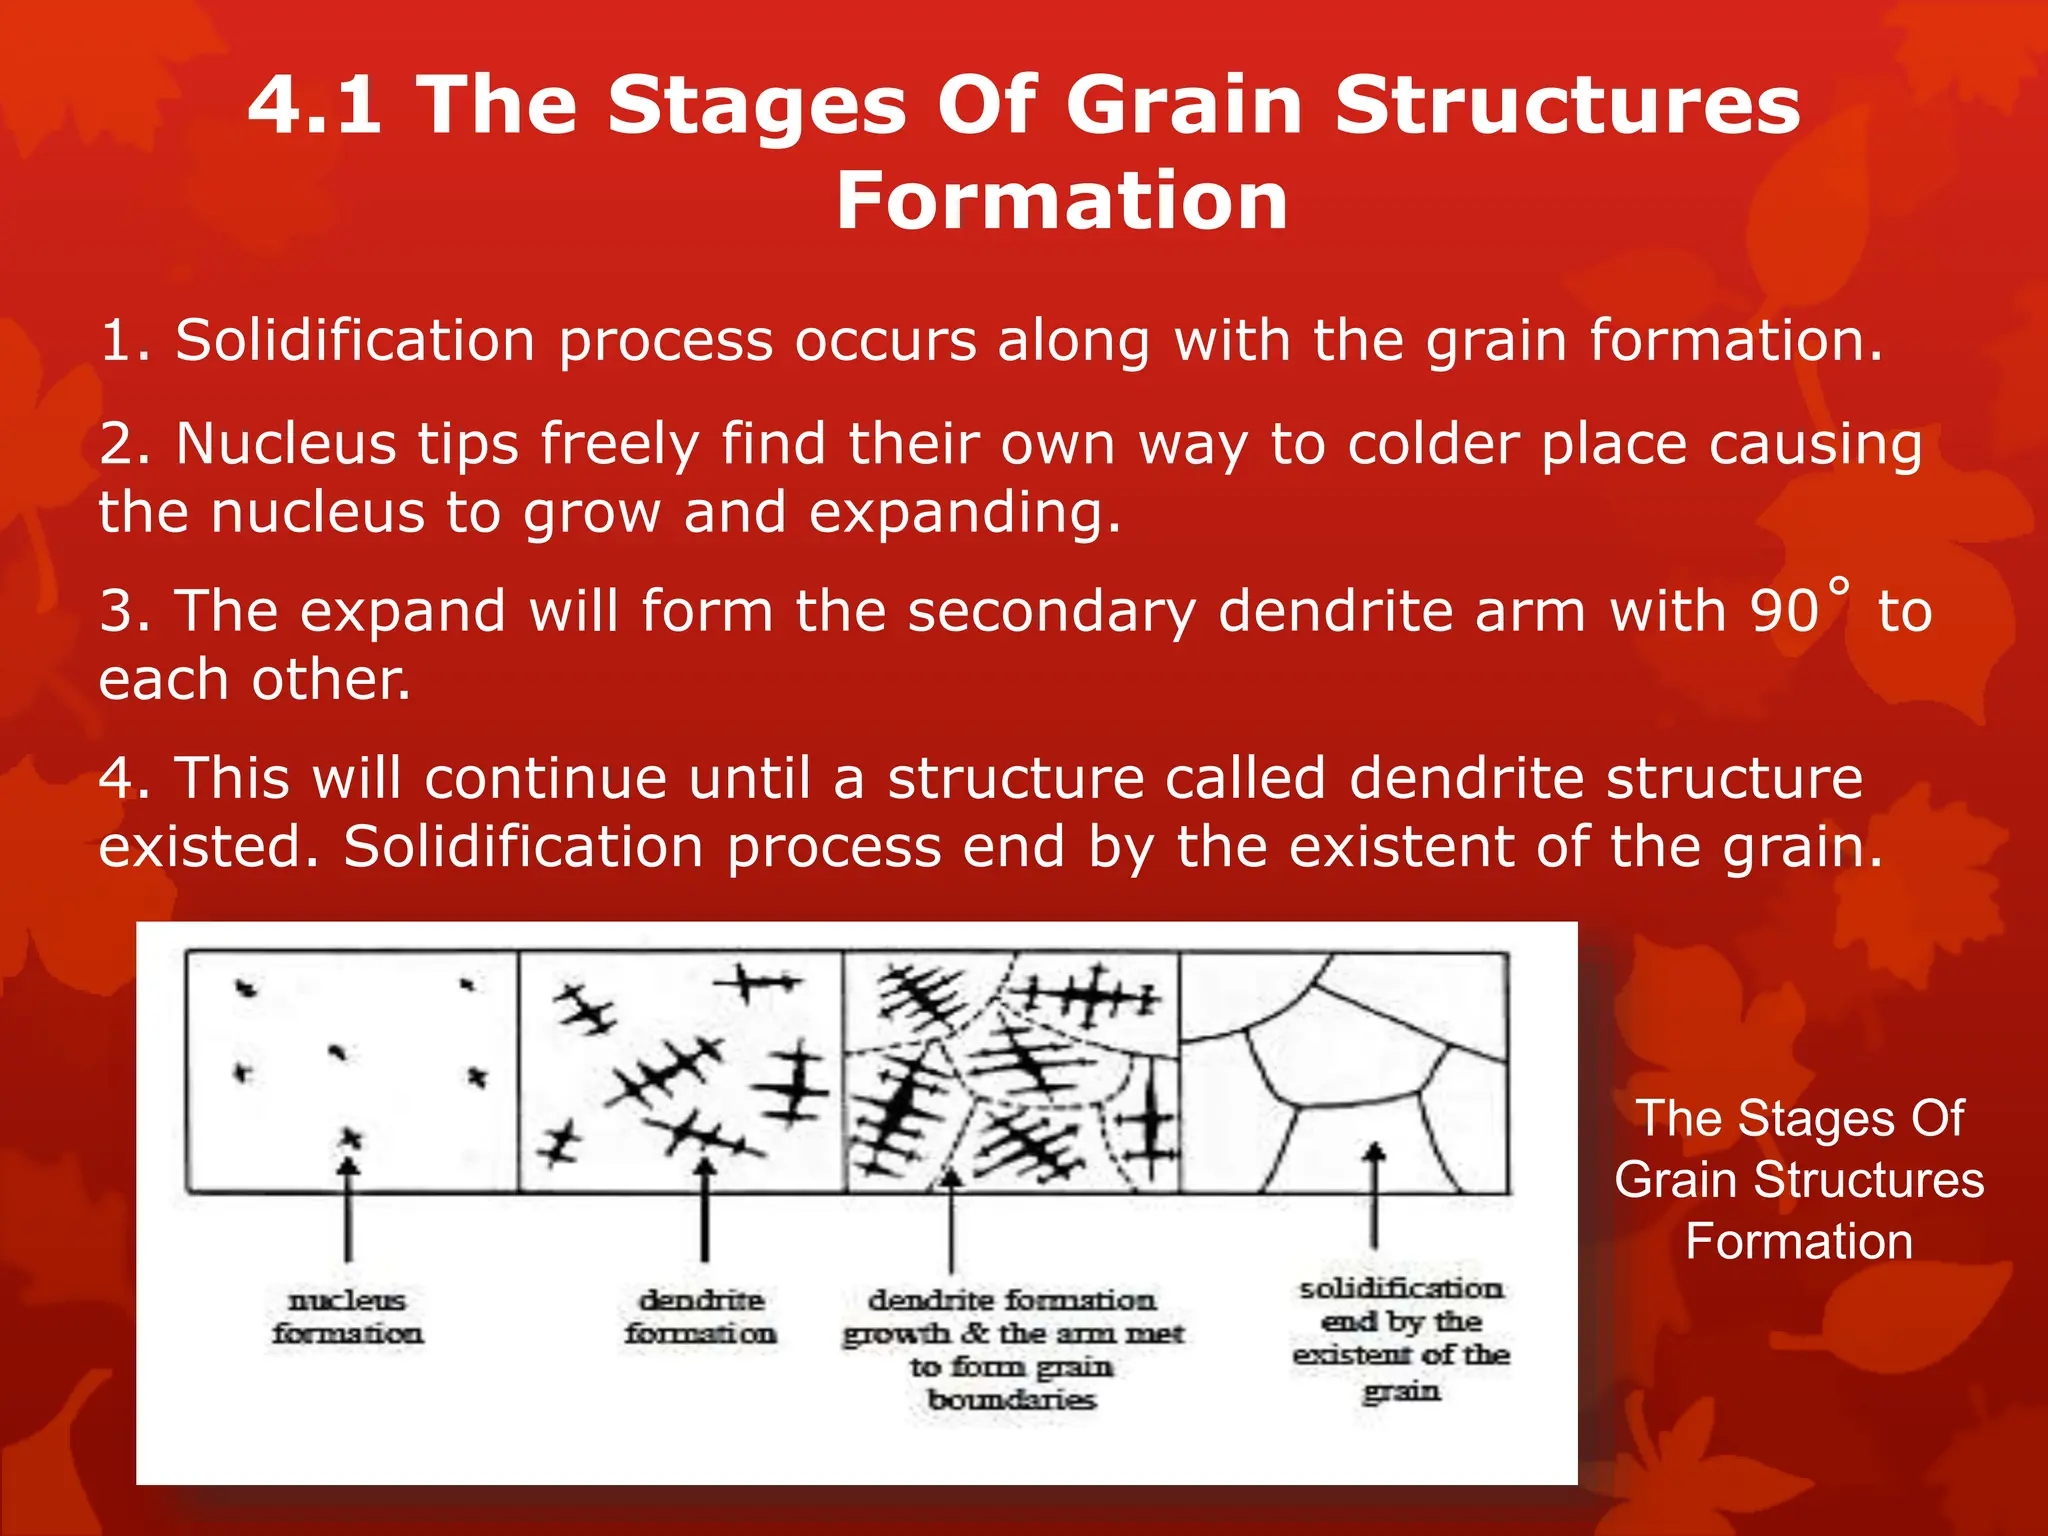
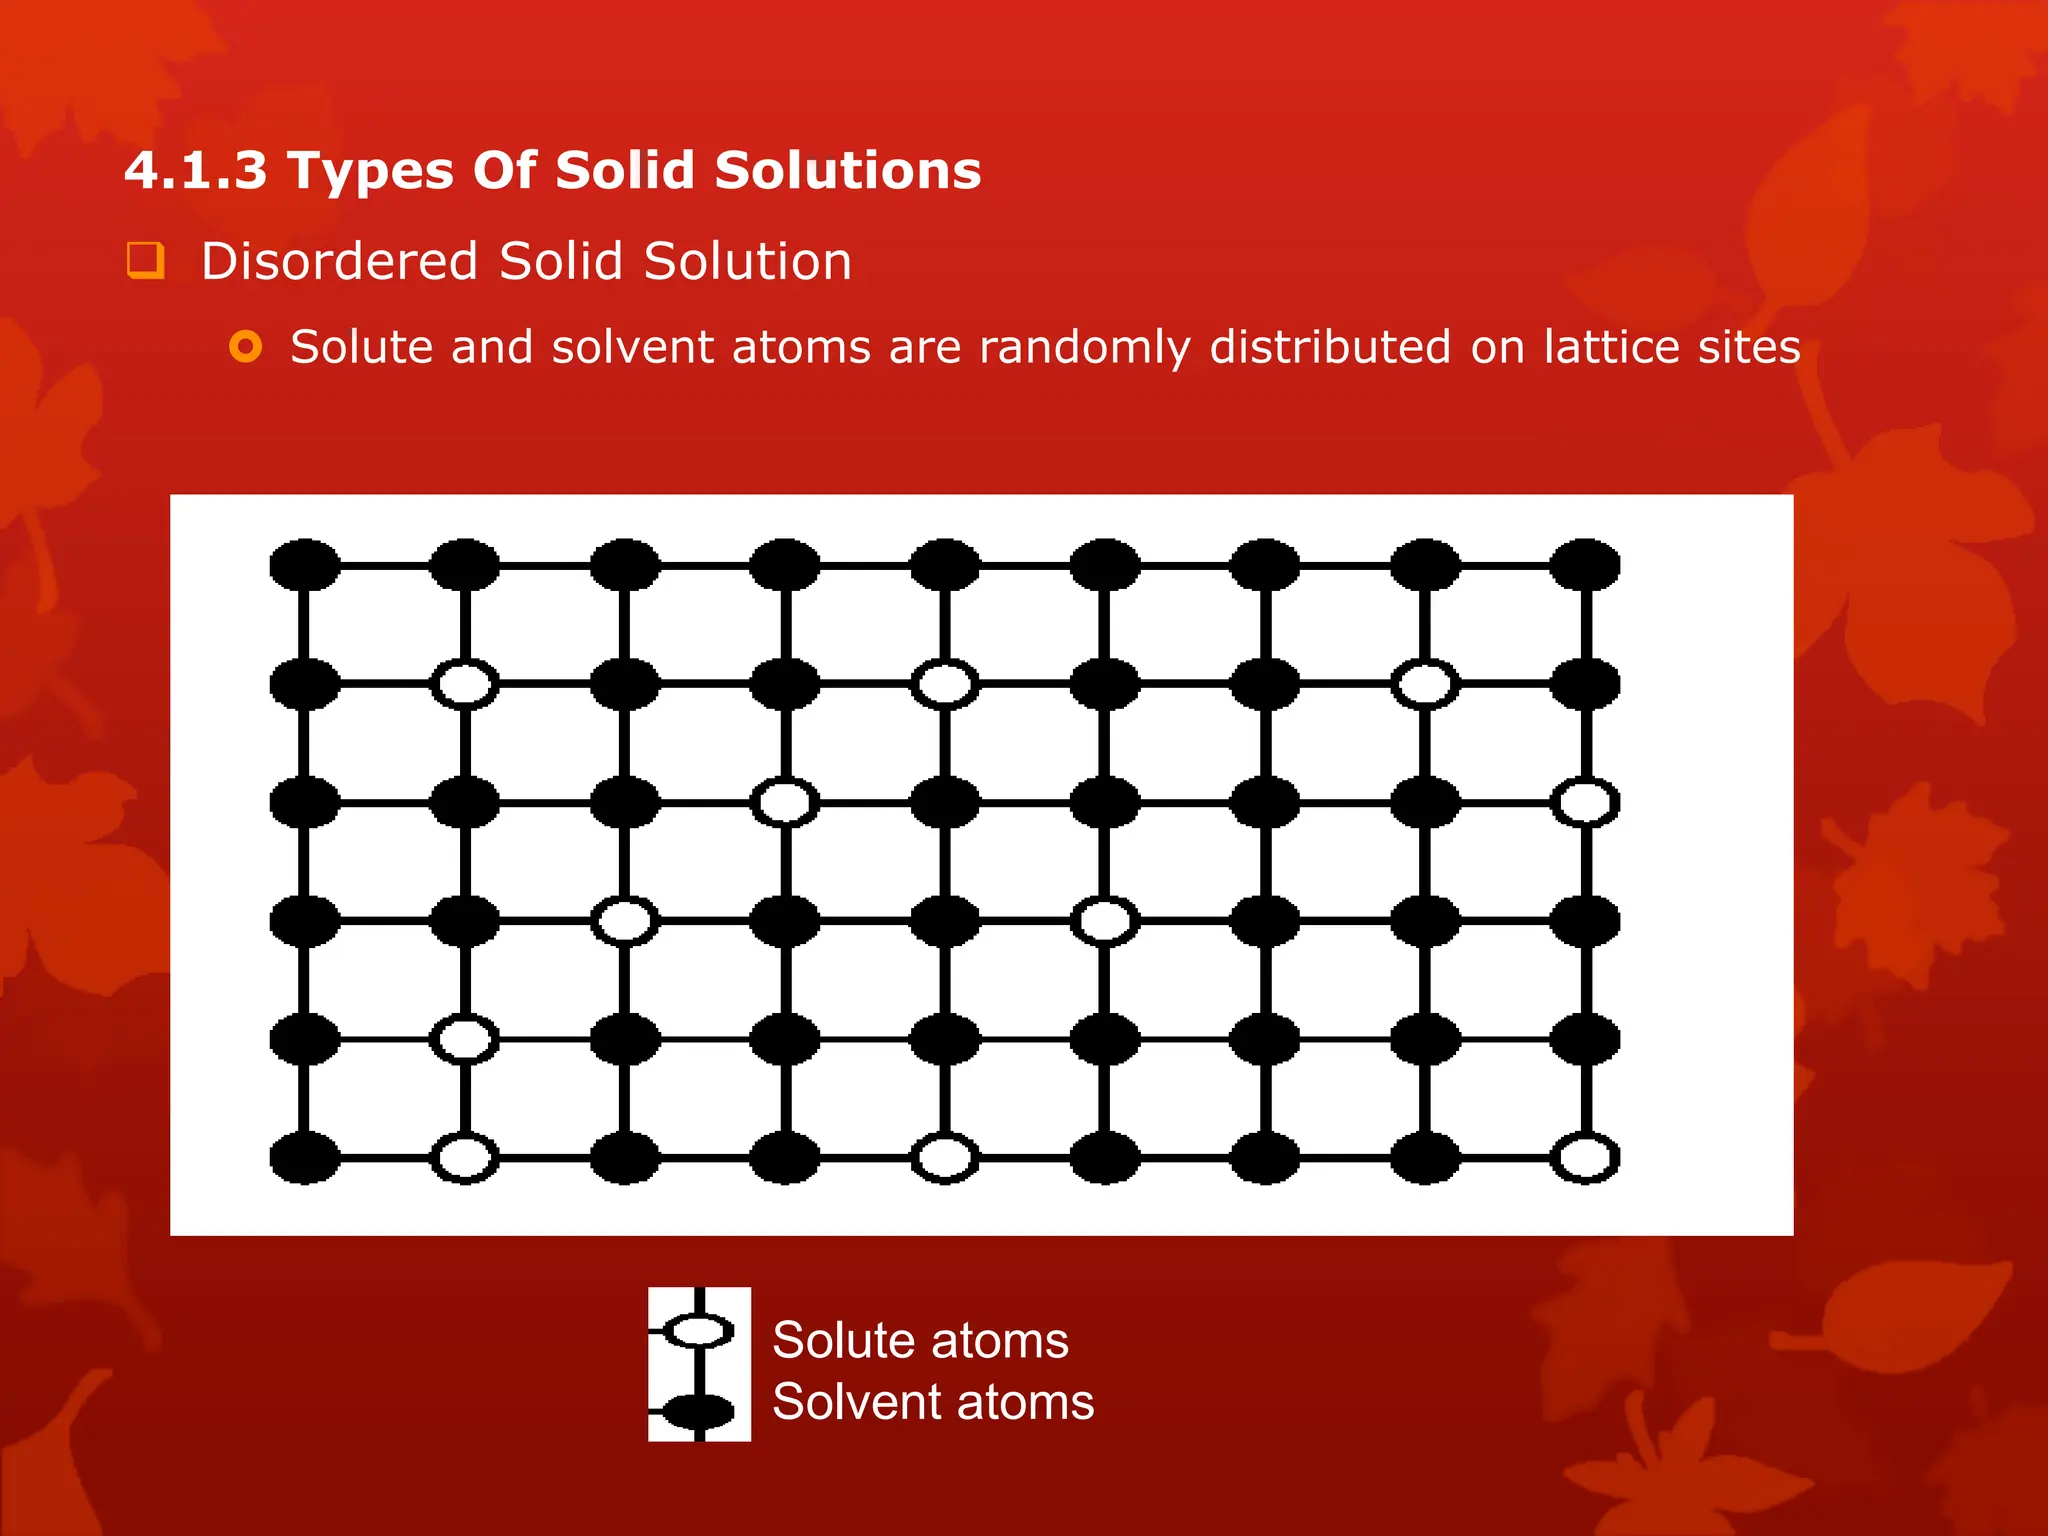
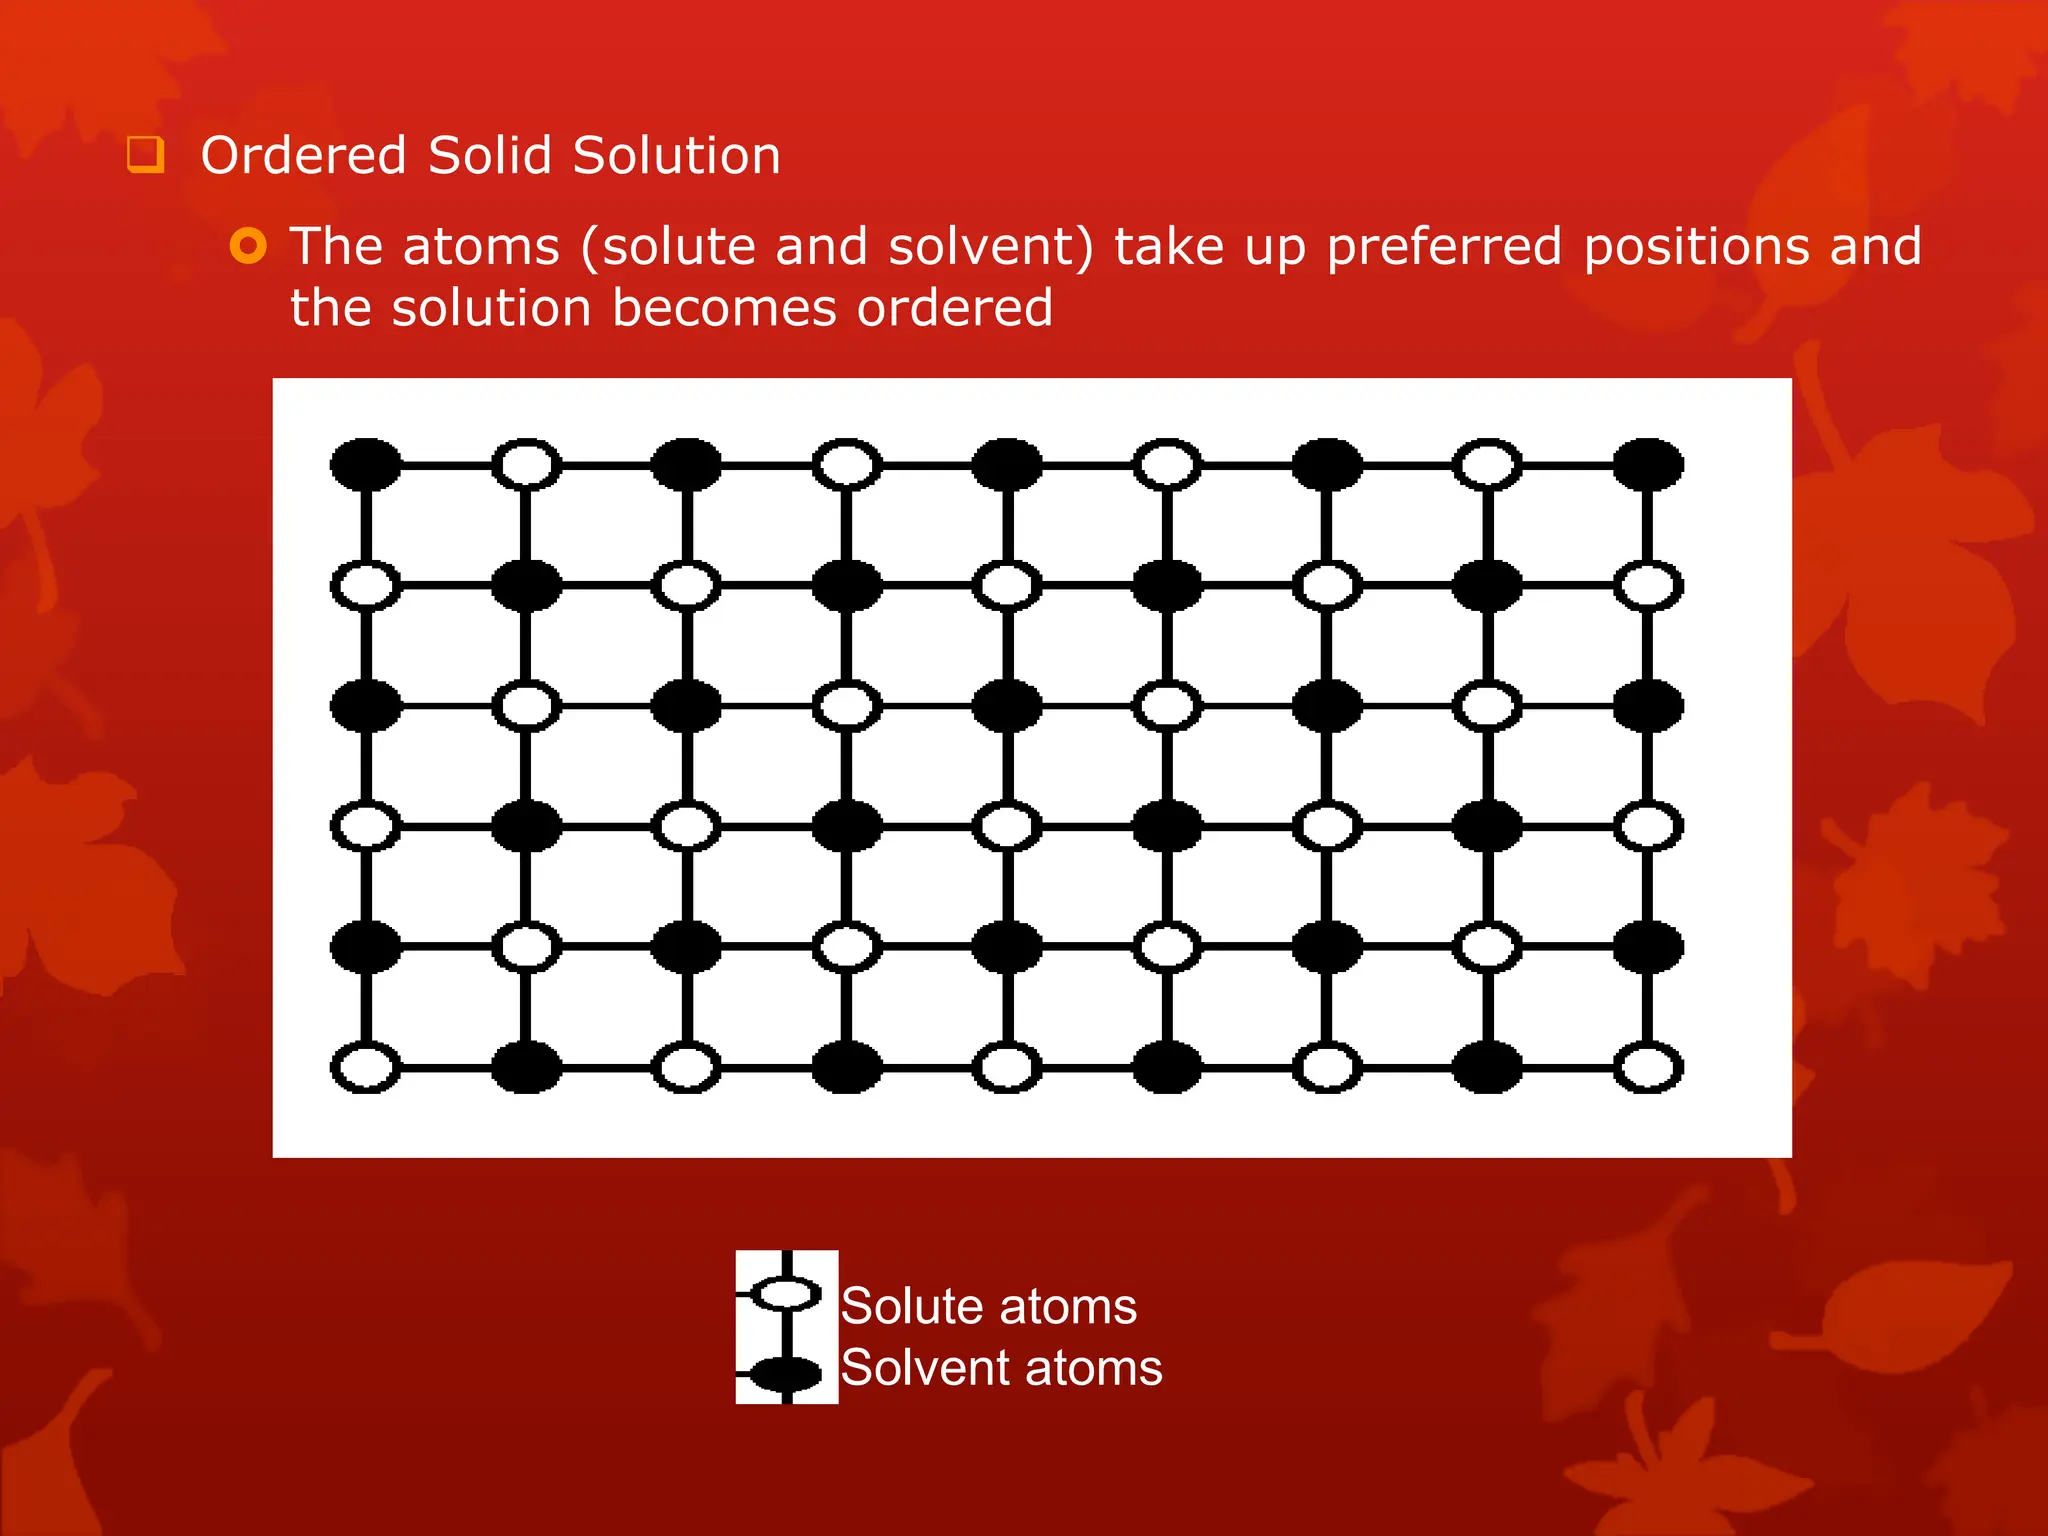
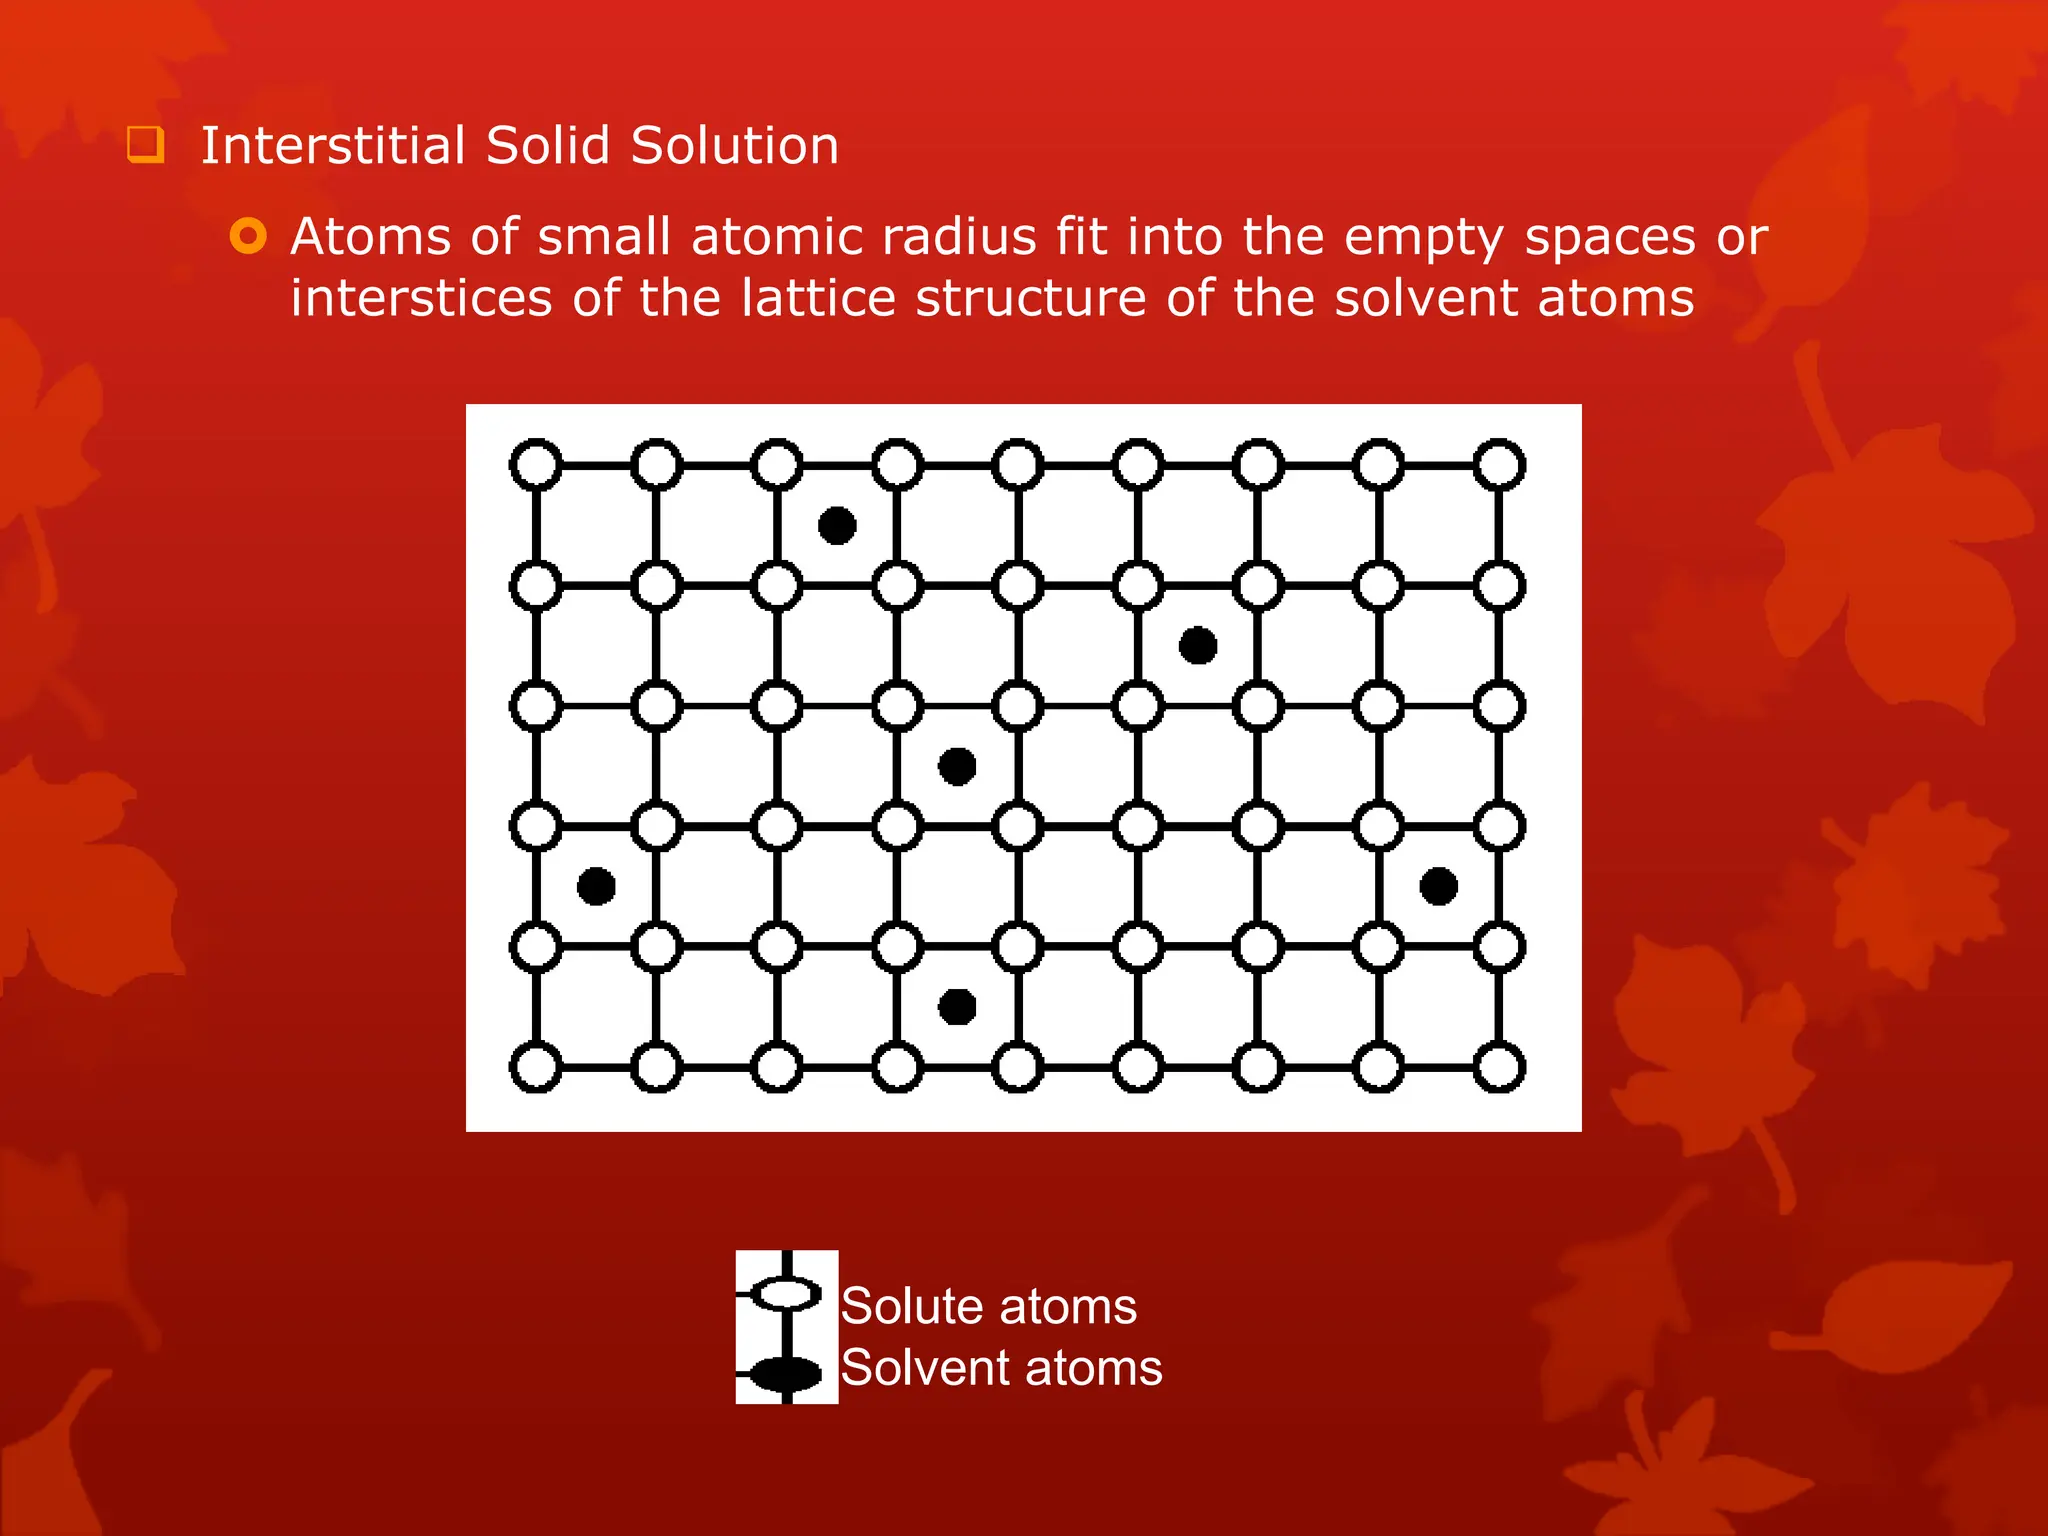
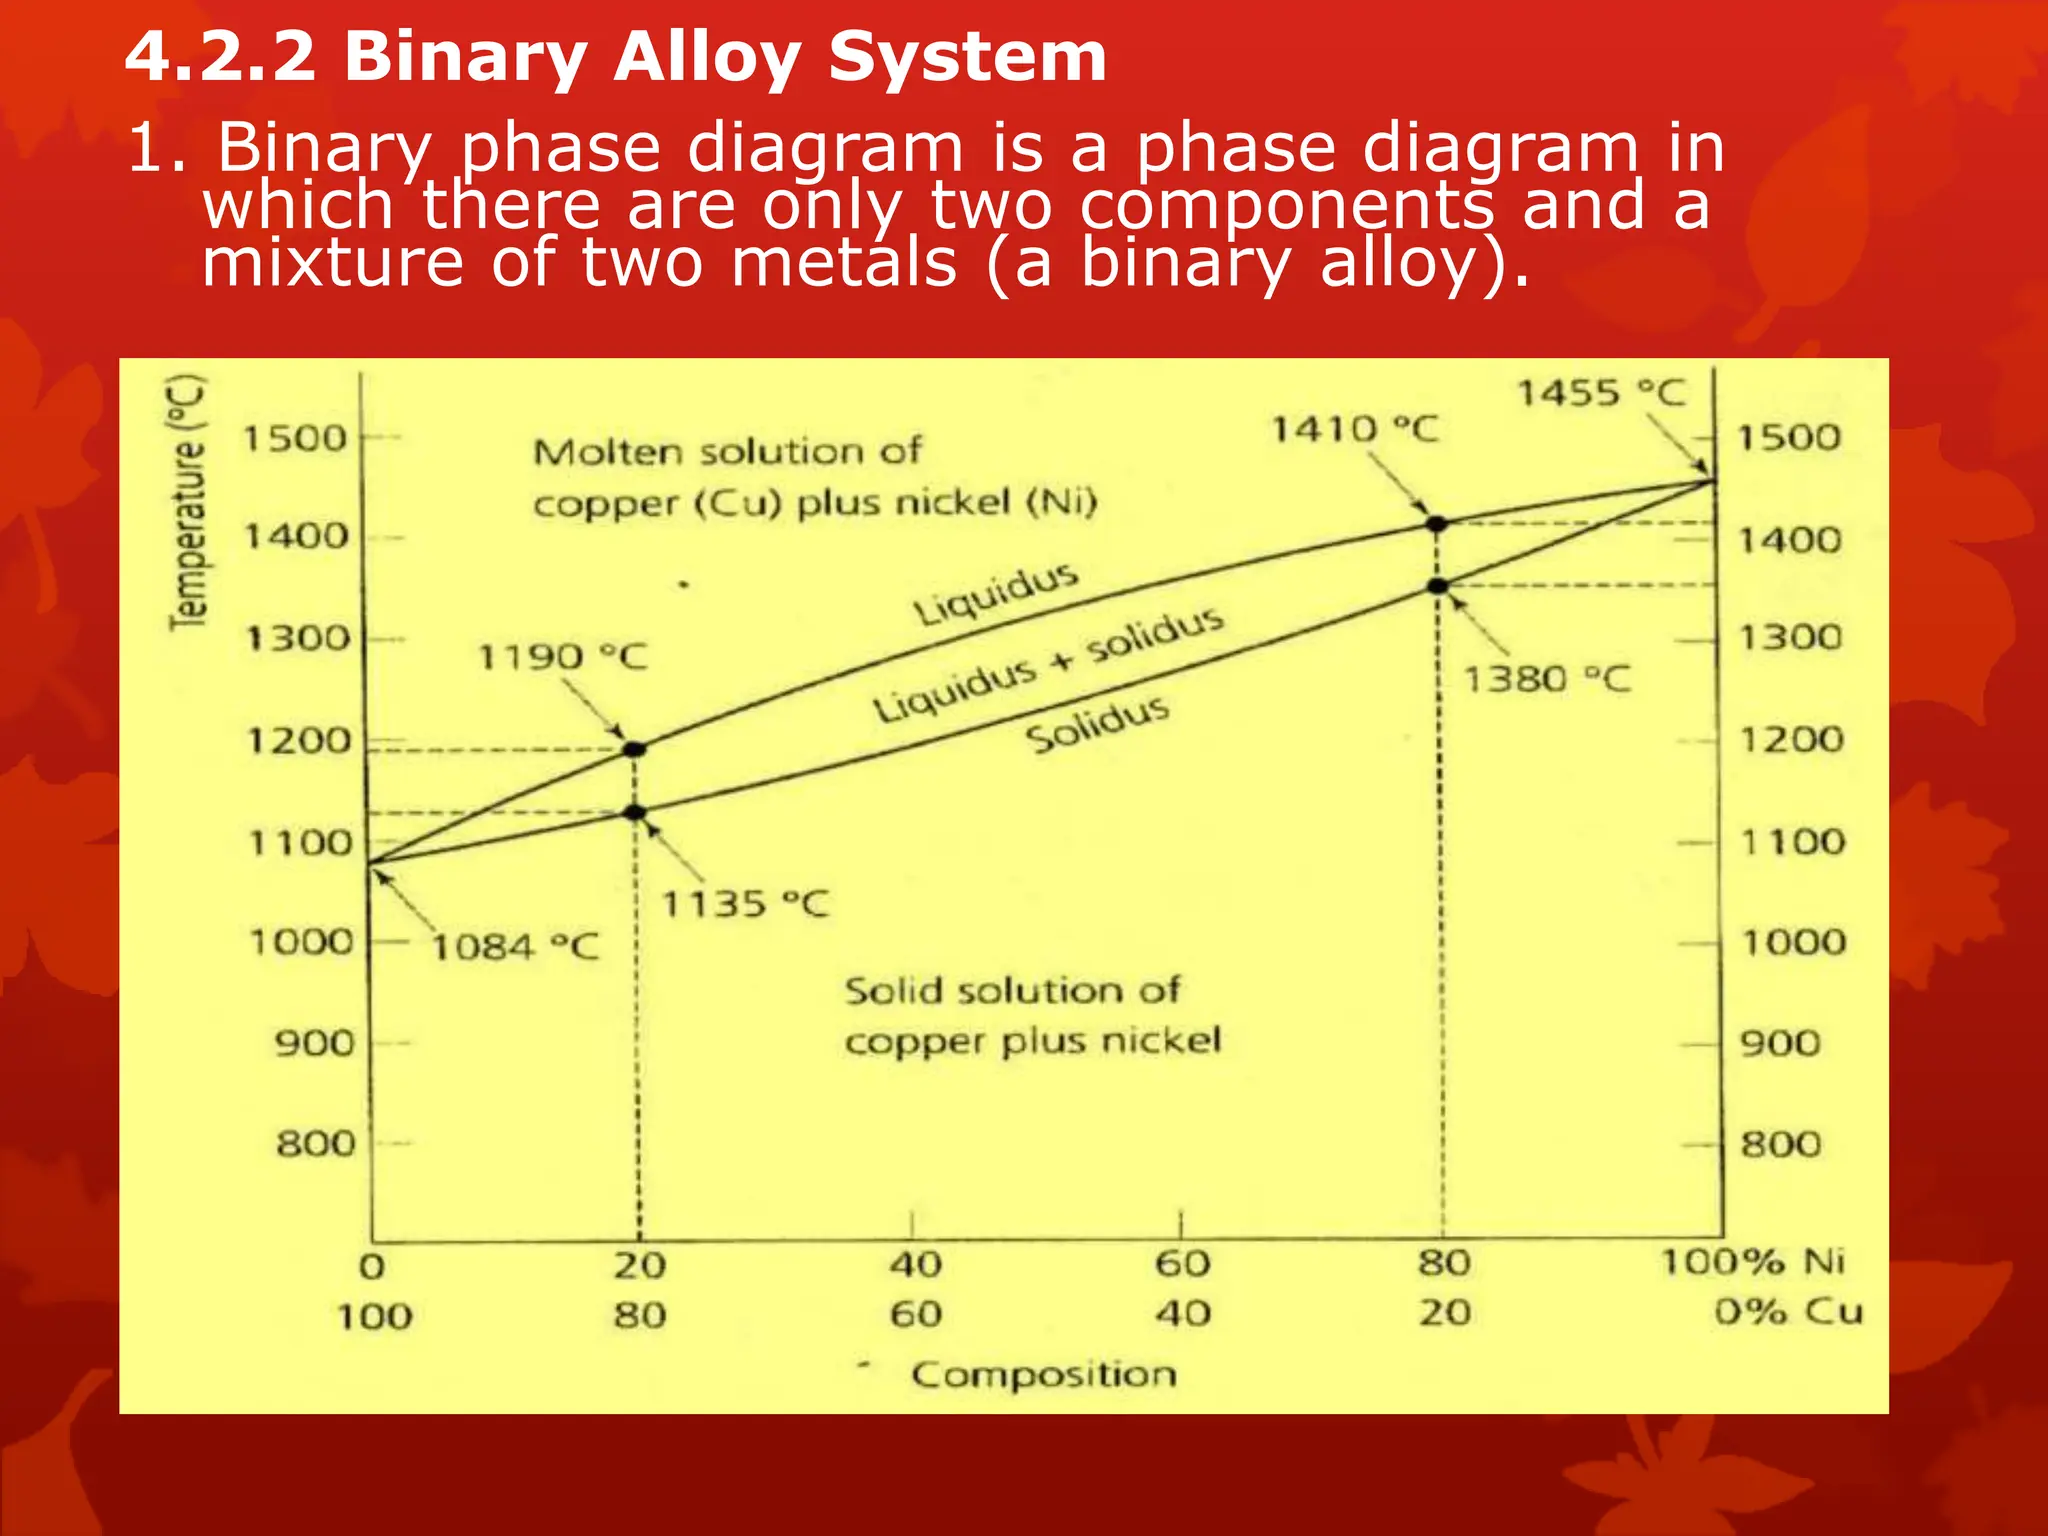
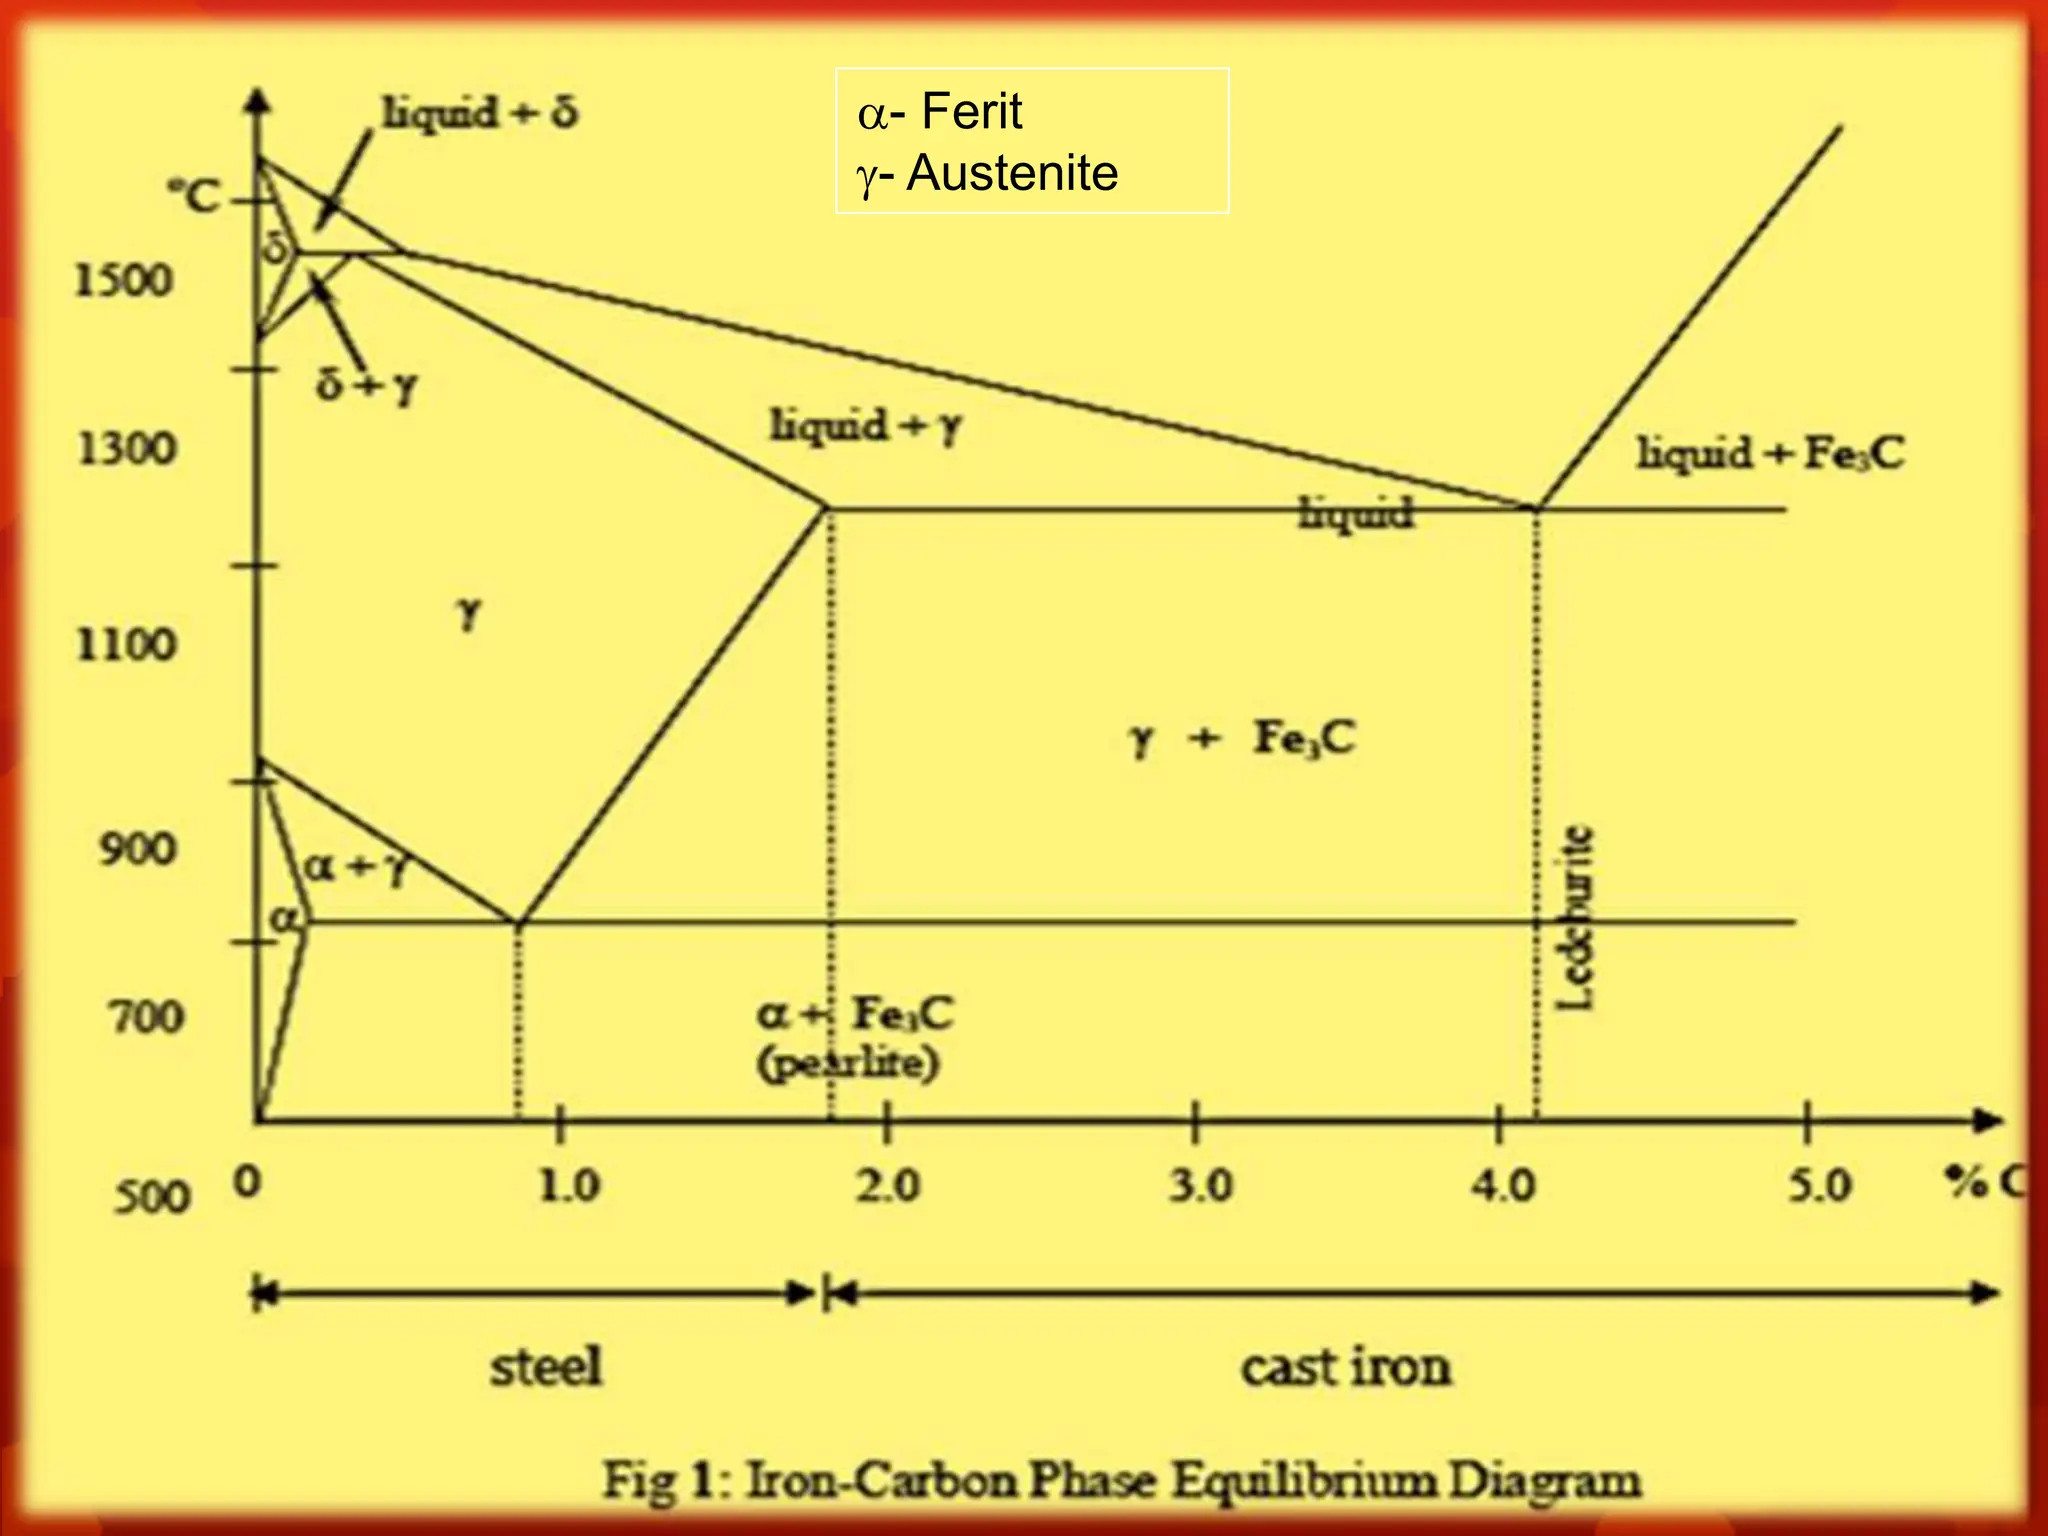
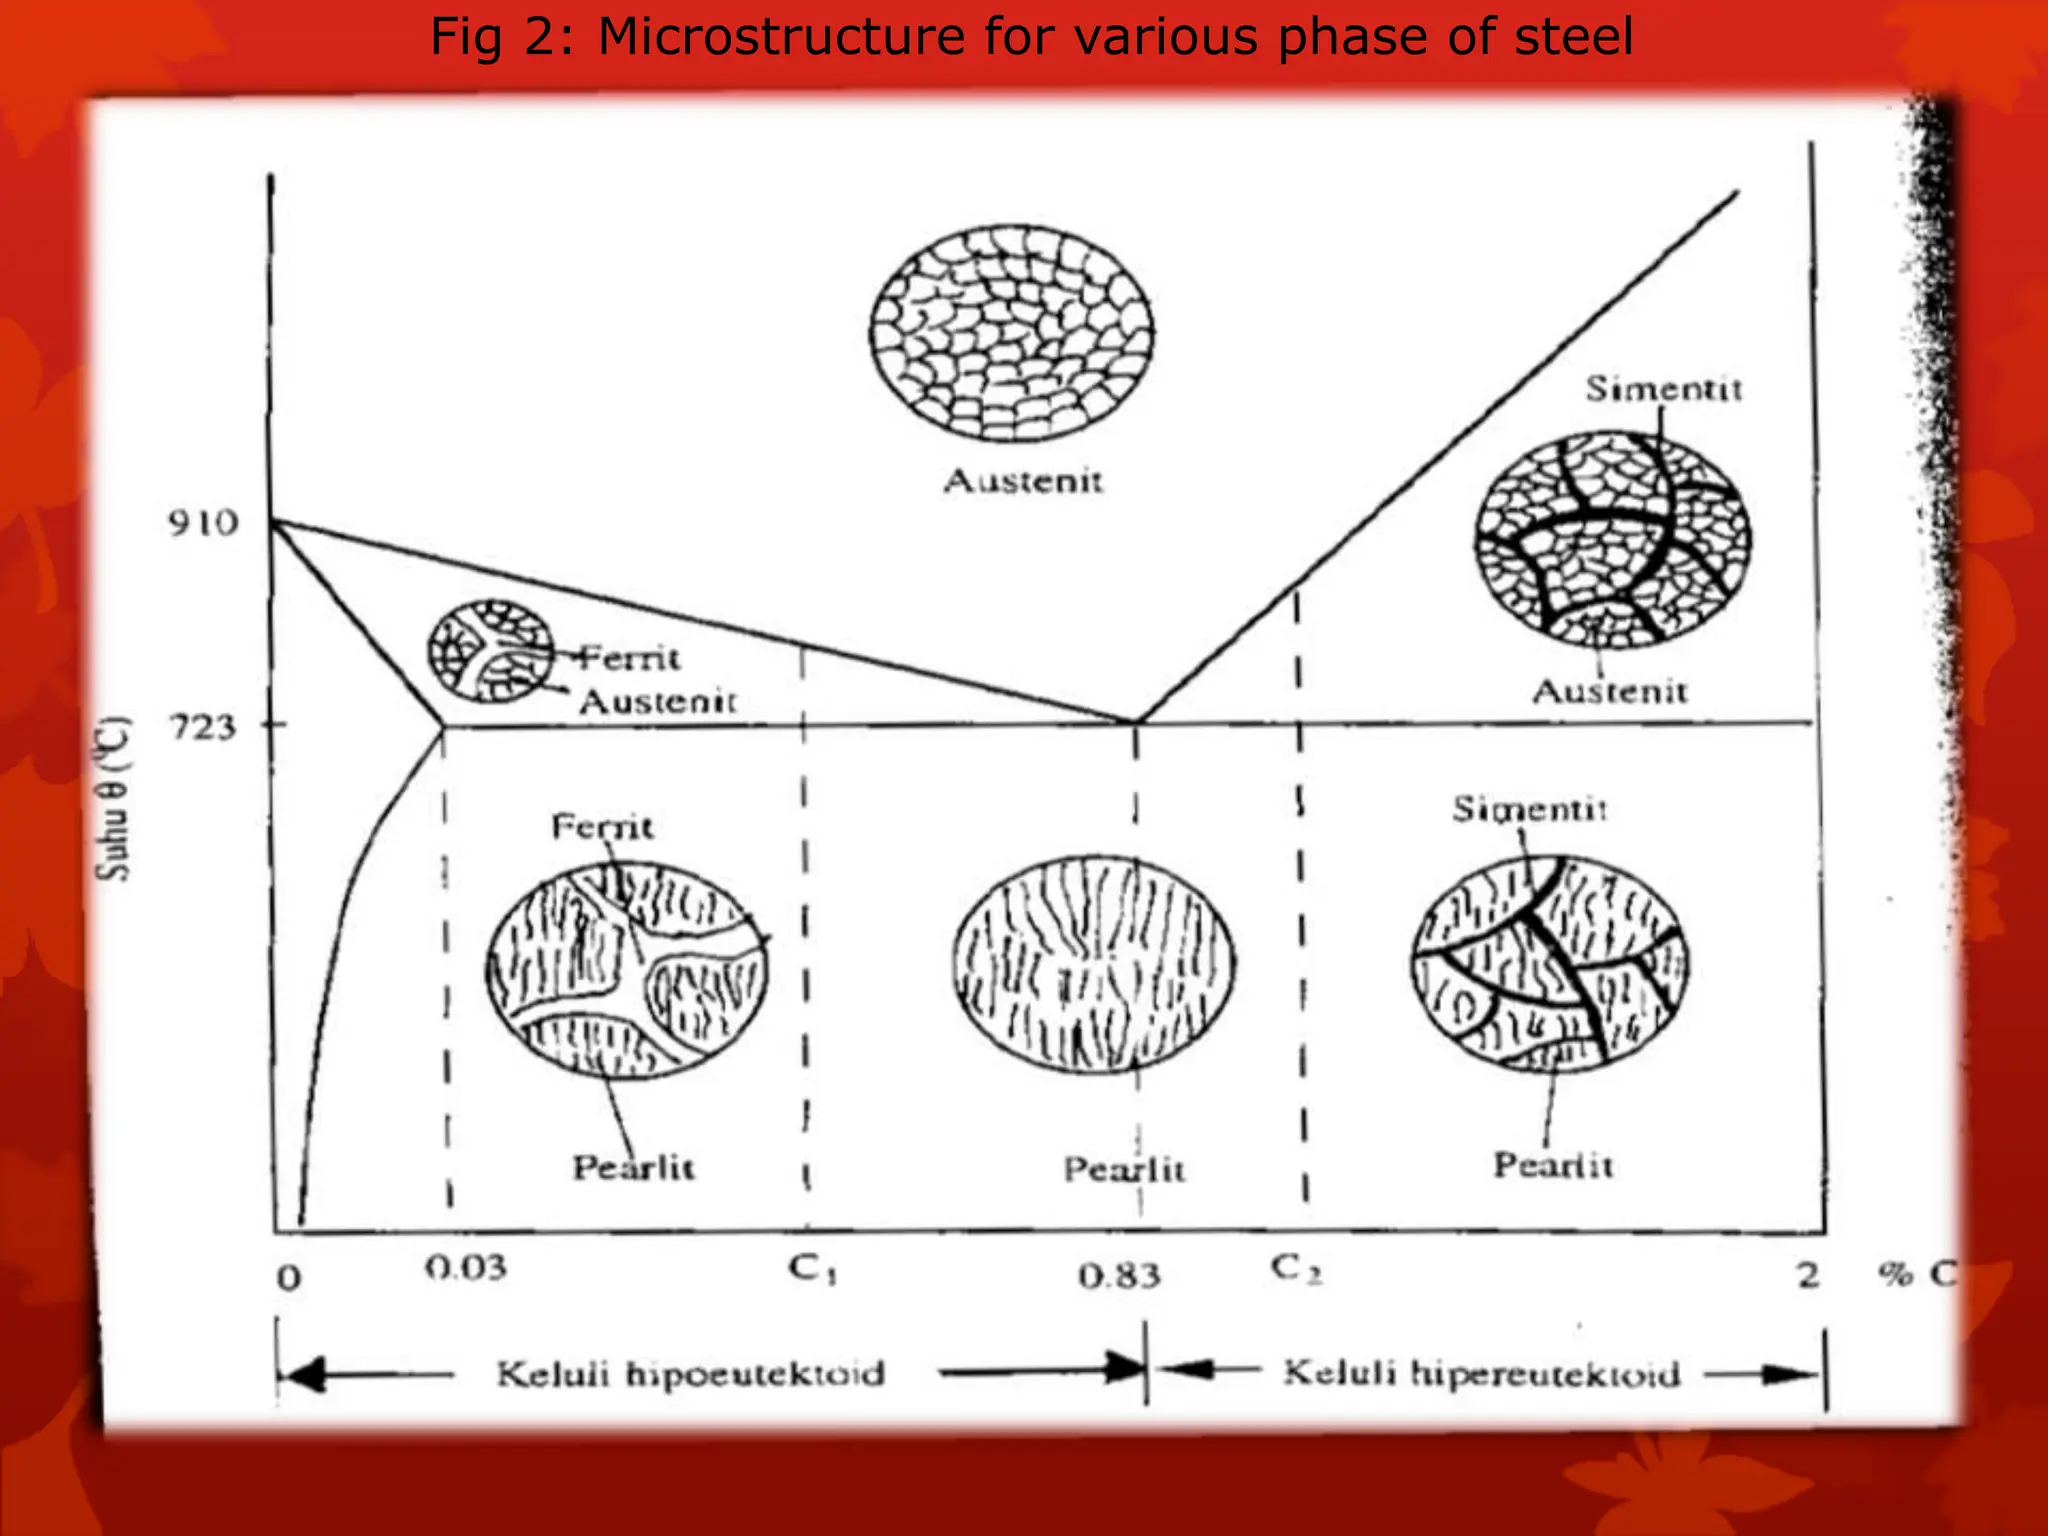
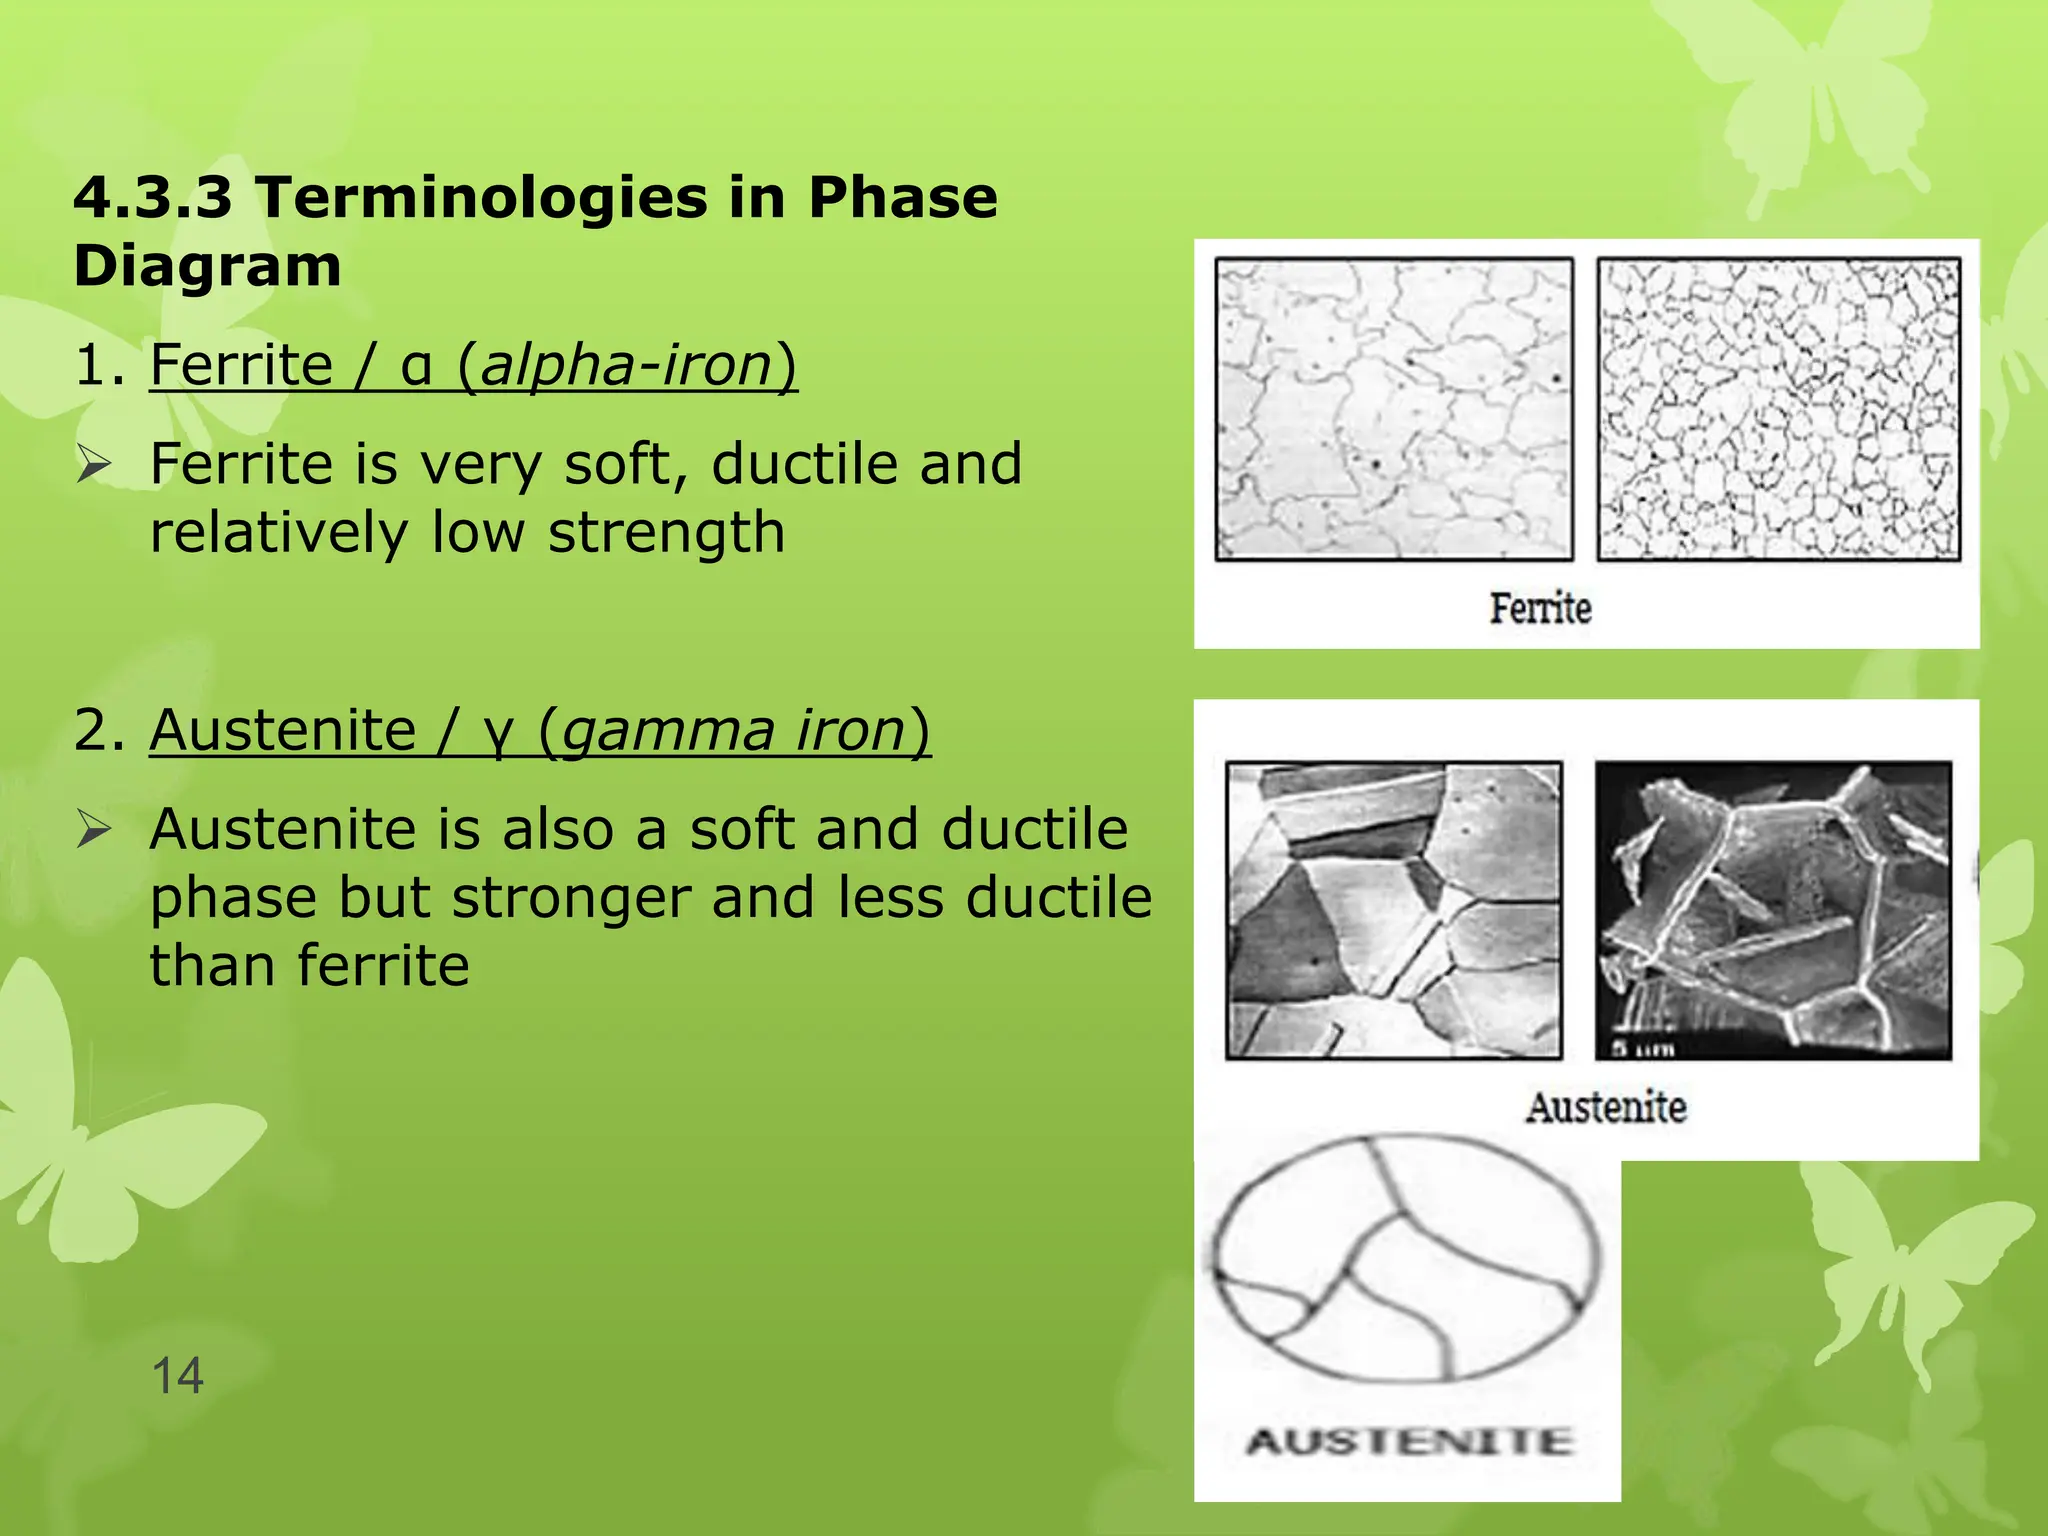
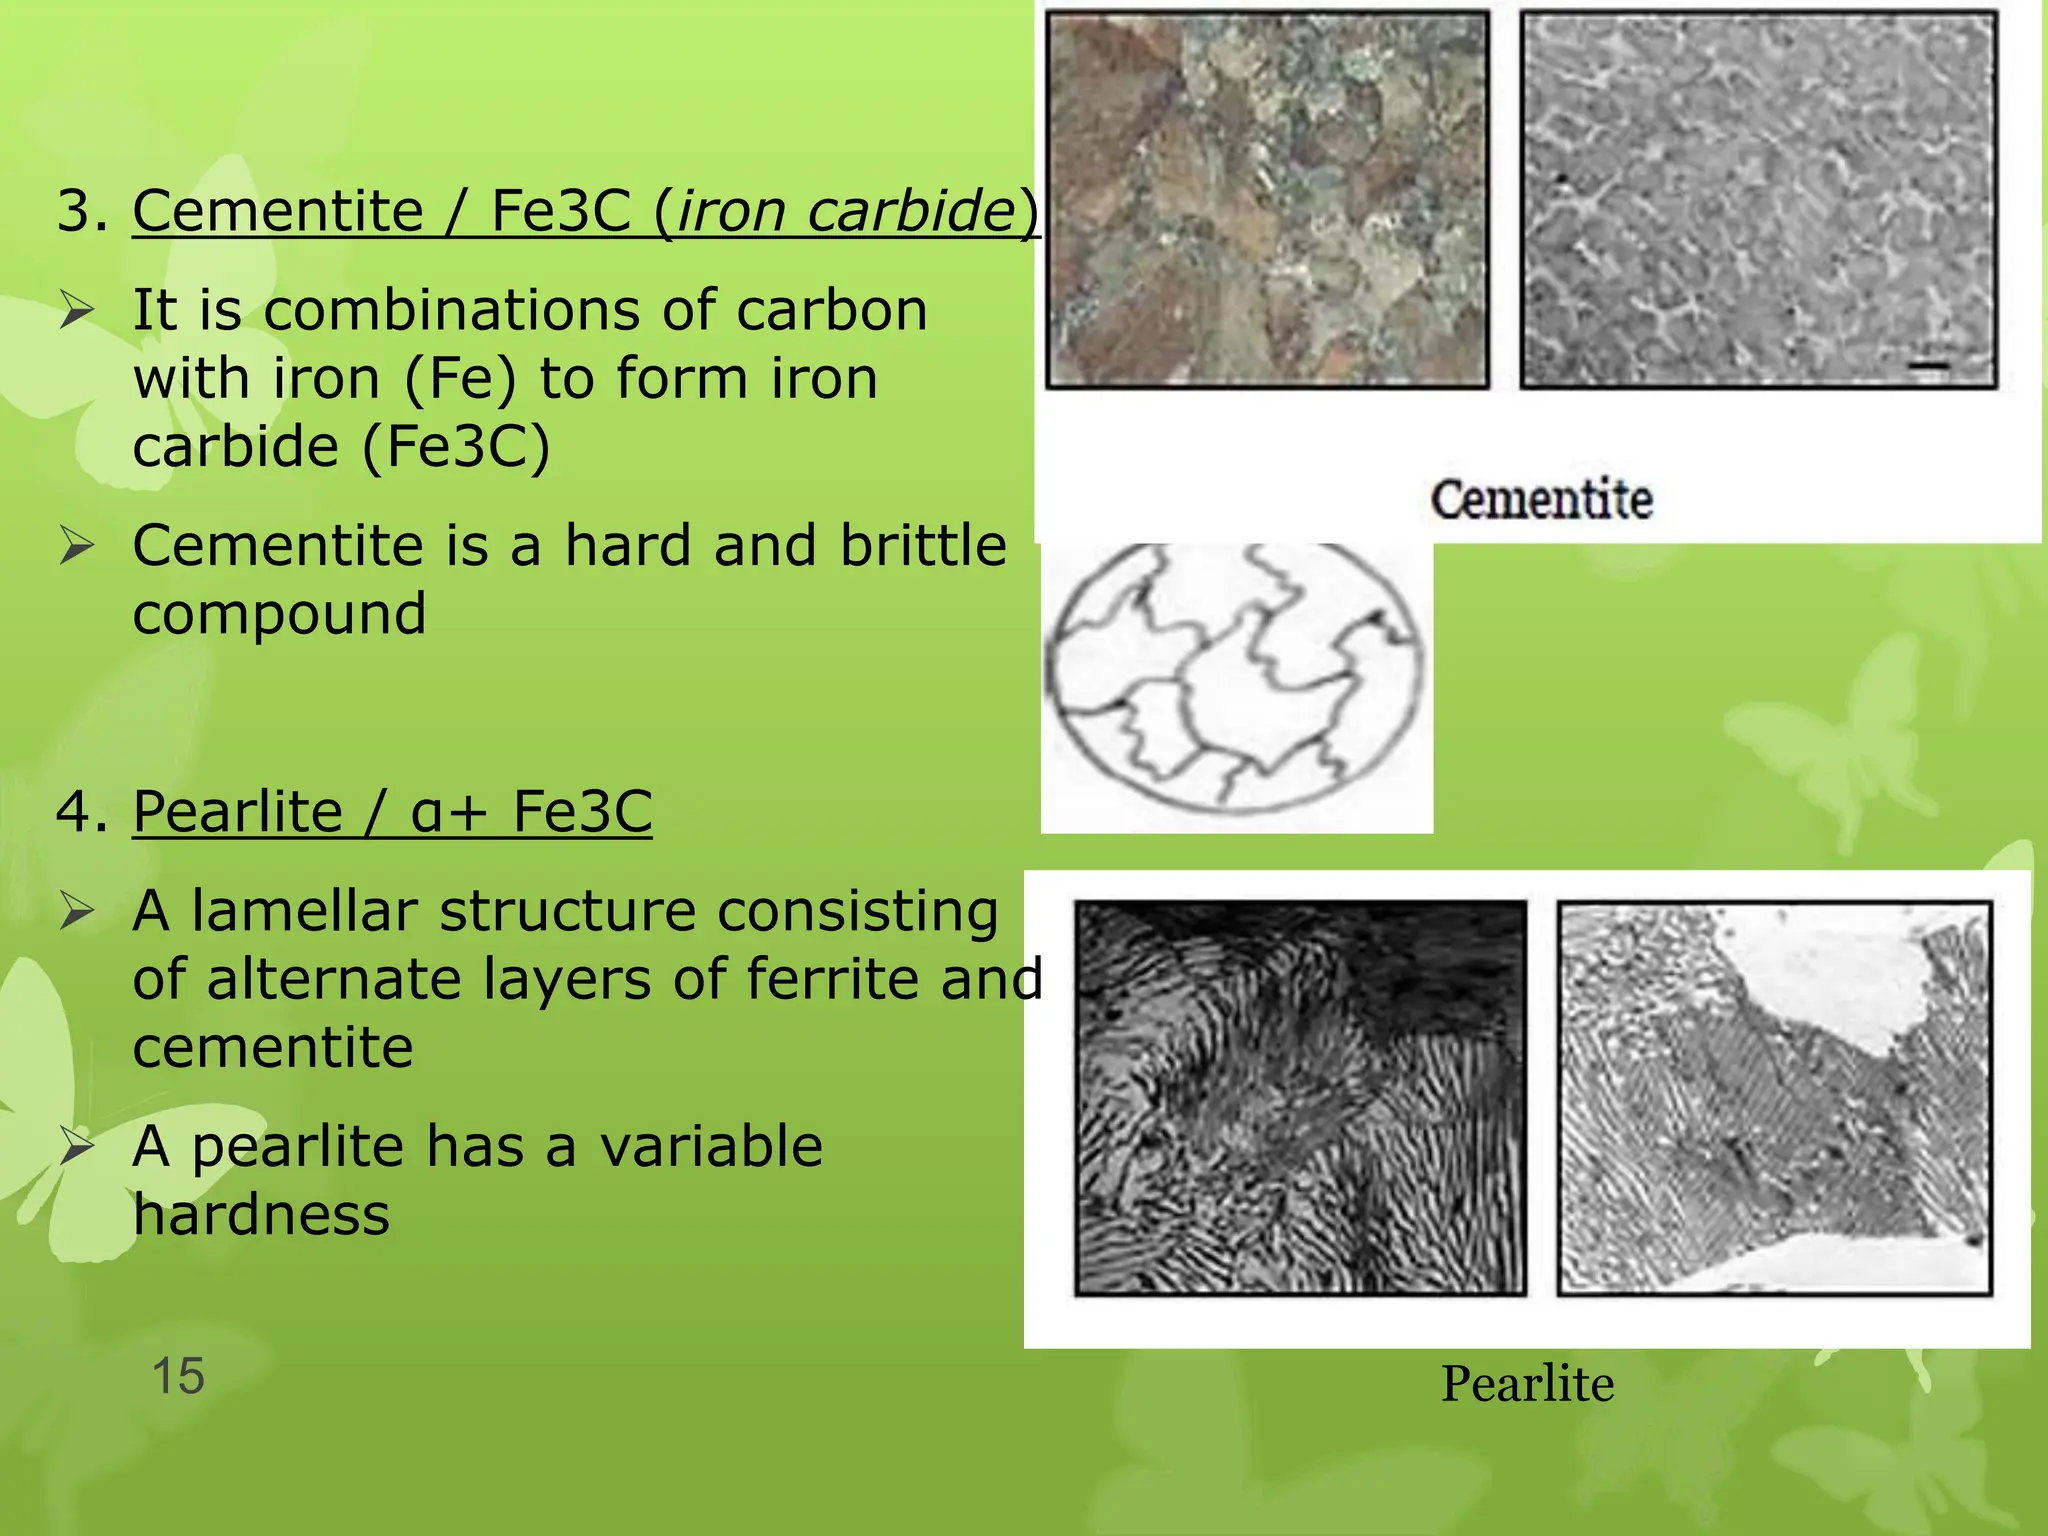
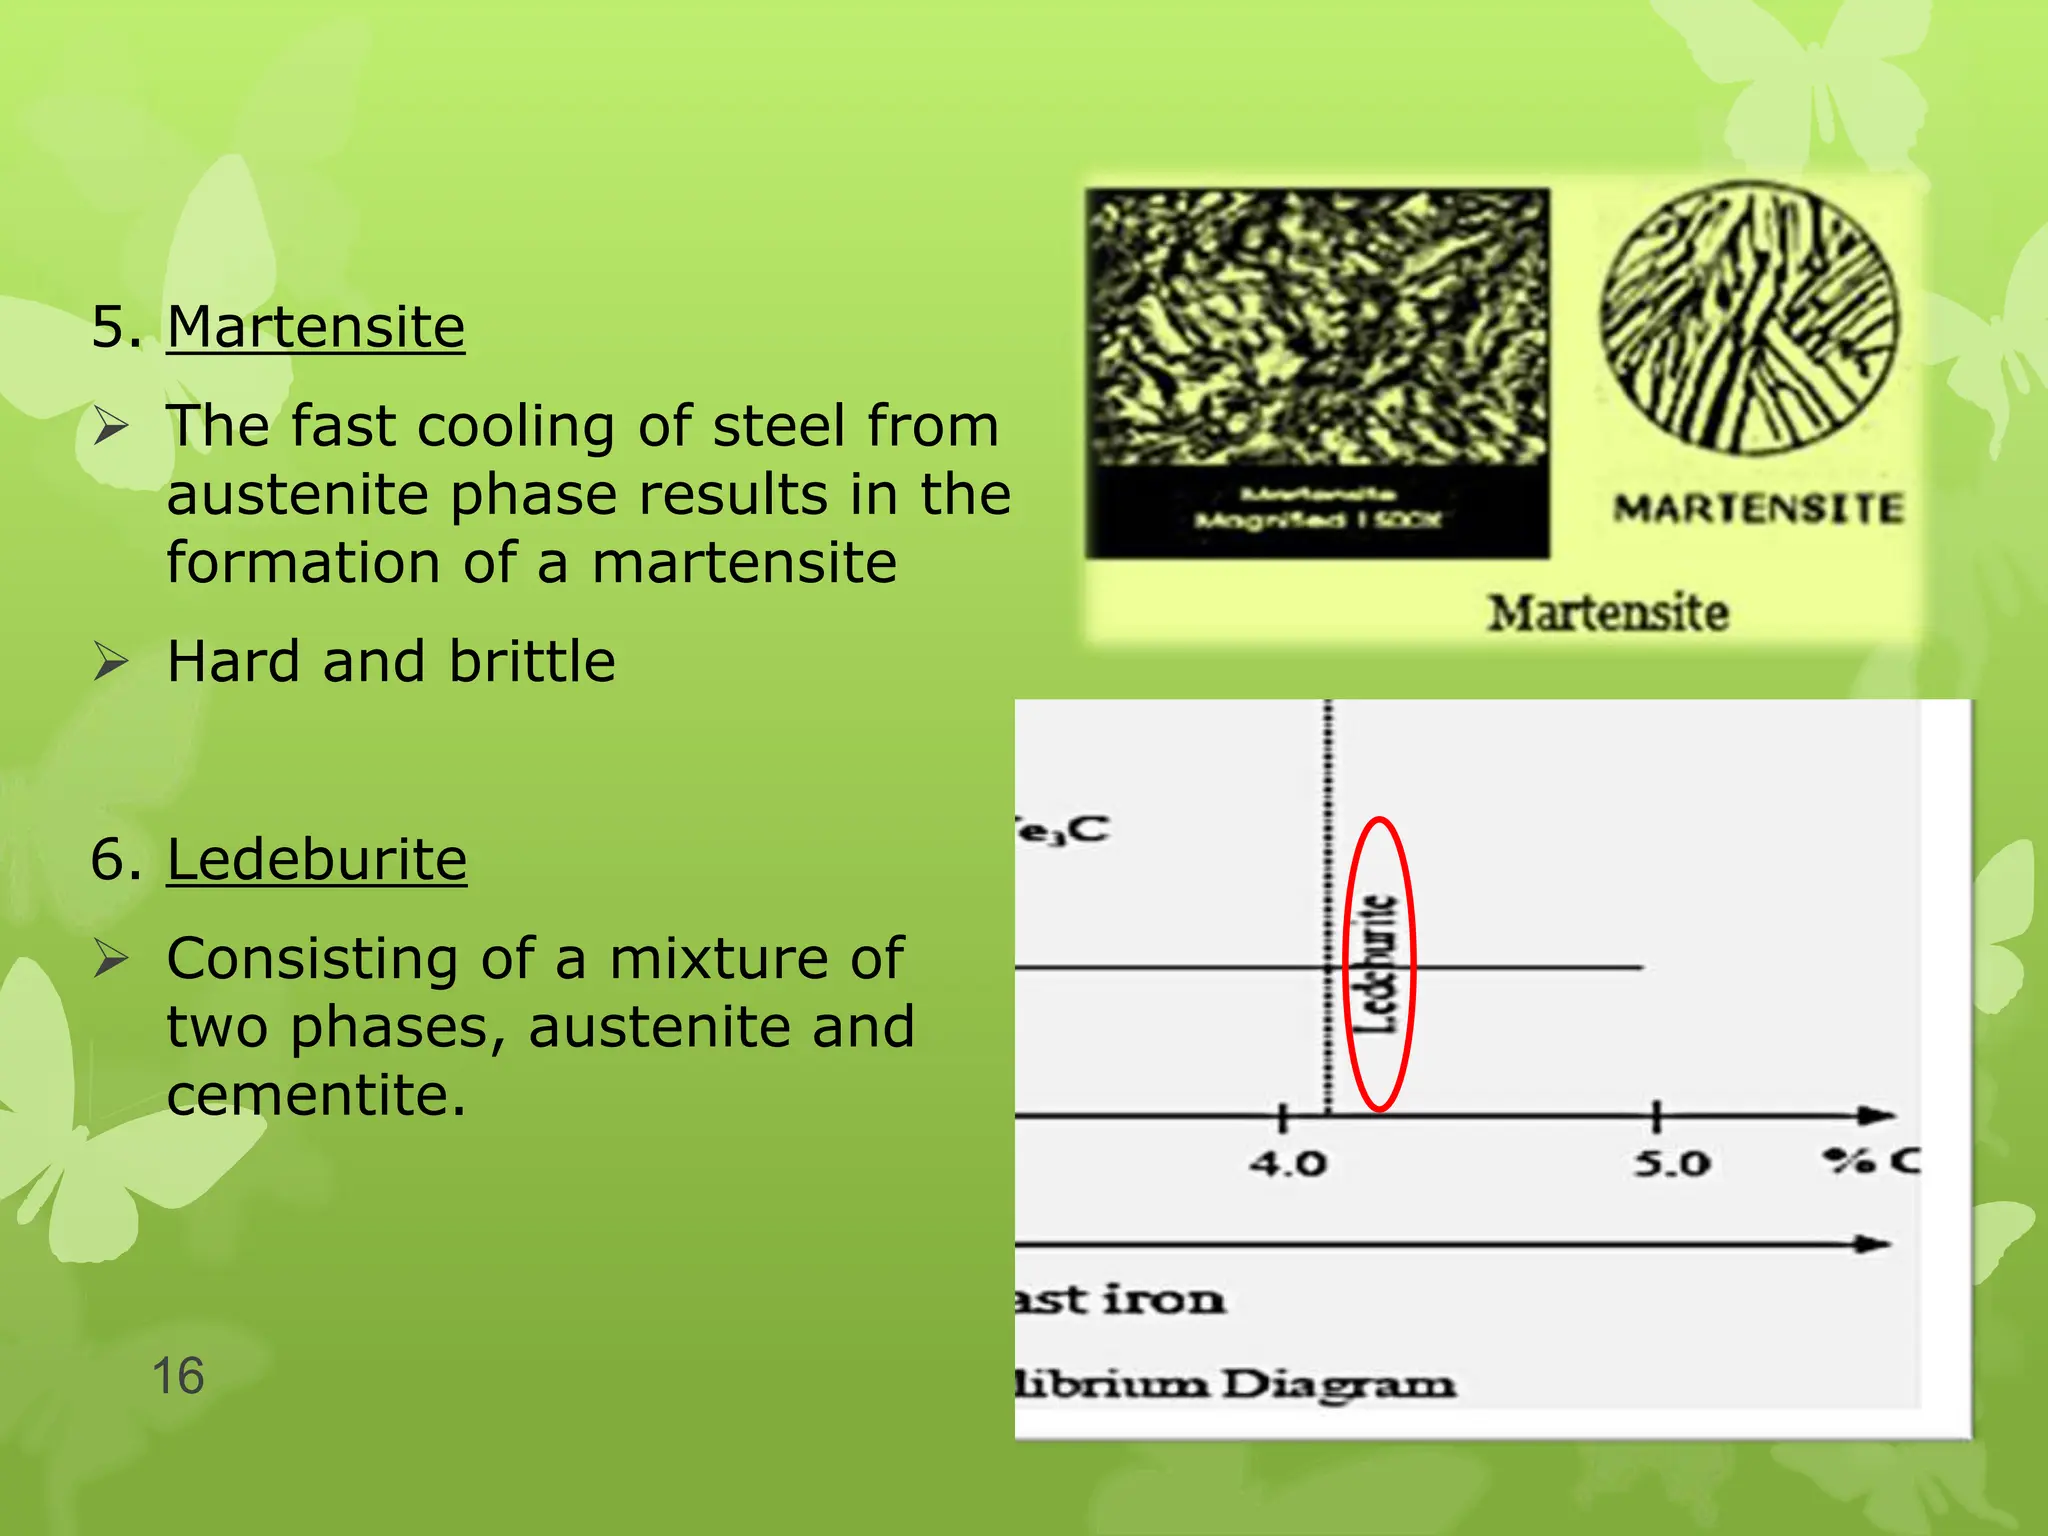
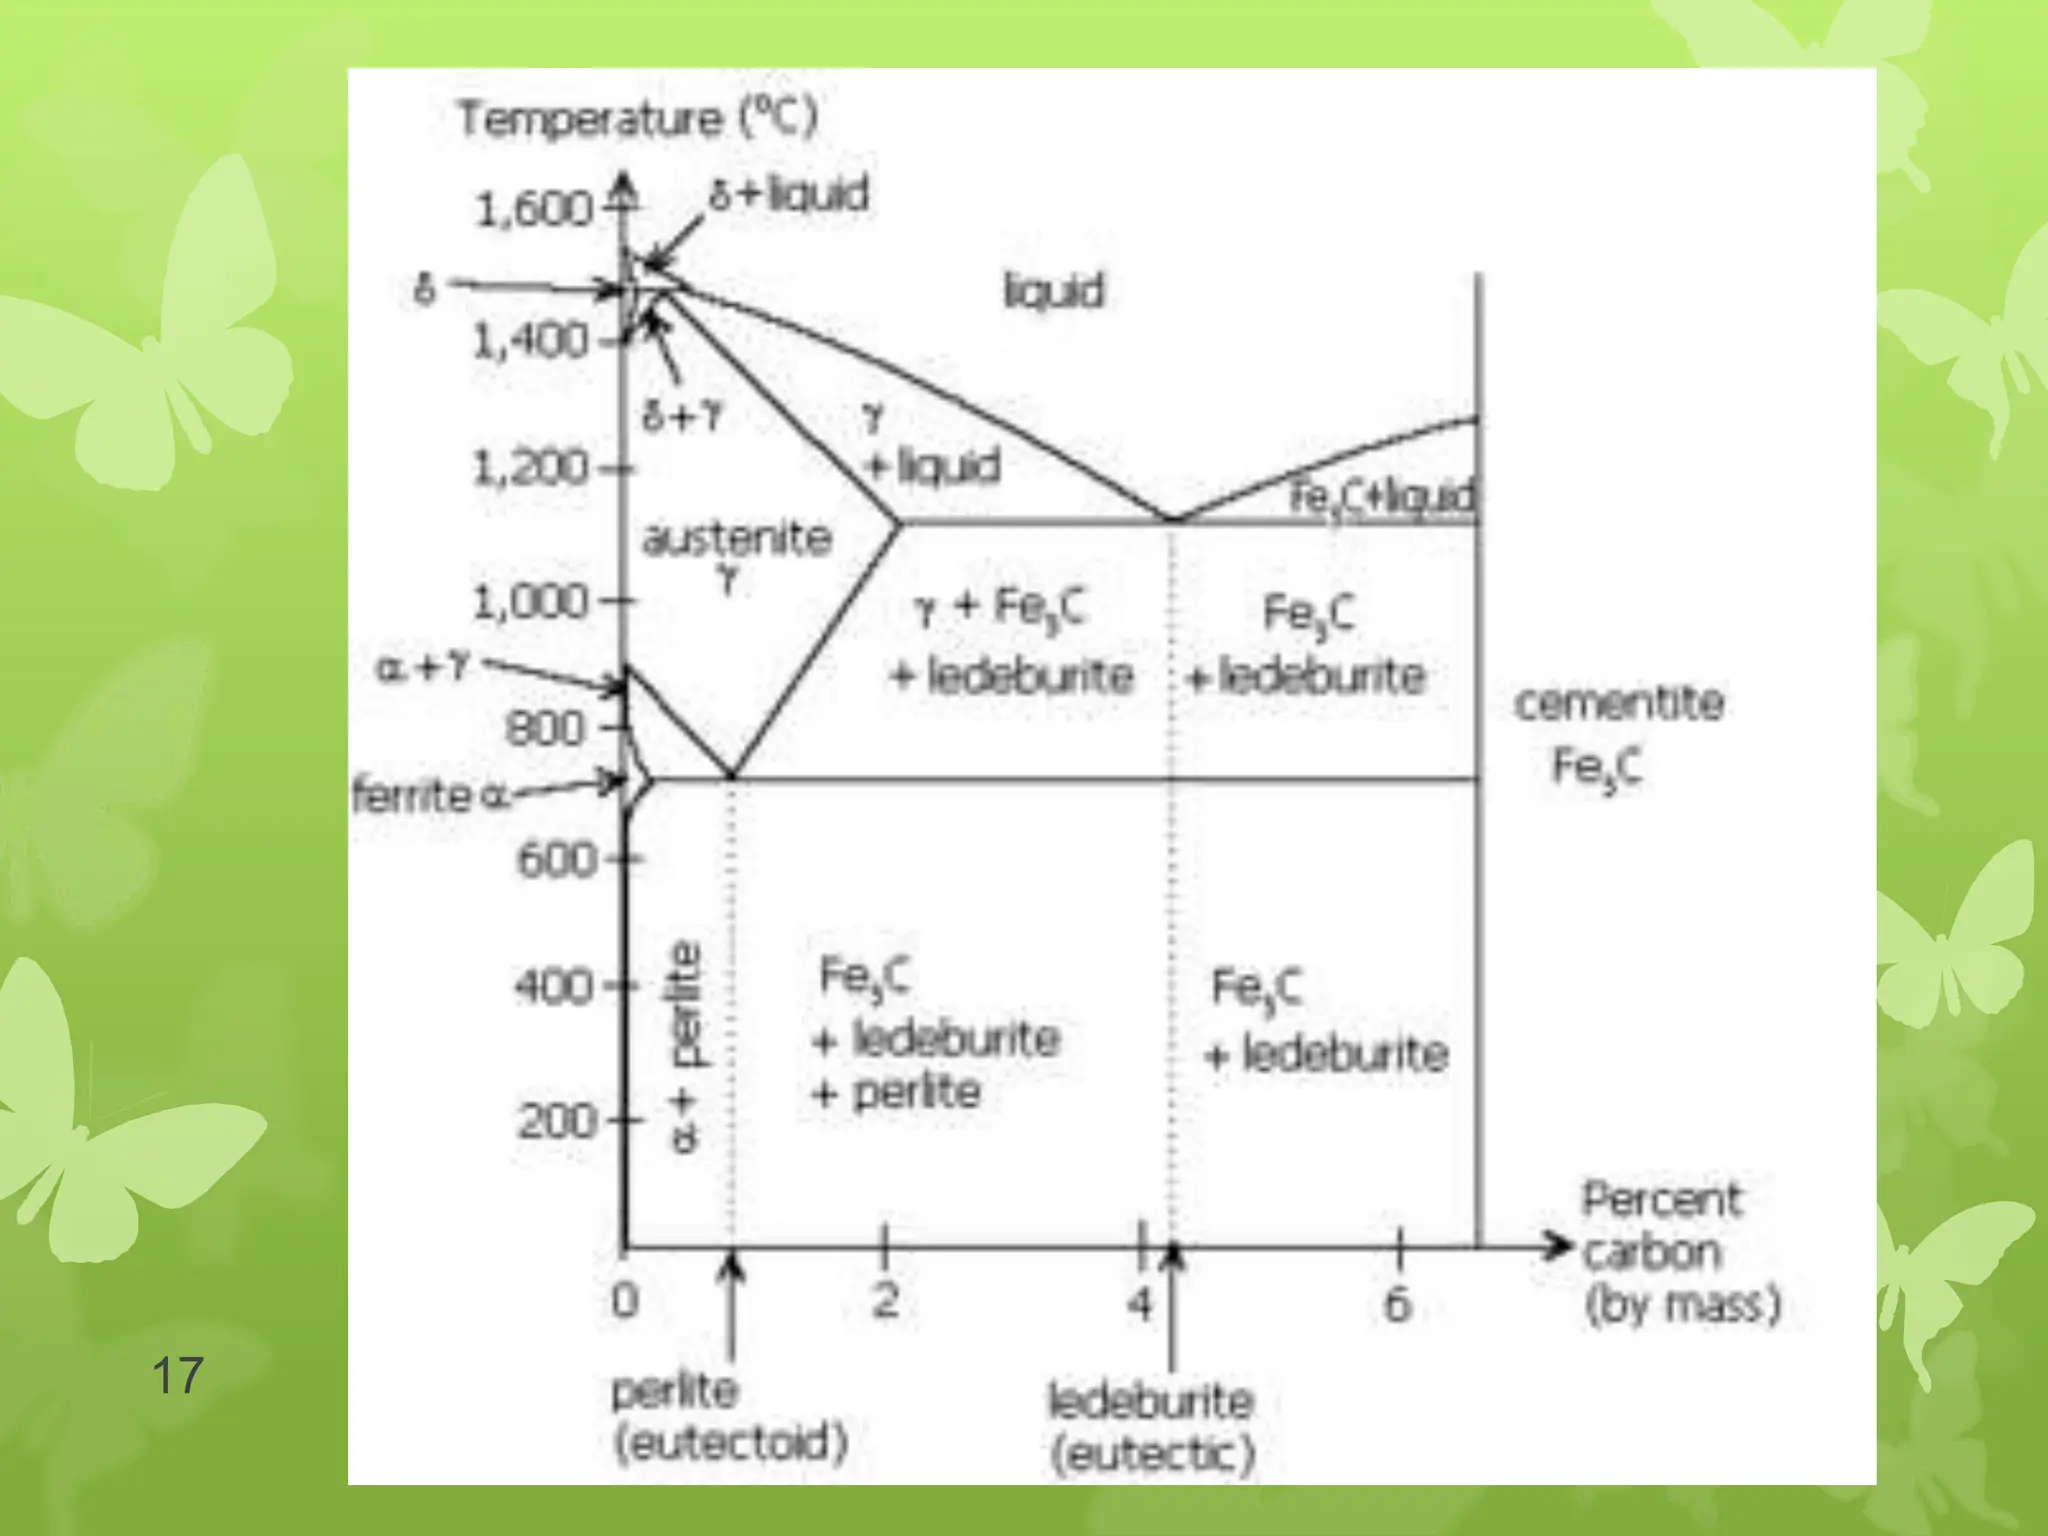
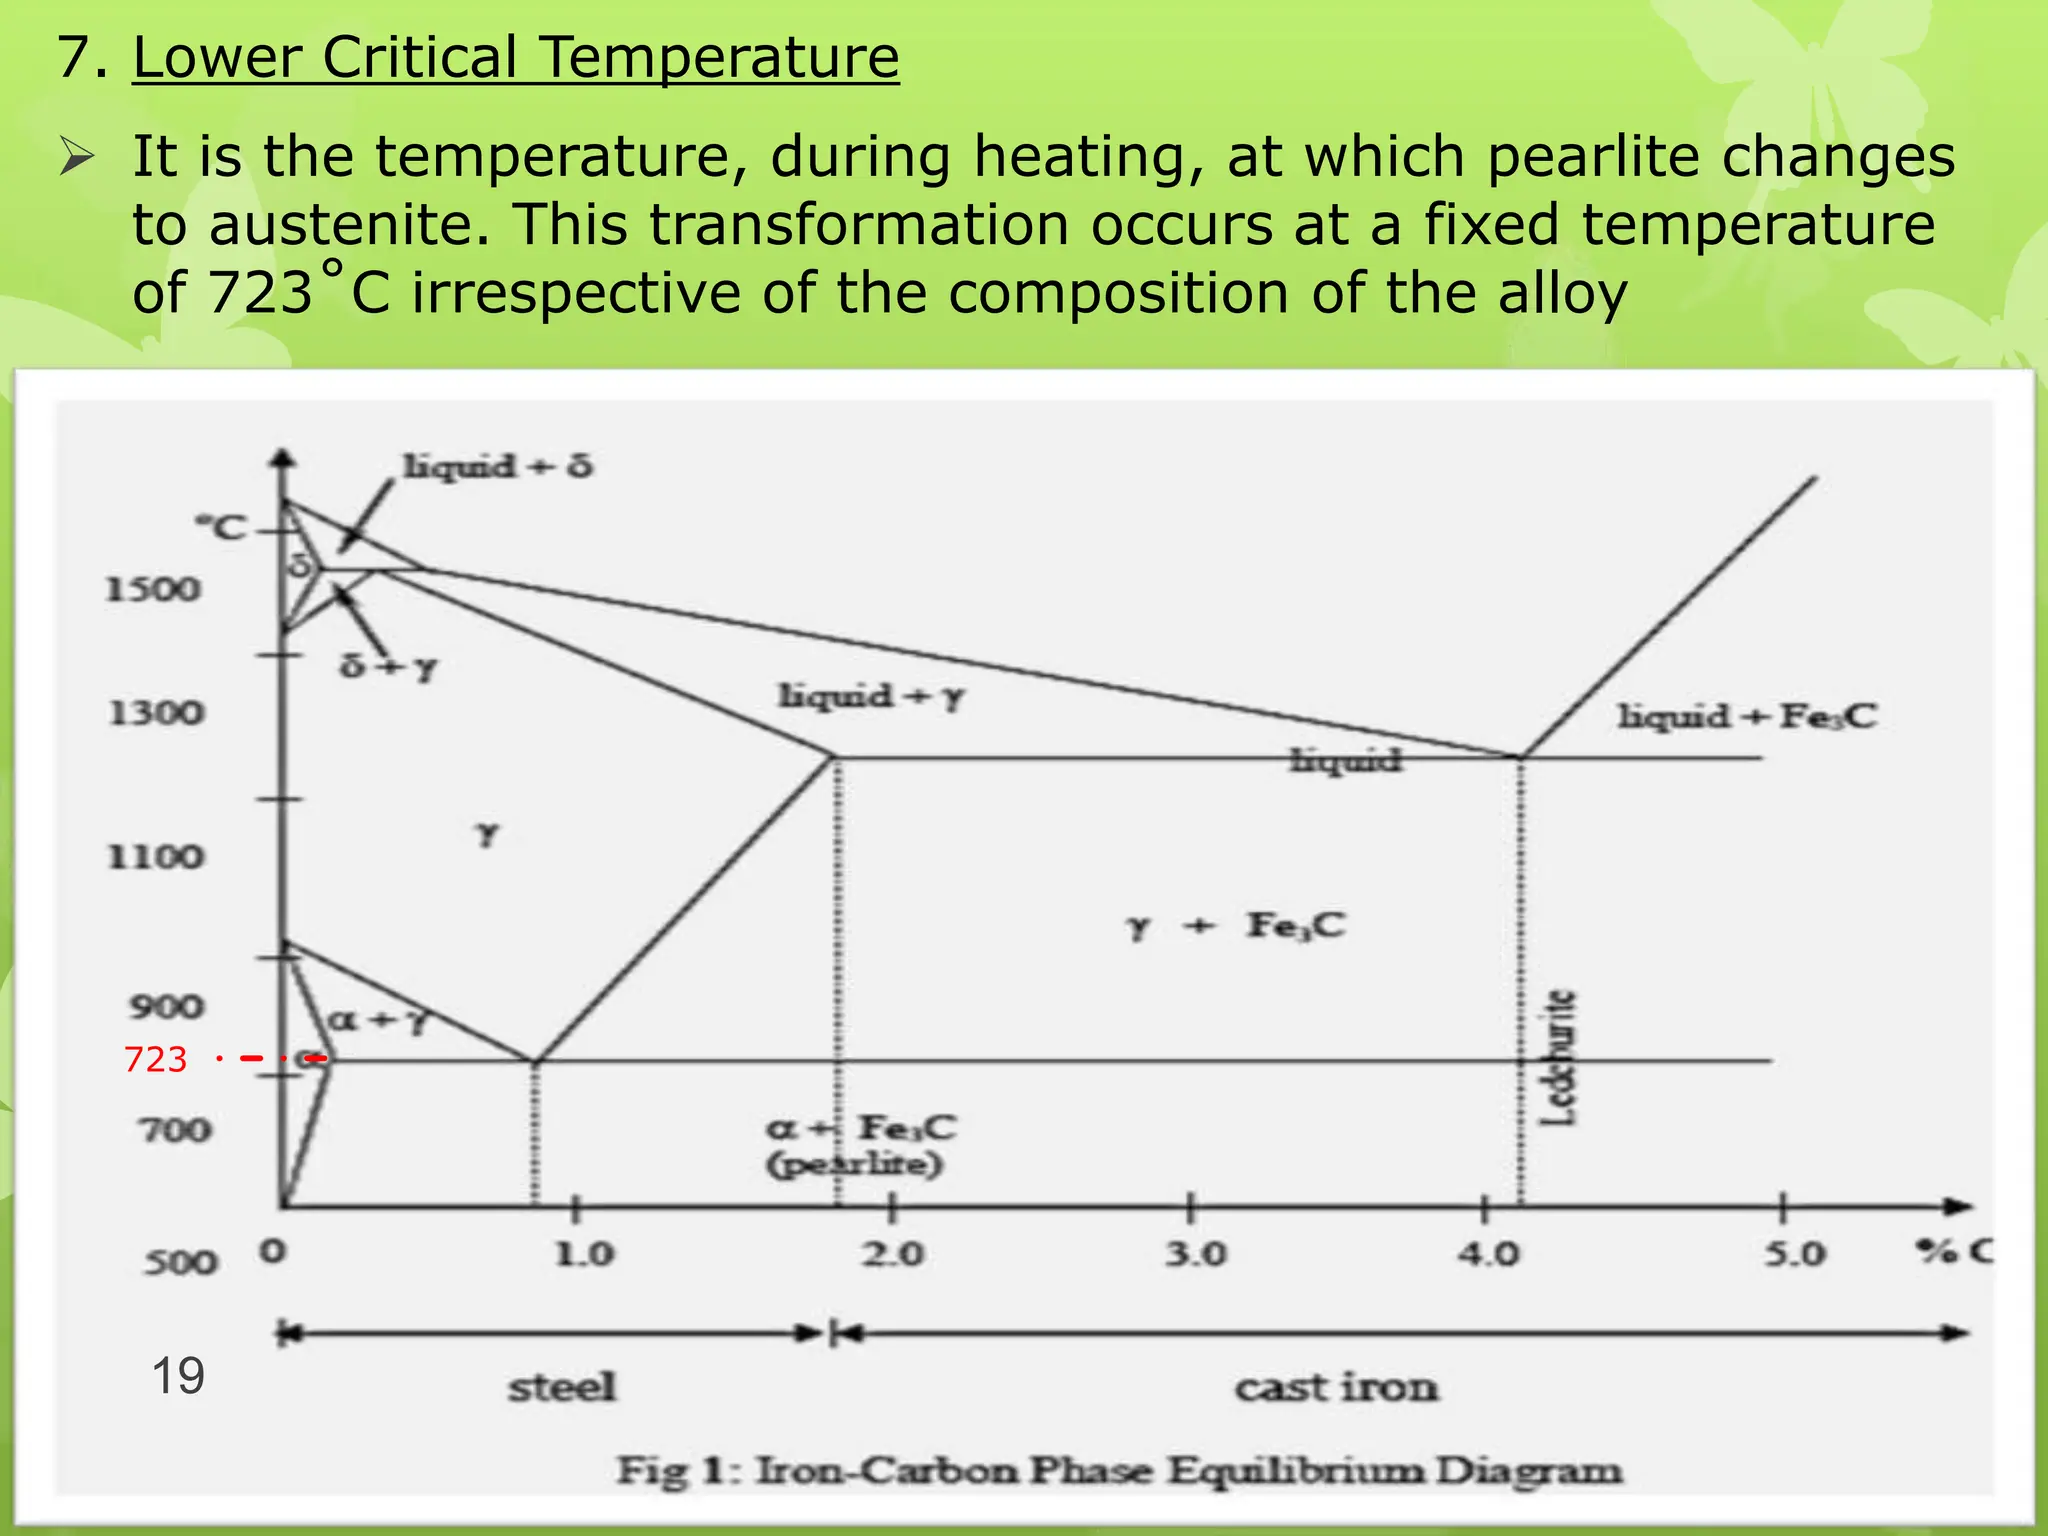
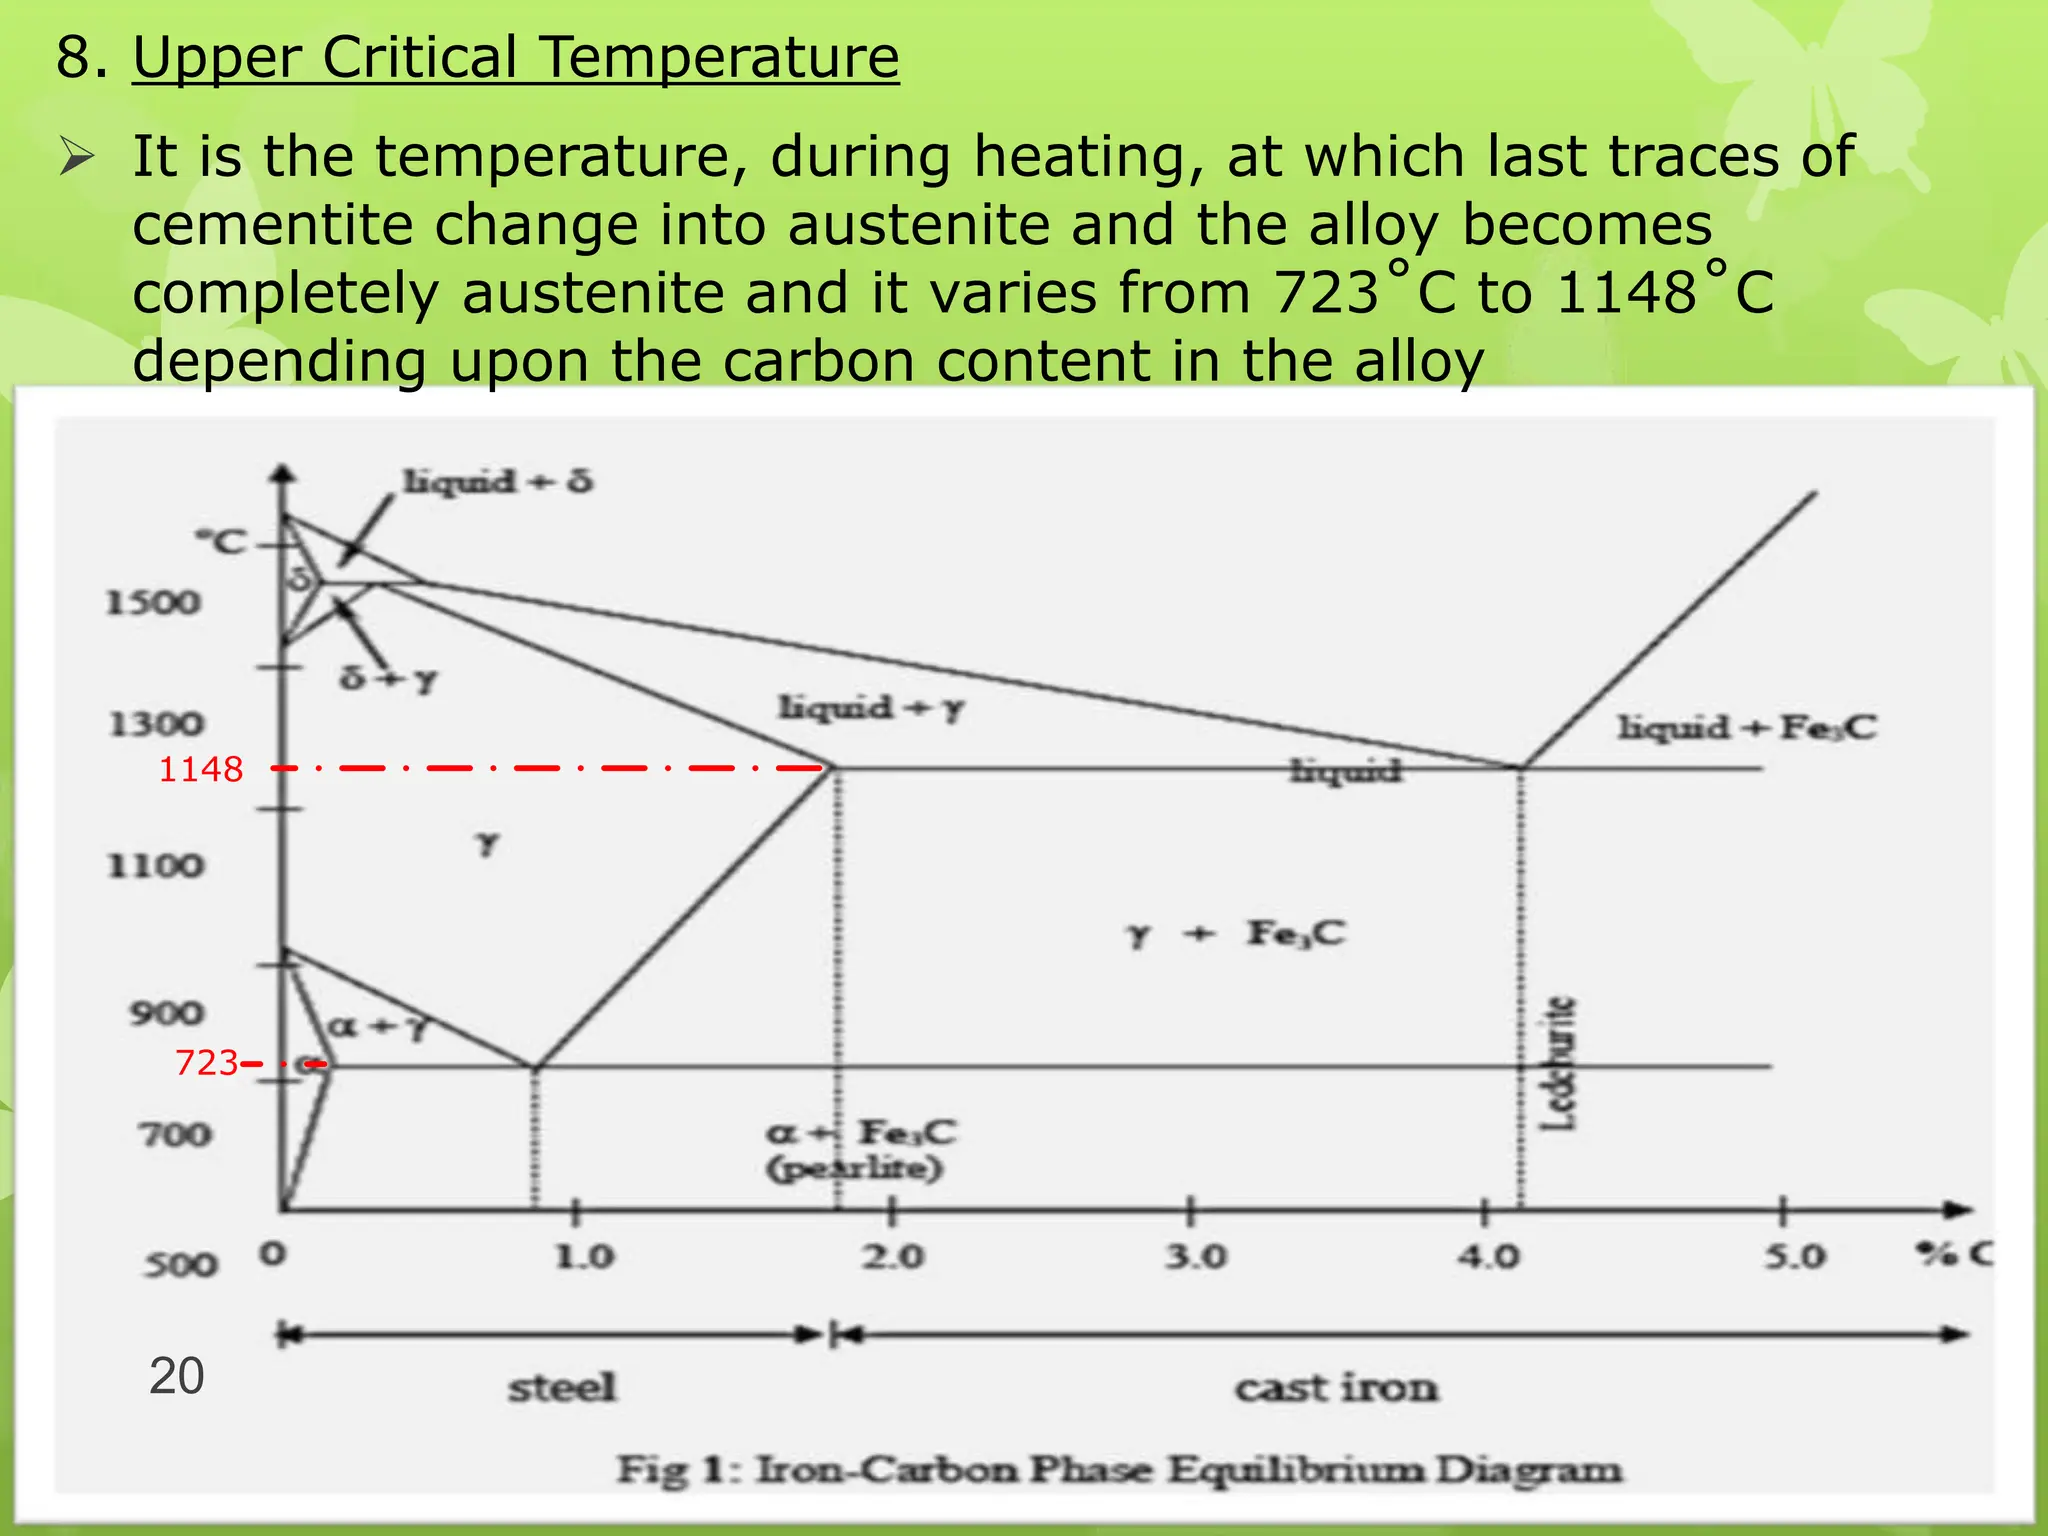
1. DJJ3213 – MATERIAL SCIENCE
CHAPTER 4
4.0 SOLID SOLUTION AND
EQUILIBRIUM PHASE DIAGRAM
2. 4.1 The Stages Of Grain Structures
Formation
1. Solidification process occurs along with the grain formation.
2. Nucleus tips freely find their own way to colder place causing
the nucleus to grow and expanding.
3. The expand will form the secondary dendrite arm with 90˚ to
each other.
4. This will continue until a structure called dendrite structure
existed. Solidification process end by the existent of the grain.
The Stages Of
Grain Structures
Formation
3. 4.1.2 The Differences Between Base
Metal and Alloy
1. Base metal
metal has same elements, extreme
properties and cannot fulfill the need of
the engineering work.
characteristics :
(i) malleable – can be shape to many form
(ii) ductile – can be form to fine wire
2. Alloy
a metal alloy is a combination of two or
more metals or a metal and a non-metals.
4. 4.1.3 Types Of Solid Solutions
Disordered Solid Solution
Solute and solvent atoms are randomly distributed on lattice sites
Solute atoms
Solvent atoms
5. Ordered Solid Solution
The atoms (solute and solvent) take up preferred positions and
the solution becomes ordered
Solute atoms
Solvent atoms
6. Interstitial Solid Solution
Atoms of small atomic radius fit into the empty spaces or
interstices of the lattice structure of the solvent atoms
Solute atoms
Solvent atoms
7. Intermetallic Compounds (Alloys)
made up of 2 or more elements producing a new
phase with its own composition, crystal structure
and properties
Intermetallic compound (valence compound) is a
phase, having chemical composition equal to a fixed
simple ratio, like CuZn,Cu3Sn, Mg2Pb, etc.
Sometimes intermetallic compounds exist over a
range of composition, differing from the valence law.
Intermetallic compounds of this sort are
called electron compounds or intermediate solutions.
An example of a phase diagram
with intermetallic compound AB2 is shown in the
figure below.
8. 4.2 Terminologies In Phase Diagram
1. Phase
Is a region that differs in structure or composition
from another region
2. Equilibrium Phase Diagram
Are graphical representations of what phases are
present in a materials system at various
temperatures, pressures and compositions
3. Composition
Are percentage of certain materials contains
purposely or not added to another material. With this
it can cause changes in phases, the properties and the
shape of the microstructures.
4. Liquidus
The temperature at which liquid starts to solidify
under equilibrium conditions.
5. Solidus
The temperature which all liquid has completely
solidified.
9. 4.2.2 Binary Alloy System
1. Binary phase diagram is a phase diagram in
which there are only two components and a
mixture of two metals (a binary alloy).
10. 4.3 Iron-Carbon Phase Equilibrium Diagram
1. The Iron-Carbon Phase Diagram are a phase diagram that
shows the connection between amount of carbon and the
changes of internal structure by irons and steels while
heated until reaching their melting point.
2. Only ferrous metals could show the changes while it is
heated.
3. First stage/ phase called lower critical temperature and the
second stage of changes called upper critical temperature.
4. The levels of lower critical temperature for every eutectoid
steels (0.8% carbon) are the same which it is about 723°C.
5. However, the upper critical temperatures are different
depends on the amount of carbon. The higher the amount
(more than 0.8%), the higher the temperature.
11. 4.3.2 Irons, Steels and Cast Irons in the Iron-Carbon Phase
Equilibrium Diagram
1. Between the temperature of 1400˚C and 1537˚C, the solid irons
exist in body-centered cubic (BCC) and called as pearlite.
2. The temperature between 910˚C and 1400˚C, the crystalline
structures are face-centered cubic (FCC) called austenite.
3. The temperature 910˚C and below, the iron structures are
body–centered cubic (BCC) called ferrite.
4. At 1125˚C, cementite dissolvability in austenite irons is limited
at 2% carbon only.
5. Cementite solid solutions in austenite called ferrite.
6. Eutectoid composition for ferrite and cementite called pearlite
which containing a lamellar structure consisting of alternate layers
of cementite and ferrite.
7. Ferrite and cementite only transformed from austenite with slow
cooling process. But with fast cooling process, the martensite will
transformed from austenite.
14. 4.3.3 Terminologies in Phase
Diagram
1. Ferrite / α (alpha-iron)
Ferrite is very soft, ductile and
relatively low strength
2. Austenite / γ (gamma iron)
Austenite is also a soft and ductile
phase but stronger and less ductile
than ferrite
14
15. 3. Cementite / Fe3C (iron carbide)
It is combinations of carbon
with iron (Fe) to form iron
carbide (Fe3C)
Cementite is a hard and brittle
compound
4. Pearlite / α+ Fe3C
A lamellar structure consisting
of alternate layers of ferrite and
cementite
A pearlite has a variable
hardness
Pearlite
15
16. 5. Martensite
The fast cooling of steel from
austenite phase results in the
formation of a martensite
Hard and brittle
6. Ledeburite
Consisting of a mixture of
two phases, austenite and
cementite.
16
18. 7. Lower Critical Temperature
It is the temperature, during heating, at which pearlite changes
to austenite. This transformation occurs at a fixed temperature
of 723˚C irrespective of the composition of the alloy
18
723
19. 7. Lower Critical Temperature
It is the temperature, during heating, at which pearlite changes
to austenite. This transformation occurs at a fixed temperature
of 723˚C irrespective of the composition of the alloy
19
723
20. 8. Upper Critical Temperature
It is the temperature, during heating, at which last traces of
cementite change into austenite and the alloy becomes
completely austenite and it varies from 723˚C to 1148˚C
depending upon the carbon content in the alloy
20
1148
723