Downloaded 106 times


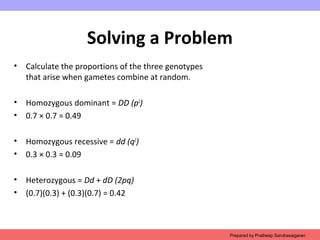
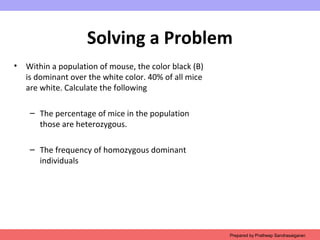

The document discusses the Hardy-Weinberg law of population genetics, which explains how allele and genotype frequencies remain constant over generations under specific conditions. It outlines the four assumptions necessary for Hardy-Weinberg equilibrium and illustrates how to calculate allele frequencies and genotypic ratios using real-world examples. Additionally, it addresses factors that can lead to deviations from this equilibrium and provides guidance on maintaining ideal population conditions.


