DEFINITION AND GOALSOF POPULATION GENETICS
Population genetics, the branch of genetics that studies the genetic makeup of groups of
individuals and how a group’s genetic composition changes over time
Population genetics applies the principles of transmission genetics to large groups of
individuals, focusing on the transmission processes at one or a few genetic loci.
Population geneticists investigate the patterns of genetic variation found among
individuals within groups (the genetic structure of populations) and how these patterns
vary geographically and change over time.
5.
MENDELIAN POPULATION, GENEPOOL, AND
GENETIC STRUCTURE
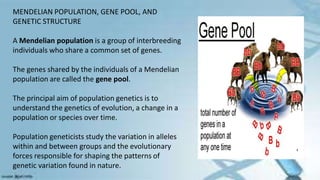
A Mendelian population is a group of interbreeding
individuals who share a common set of genes.
The genes shared by the individuals of a Mendelian
population are called the gene pool.
The principal aim of population genetics is to
understand the genetics of evolution, a change in a
population or species over time.
Population geneticists study the variation in alleles
within and between groups and the evolutionary
forces responsible for shaping the patterns of
genetic variation found in nature.
6.
GENETIC STRUCTURE OFPOPULATION
Genes in a population (gene pool) may be MONOMORPHIC OR POLYMORPHIC
Monomorphism refers to a population where only one allele exists at a
particular locus or where all individuals have the same phenotype for a certain
trait.
Lack of variation in DNA sequence; all individuals are homozygous for the
same allele at a particular locus.
Monomorphism can limit the ability of a population to adapt to changing
environments because there is no genetic or phenotypic variation upon which
natural selection can act
7.
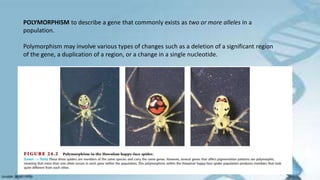
POLYMORPHISM to describea gene that commonly exists as two or more alleles in a
population.
Polymorphism may involve various types of changes such as a deletion of a significant region
of the gene, a duplication of a region, or a change in a single nucleotide.
8.
The usual wayof describing the population structure is to enumerate the
types and frequencies of genotypes and alleles in a population
To study the genetic structure of a Mendelian population, population
geneticists must first describe it quantitatively. They do this by calculating
genotype frequencies and allele frequencies within the population.
Genotypic and Allelic Frequencies Are Used to Describe the Gene Pool of
a Population
9.
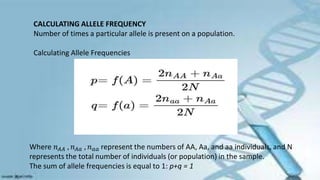
CALCULATING ALLELE FREQUENCY
Numberof times a particular allele is present on a population.
Calculating Allele Frequencies
Where 𝑛𝐴𝐴 , 𝑛𝐴𝑎 , 𝑛𝑎𝑎 represent the numbers of AA, Aa, and aa individuals, and N
represents the total number of individuals (or population) in the sample.
The sum of allele frequencies is equal to 1: p+q = 1
10.
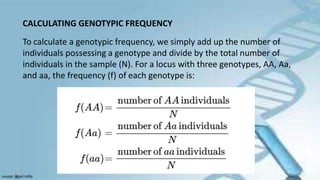
CALCULATING GENOTYPIC FREQUENCY
Tocalculate a genotypic frequency, we simply add up the number of
individuals possessing a genotype and divide by the total number of
individuals in the sample (N). For a locus with three genotypes, AA, Aa,
and aa, the frequency (f) of each genotype is:
11.
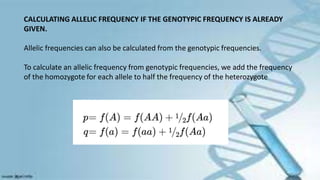
CALCULATING ALLELIC FREQUENCYIF THE GENOTYPIC FREQUENCY IS ALREADY
GIVEN.
Allelic frequencies can also be calculated from the genotypic frequencies.
To calculate an allelic frequency from genotypic frequencies, we add the frequency
of the homozygote for each allele to half the frequency of the heterozygote
12.
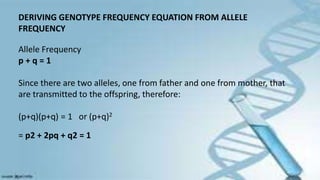
DERIVING GENOTYPE FREQUENCYEQUATION FROM ALLELE
FREQUENCY
Allele Frequency
p + q = 1
Since there are two alleles, one from father and one from mother, that
are transmitted to the offspring, therefore:
(p+q)(p+q) = 1 or (p+q)2
= p2 + 2pq + q2 = 1
13.
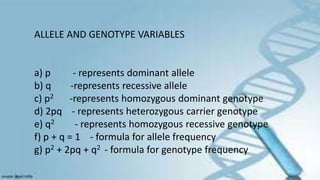
ALLELE AND GENOTYPEVARIABLES
a) p - represents dominant allele
b) q -represents recessive allele
c) p2 -represents homozygous dominant genotype
d) 2pq - represents heterozygous carrier genotype
e) q2 - represents homozygous recessive genotype
f) p + q = 1 - formula for allele frequency
g) p2 + 2pq + q2 - formula for genotype frequency
14.
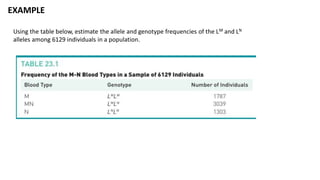
EXAMPLE
Using the tablebelow, estimate the allele and genotype frequencies of the LM and LN
alleles among 6129 individuals in a population.
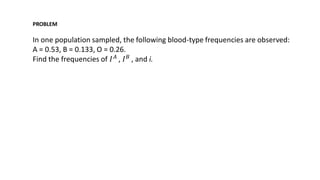
PROBLEM
In one populationsampled, the following blood-type frequencies are observed:
A = 0.53, B = 0.133, O = 0.26.
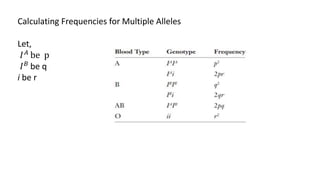
Find the frequencies of 𝐼𝐴
, 𝐼𝐵
, and i.
17.
HARDY-WEINBERG PRINCIPLE
The Hardy–Weinbergprinciple was formulated independently by G. H. Hardy and
Wilhelm Weinberg in 1908.
The principle is a mathematical model that evaluates the effect of reproduction on the
genotypic and allelic frequencies of a population.
It describes what happens to allele and genotype frequencies in an “ideal” population
that is infinitely large and randomly mating, and that is not subject to any evolutionary
forces such as mutation, migration, or selection.
18.
The theoretical populationdescribed by the Hardy–Weinberg model is
based on the following assumptions:
1. Individuals of all genotypes have equal rates of survival and equal
reproductive success—that is, there is no selection.
2. No new alleles are created or converted from one allele into another by
mutation.
3. Individuals do not migrate into or out of the population.
4. The population is infinitely large, which in practical terms means that the
population is large enough that sampling errors and other random
effects are negligible.
5. Individuals in the population mate randomly
19.
Assumptions: If apopulation is large, randomly mating, and not affected by mutation,
migration, or natural selection, then
Prediction 1: the allelic frequencies of a population do not change; and
Prediction 2: the genotypic frequencies stabilize (will not change) after one generation
The Hardy–Weinberg law indicates that, when its assumptions are met, reproduction
alone does not alter allelic or genotypic frequencies, and the allelic frequencies
determine the frequencies of genotypes.
This condition is known as Hardy-Weinberg equilibrium.
20.
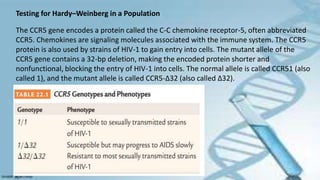
Testing for Hardy–Weinbergin a Population
The CCR5 gene encodes a protein called the C-C chemokine receptor-5, often abbreviated
CCR5. Chemokines are signaling molecules associated with the immune system. The CCR5
protein is also used by strains of HIV-1 to gain entry into cells. The mutant allele of the
CCR5 gene contains a 32-bp deletion, making the encoded protein shorter and
nonfunctional, blocking the entry of HIV-1 into cells. The normal allele is called CCR51 (also
called 1), and the mutant allele is called CCR5-∆32 (also called ∆32).
21.
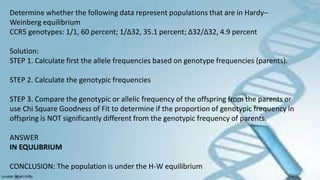
Determine whether thefollowing data represent populations that are in Hardy–
Weinberg equilibrium
CCR5 genotypes: 1/1, 60 percent; 1/∆32, 35.1 percent; ∆32/∆32, 4.9 percent
Solution:
STEP 1. Calculate first the allele frequencies based on genotype frequencies (parents).
STEP 2. Calculate the genotypic frequencies
STEP 3. Compare the genotypic or allelic frequency of the offspring from the parents or
use Chi Square Goodness of Fit to determine if the proportion of genotypic frequency in
offspring is NOT significantly different from the genotypic frequency of parents.
ANSWER
IN EQULIBRIUM
CONCLUSION: The population is under the H-W equilibrium
22.
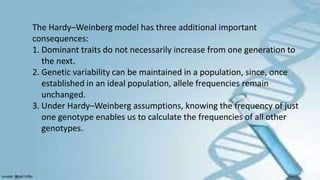
The Hardy–Weinberg modelhas three additional important
consequences:
1. Dominant traits do not necessarily increase from one generation to
the next.
2. Genetic variability can be maintained in a population, since, once
established in an ideal population, allele frequencies remain
unchanged.
3. Under Hardy–Weinberg assumptions, knowing the frequency of just
one genotype enables us to calculate the frequencies of all other
genotypes.
23.
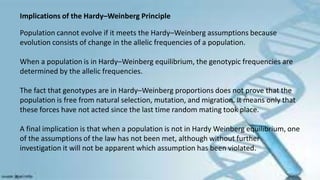
Implications of theHardy–Weinberg Principle
Population cannot evolve if it meets the Hardy–Weinberg assumptions because
evolution consists of change in the allelic frequencies of a population.
When a population is in Hardy–Weinberg equilibrium, the genotypic frequencies are
determined by the allelic frequencies.
The fact that genotypes are in Hardy–Weinberg proportions does not prove that the
population is free from natural selection, mutation, and migration. It means only that
these forces have not acted since the last time random mating took place.
A final implication is that when a population is not in Hardy Weinberg equilibrium, one
of the assumptions of the law has not been met, although without further
investigation it will not be apparent which assumption has been violated.
24.
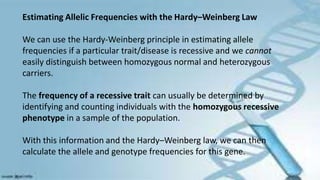
Estimating Allelic Frequencieswith the Hardy–Weinberg Law
We can use the Hardy-Weinberg principle in estimating allele
frequencies if a particular trait/disease is recessive and we cannot
easily distinguish between homozygous normal and heterozygous
carriers.
The frequency of a recessive trait can usually be determined by
identifying and counting individuals with the homozygous recessive
phenotype in a sample of the population.
With this information and the Hardy–Weinberg law, we can then
calculate the allele and genotype frequencies for this gene.
25.
Example:
Cystic fibrosis isa life-threatening autosomal recessive disorder characterized by frequent
and severe respiratory infections, incomplete digestion, and abnormal sweating. Among
North American Caucasians, the incidence of the disease is approximately 1 person in
2000. a. ) Find the frequency of this mutant allele, b) the frequency of normal allele, c.)
the heterozygotes in the population.
Answer:
a. 0.02
b. 0.98
c. 0.04
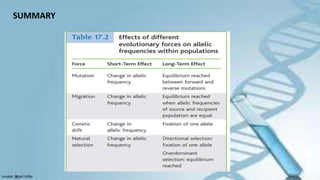
Several Evolutionary ForcesCan Disrupt Hardy-Weinberg equilibrium.
The Hardy–Weinberg law indicates that allelic frequencies do not change as a
result of reproduction. The processes that bring about change in allelic
frequencies include
• Nonrandom mating,
• Mutation,
• Migration,
• Genetic drift (random effects due to small population size),
• and Natural selection
Nonrandom mating cantake one of
several forms. POSITIVE & NEGATIVE
ASSORIVE MATING
In positive assortative mating, similar
phenotype are more likely to mate than
dissimilar ones.
This often occurs in humans: A number
of studies have indicated that many
people are more attracted to individuals
who physically resemble them (and are
therefore more likely to be genetically
similar as well).
30.
Negative assortative matingoccurs
when dissimilar phenotype are more
likely to mate.
Some plant species have inbuilt
recognition systems that prevent
fertilization between individuals with
the same alleles at key loci.
31.
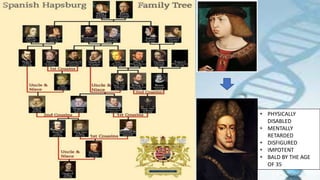
However, the formof nonrandom mating most
commonly found to affect genotype frequencies in
population genetics is inbreeding.
Inbreeding occurs when mating individuals are more
closely related than any two individuals drawn from
the population at random; loosely defined,
inbreeding is mating among relatives.
For a given allele, inbreeding increases the
proportion of homozygotes and decreases the
proportion of heterozygotes in the population.
A completely inbred population will theoretically
consist only of homozygous genotypes.
MUTATION
Before evolution cantake place, genetic variation must exist within a
population; consequently, all evolution depends on processes that generate
genetic variation.
The enormous genetic variation present in the gene pool allows assortment
and recombination to produce new combinations of genes already present in
the gene pool.
But assortment and recombination do not produce new alleles.
Mutation alone acts to create new alleles.
35.
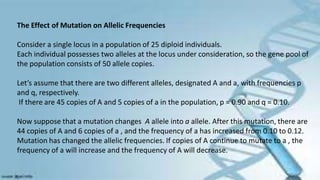
The Effect ofMutation on Allelic Frequencies
Consider a single locus in a population of 25 diploid individuals.
Each individual possesses two alleles at the locus under consideration, so the gene pool of
the population consists of 50 allele copies.
Let’s assume that there are two different alleles, designated A and a, with frequencies p
and q, respectively.
If there are 45 copies of A and 5 copies of a in the population, p = 0.90 and q = 0.10.
Now suppose that a mutation changes A allele into a allele. After this mutation, there are
44 copies of A and 6 copies of a , and the frequency of a has increased from 0.10 to 0.12.
Mutation has changed the allelic frequencies. If copies of A continue to mutate to a , the
frequency of a will increase and the frequency of A will decrease.
36.
The amount thata will change as a result of mutation depends on:
(1) the rate of A -to-a mutation, and
(2) the frequency of A in the population.
The mutation rate is defined as the probability that a gene will be altered by a new
mutation.
A common value for the mutation rate is in the range of 1 in 100,000 to 1 in 1,000,000, or
10^–5 to 10^–6 per generation.
37.
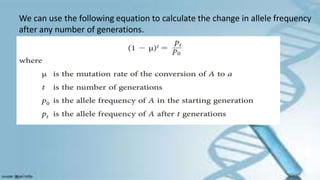
We can usethe following equation to calculate the change in allele frequency
after any number of generations.
38.
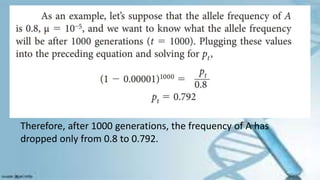
Therefore, after 1000generations, the frequency of A has
dropped only from 0.8 to 0.792.
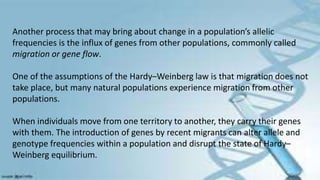
Another process thatmay bring about change in a population’s allelic
frequencies is the influx of genes from other populations, commonly called
migration or gene flow.
One of the assumptions of the Hardy–Weinberg law is that migration does not
take place, but many natural populations experience migration from other
populations.
When individuals move from one territory to another, they carry their genes
with them. The introduction of genes by recent migrants can alter allele and
genotype frequencies within a population and disrupt the state of Hardy–
Weinberg equilibrium.
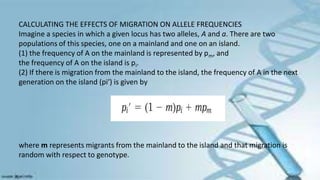
42.
CALCULATING THE EFFECTSOF MIGRATION ON ALLELE FREQUENCIES
Imagine a species in which a given locus has two alleles, A and a. There are two
populations of this species, one on a mainland and one on an island.
(1) the frequency of A on the mainland is represented by pm, and
the frequency of A on the island is pi.
(2) If there is migration from the mainland to the island, the frequency of A in the next
generation on the island (pi′) is given by
where m represents migrants from the mainland to the island and that migration is
random with respect to genotype.
43.
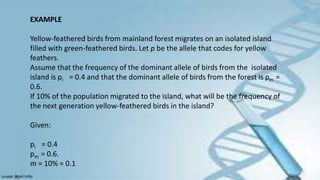
EXAMPLE
Yellow-feathered birds frommainland forest migrates on an isolated island
filled with green-feathered birds. Let p be the allele that codes for yellow
feathers.
Assume that the frequency of the dominant allele of birds from the isolated
island is pi = 0.4 and that the dominant allele of birds from the forest is pm =
0.6.
If 10% of the population migrated to the island, what will be the frequency of
the next generation yellow-feathered birds in the island?
Given:
pi = 0.4
pm = 0.6.
m = 10% = 0.1
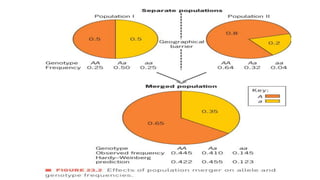
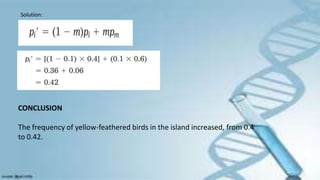
The effect ofmigration on allelic frequencies.
After migration, population II consists of two types of individuals: (1) migrants with
genes from population I, and (2) the original residents with genes from population II.
The allelic frequencies in population II after migration depend on the alleles of migrants
and original population.
The amount of frequency change of allele in population II is directly proportional to the
amount of migration.
The magnitude of change is also affected by the differences in allelic frequencies of two
population.
46.
Migration has twomajor effects.
First, migration adds genetic variation to populations. Different alleles may arise in
different populations owing to rare mutational events, and these alleles can be
spread to new populations by migration, increasing the genetic variation within the
recipient population
Second, it causes the gene pools of different populations to become more similar.
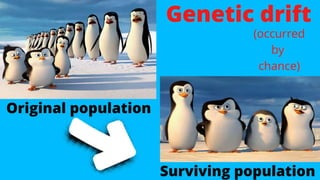
GENETIC DRIFT
It isa process by which significant random fluctuations in allele frequencies are
caused by chance alone due to small population.
When the population size is small, a limited number of gametes unite to produce the
individuals of the next generation, and chance influences which alleles are present in
this limited sample. In this way, the error due to chance may lead to genetic drift
A population’s susceptibility to random genetic drift depends on its size. In large
populations, the effect of genetic drift is minimal, whereas in small ones, it may be
the primary evolutionary force.
Geneticists gauge the effect of population size by monitoring the frequency of
heterozygotes over time.
49.
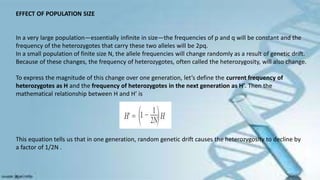
EFFECT OF POPULATIONSIZE
In a very large population—essentially infinite in size—the frequencies of p and q will be constant and the
frequency of the heterozygotes that carry these two alleles will be 2pq.
In a small population of finite size N, the allele frequencies will change randomly as a result of genetic drift.
Because of these changes, the frequency of heterozygotes, often called the heterozygosity, will also change.
To express the magnitude of this change over one generation, let’s define the current frequency of
heterozygotes as H and the frequency of heterozygotes in the next generation as H’. Then the
mathematical relationship between H and H’ is
This equation tells us that in one generation, random genetic drift causes the heterozygosity to decline by
a factor of 1/2N .
50.
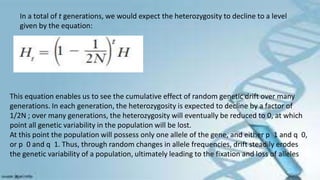
In a totalof t generations, we would expect the heterozygosity to decline to a level
given by the equation:
This equation enables us to see the cumulative effect of random genetic drift over many
generations. In each generation, the heterozygosity is expected to decline by a factor of
1/2N ; over many generations, the heterozygosity will eventually be reduced to 0, at which
point all genetic variability in the population will be lost.
At this point the population will possess only one allele of the gene, and either p 1 and q 0,
or p 0 and q 1. Thus, through random changes in allele frequencies, drift steadily erodes
the genetic variability of a population, ultimately leading to the fixation and loss of alleles
51.
Drift ultimately leadsto the fixation of one allele at a locus and the loss of all
other alleles; the probability that an allele will ultimately be fixed is equal to
its current frequency in the population.
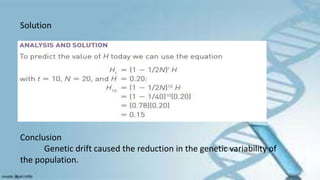
52.
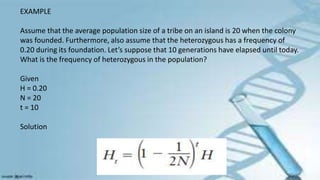
EXAMPLE
Assume that theaverage population size of a tribe on an island is 20 when the colony
was founded. Furthermore, also assume that the heterozygous has a frequency of
0.20 during its foundation. Let’s suppose that 10 generations have elapsed until today.
What is the frequency of heterozygous in the population?
Given
H = 0.20
N = 20
t = 10
Solution
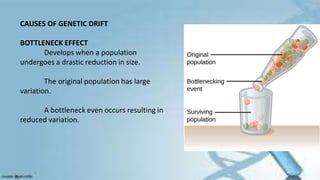
CAUSES OF GENETICDRIFT
BOTTLENECK EFFECT
Develops when a population
undergoes a drastic reduction in size.
The original population has large
variation.
A bottleneck even occurs resulting in
reduced variation.
55.
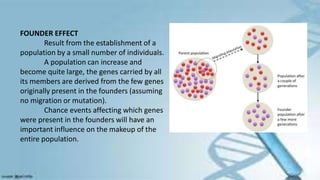
FOUNDER EFFECT
Result fromthe establishment of a
population by a small number of individuals.
A population can increase and
become quite large, the genes carried by all
its members are derived from the few genes
originally present in the founders (assuming
no migration or mutation).
Chance events affecting which genes
were present in the founders will have an
important influence on the makeup of the
entire population.
56.
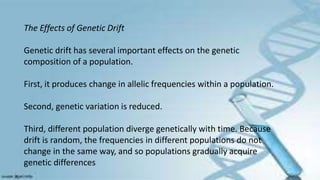
The Effects ofGenetic Drift
Genetic drift has several important effects on the genetic
composition of a population.
First, it produces change in allelic frequencies within a population.
Second, genetic variation is reduced.
Third, different population diverge genetically with time. Because
drift is random, the frequencies in different populations do not
change in the same way, and so populations gradually acquire
genetic differences
58.
WHAT IS NATURALSELECTION?
Differential reproduction of genotypes.
Individuals with adaptive traits produce a greater
number of offspring than that produced by others
in the population.
Better traits are inherited and appear with greater
frequency.
The effect of natural selection on the gene pool of a
population depends on the fitness values of the
genotypes in the population
59.
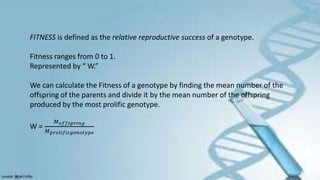
FITNESS is definedas the relative reproductive success of a genotype.
Fitness ranges from 0 to 1.
Represented by “ W.”
We can calculate the Fitness of a genotype by finding the mean number of the
offspring of the parents and divide it by the mean number of the offspring
produced by the most prolific genotype.
W =
𝑀𝑜𝑓𝑓𝑠𝑝𝑟𝑖𝑛𝑔
𝑀𝑝𝑟𝑜𝑙𝑖𝑓𝑖𝑐𝑔𝑒𝑛𝑜𝑡𝑦𝑝𝑒
60.
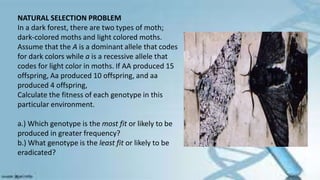
NATURAL SELECTION PROBLEM
Ina dark forest, there are two types of moth;
dark-colored moths and light colored moths.
Assume that the A is a dominant allele that codes
for dark colors while a is a recessive allele that
codes for light color in moths. If AA produced 15
offspring, Aa produced 10 offspring, and aa
produced 4 offspring,
Calculate the fitness of each genotype in this
particular environment.
a.) Which genotype is the most fit or likely to be
produced in greater frequency?
b.) What genotype is the least fit or likely to be
eradicated?
61.
SELECTION COEFFICIENT (s)- relative intensity of selection AGAINST a
genotype.
- it is equal to 1-W
PROBLEM:
Using the given from the previous problem, calculate the selection
coefficient of each genotype
a.) Which genotype is likely to be selected against?
b.) Which genotype is likely to be selected for?
62.
The Wallace–Darwin conceptof natural selection can be summarized as follows:
1. Individuals of a species exhibit variations in phenotype—for example, differences in
size, agility, coloration, defenses against enemies, ability to obtain food, courtship
behaviors, and flowering times.
2. Many of these variations, even small and seemingly insignificant ones, are heritable
and are passed on to offspring.
3. Organisms tend to reproduce in an exponential fashion. More offspring are
produced than can survive. This causes members of a species to engage in a struggle
for survival, competing with other members of the community for scarce resources.
Offspring also must avoid predators, and in sexually reproducing species, adults must
compete for mates.
4. In the struggle for survival, individuals with particular phenotypes will be more
successful than others, allowing the former to survive and reproduce at higher rates
64.
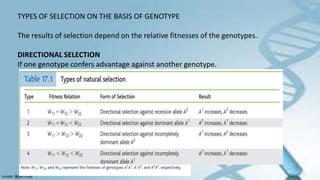
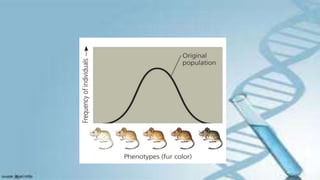
TYPES OF SELECTIONON THE BASIS OF GENOTYPE
The results of selection depend on the relative fitnesses of the genotypes.
DIRECTIONAL SELECTION
If one genotype confers advantage against another genotype.
65.
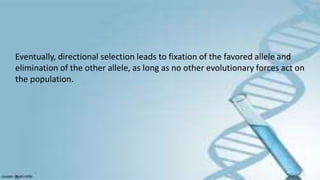
Eventually, directional selectionleads to fixation of the favored allele and
elimination of the other allele, as long as no other evolutionary forces act on
the population.
66.
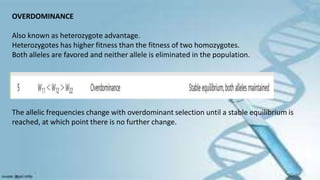
OVERDOMINANCE
Also known asheterozygote advantage.
Heterozygotes has higher fitness than the fitness of two homozygotes.
Both alleles are favored and neither allele is eliminated in the population.
The allelic frequencies change with overdominant selection until a stable equilibrium is
reached, at which point there is no further change.
67.
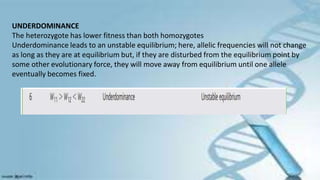
UNDERDOMINANCE
The heterozygote haslower fitness than both homozygotes
Underdominance leads to an unstable equilibrium; here, allelic frequencies will not change
as long as they are at equilibrium but, if they are disturbed from the equilibrium point by
some other evolutionary force, they will move away from equilibrium until one allele
eventually becomes fixed.
68.
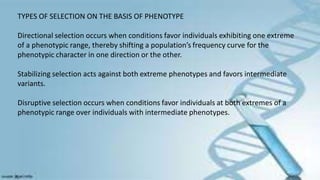
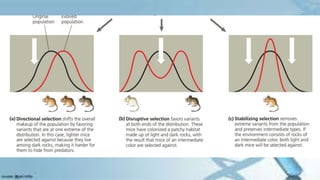
TYPES OF SELECTIONON THE BASIS OF PHENOTYPE
Directional selection occurs when conditions favor individuals exhibiting one extreme
of a phenotypic range, thereby shifting a population’s frequency curve for the
phenotypic character in one direction or the other.
Stabilizing selection acts against both extreme phenotypes and favors intermediate
variants.
Disruptive selection occurs when conditions favor individuals at both extremes of a
phenotypic range over individuals with intermediate phenotypes.
71.
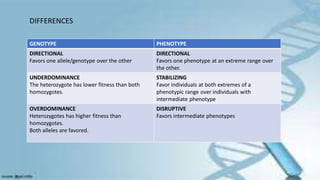
DIFFERENCES
GENOTYPE PHENOTYPE
DIRECTIONAL
Favors oneallele/genotype over the other
DIRECTIONAL
Favors one phenotype at an extreme range over
the other.
UNDERDOMINANCE
The heterozygote has lower fitness than both
homozygotes.
STABILIZING
Favor individuals at both extremes of a
phenotypic range over individuals with
intermediate phenotype
OVERDOMINANCE
Heterozygotes has higher fitness than
homozygotes.
Both alleles are favored.
DISRUPTIVE
Favors intermediate phenotypes
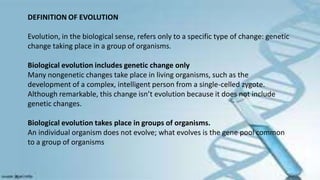
DEFINITION OF EVOLUTION
Evolution,in the biological sense, refers only to a specific type of change: genetic
change taking place in a group of organisms.
Biological evolution includes genetic change only
Many nongenetic changes take place in living organisms, such as the
development of a complex, intelligent person from a single-celled zygote.
Although remarkable, this change isn’t evolution because it does not include
genetic changes.
Biological evolution takes place in groups of organisms.
An individual organism does not evolve; what evolves is the gene pool common
to a group of organisms
76.
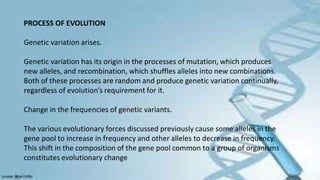
PROCESS OF EVOLUTION
Geneticvariation arises.
Genetic variation has its origin in the processes of mutation, which produces
new alleles, and recombination, which shuffles alleles into new combinations.
Both of these processes are random and produce genetic variation continually,
regardless of evolution’s requirement for it.
Change in the frequencies of genetic variants.
The various evolutionary forces discussed previously cause some alleles in the
gene pool to increase in frequency and other alleles to decrease in frequency.
This shift in the composition of the gene pool common to a group of organisms
constitutes evolutionary change
77.
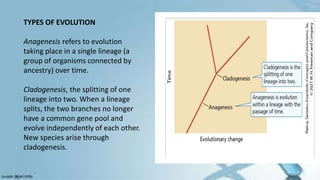
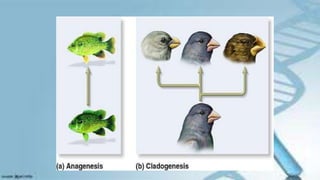
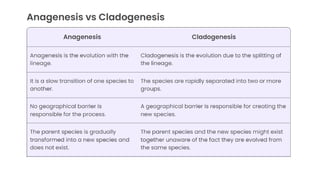
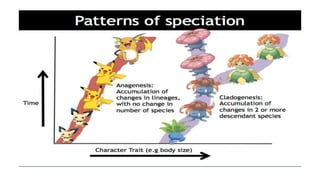
TYPES OF EVOLUTION
Anagenesisrefers to evolution
taking place in a single lineage (a
group of organisms connected by
ancestry) over time.
Cladogenesis, the splitting of one
lineage into two. When a lineage
splits, the two branches no longer
have a common gene pool and
evolve independently of each other.
New species arise through
cladogenesis.
83.
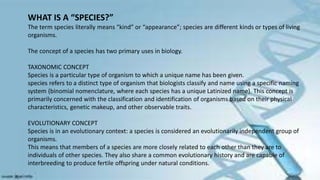
WHAT IS A“SPECIES?”
The term species literally means “kind” or “appearance”; species are different kinds or types of living
organisms.
The concept of a species has two primary uses in biology.
TAXONOMIC CONCEPT
Species is a particular type of organism to which a unique name has been given.
species refers to a distinct type of organism that biologists classify and name using a specific naming
system (binomial nomenclature, where each species has a unique Latinized name). This concept is
primarily concerned with the classification and identification of organisms based on their physical
characteristics, genetic makeup, and other observable traits.
EVOLUTIONARY CONCEPT
Species is in an evolutionary context: a species is considered an evolutionarily independent group of
organisms.
This means that members of a species are more closely related to each other than they are to
individuals of other species. They also share a common evolutionary history and are capable of
interbreeding to produce fertile offspring under natural conditions.
84.
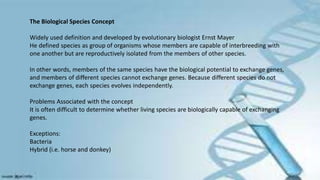
The Biological SpeciesConcept
Widely used definition and developed by evolutionary biologist Ernst Mayer
He defined species as group of organisms whose members are capable of interbreeding with
one another but are reproductively isolated from the members of other species.
In other words, members of the same species have the biological potential to exchange genes,
and members of different species cannot exchange genes. Because different species do not
exchange genes, each species evolves independently.
Problems Associated with the concept
It is often difficult to determine whether living species are biologically capable of exchanging
genes.
Exceptions:
Bacteria
Hybrid (i.e. horse and donkey)
85.
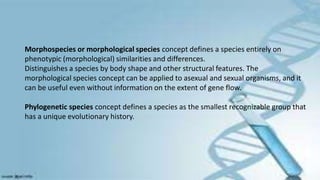
Morphospecies or morphologicalspecies concept defines a species entirely on
phenotypic (morphological) similarities and differences.
Distinguishes a species by body shape and other structural features. The
morphological species concept can be applied to asexual and sexual organisms, and it
can be useful even without information on the extent of gene flow.
Phylogenetic species concept defines a species as the smallest recognizable group that
has a unique evolutionary history.
86.
SPECIATION
SPECIATION – aprocess by which new species arise.
Speciation comes about through the evolution of reproductive isolating
mechanisms—mechanisms that prevent the exchange of genes between groups of
organisms.
TYPES OF SPECIATION
1. ALLOPATRIC SPECIATION
2. PARAPATRIC SPECIATION
3. SYMPATRIC SPECIATION
87.
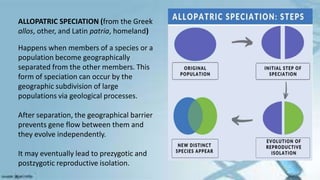
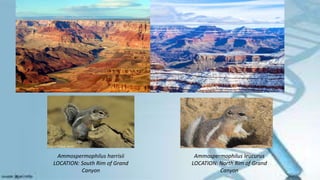
ALLOPATRIC SPECIATION (fromthe Greek
allos, other, and Latin patria, homeland)
Happens when members of a species or a
population become geographically
separated from the other members. This
form of speciation can occur by the
geographic subdivision of large
populations via geological processes.
After separation, the geographical barrier
prevents gene flow between them and
they evolve independently.
It may eventually lead to prezygotic and
postzygotic reproductive isolation.
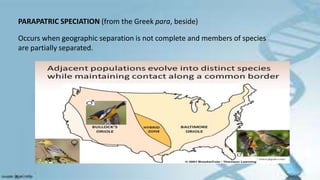
PARAPATRIC SPECIATION (fromthe Greek para, beside)
Occurs when geographic separation is not complete and members of species
are partially separated.
90.
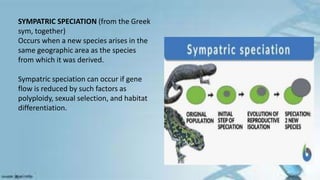
SYMPATRIC SPECIATION (fromthe Greek
sym, together)
Occurs when a new species arises in the
same geographic area as the species
from which it was derived.
Sympatric speciation can occur if gene
flow is reduced by such factors as
polyploidy, sexual selection, and habitat
differentiation.
91.
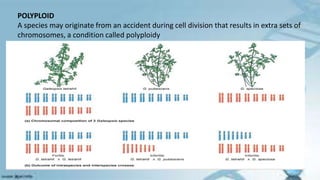
POLYPLOID
A species mayoriginate from an accident during cell division that results in extra sets of
chromosomes, a condition called polyploidy
92.
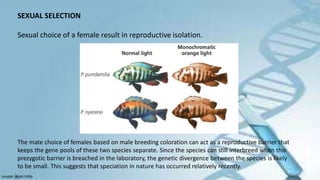
SEXUAL SELECTION
Sexual choiceof a female result in reproductive isolation.
The mate choice of females based on male breeding coloration can act as a reproductive barrier that
keeps the gene pools of these two species separate. Since the species can still interbreed when this
prezygotic barrier is breached in the laboratory, the genetic divergence between the species is likely
to be small. This suggests that speciation in nature has occurred relatively recently.
93.
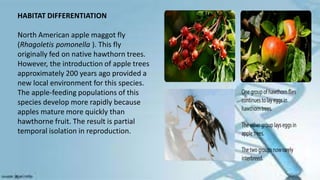
HABITAT DIFFERENTIATION
North Americanapple maggot fly
(Rhagoletis pomonella ). This fly
originally fed on native hawthorn trees.
However, the introduction of apple trees
approximately 200 years ago provided a
new local environment for this species.
The apple-feeding populations of this
species develop more rapidly because
apples mature more quickly than
hawthorne fruit. The result is partial
temporal isolation in reproduction.
94.
REPRODUCTIVE ISOLATING MECHANISMS
Thekey to species differences under the biological species concept is reproductive
isolation—biological characteristics that prevent genes from being exchanged between
different species.
Any biological factor or mechanism that prevents gene exchange is termed a
reproductive isolating mechanism.
It is the key to the genetic definition of species.
95.
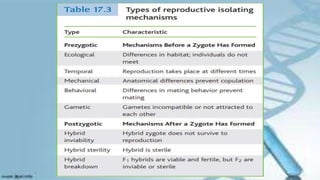
Prezygotic reproductive isolatingmechanisms, which prevent gametes from two different
species from fusing and forming a hybrid zygote.
Postzygotic reproductive isolating mechanisms, in which gametes of two species fuse and
form a zygote, but there is no gene flow between the two species, either because the
resulting hybrids are inviable or sterile or because reproduction breaks down in
subsequent generation
97.
MOLECULAR EVOLUTION
Refers topatterns and processes associated with evolutionary change at the molecular level.
Evolutionary changes at the DNA level can be objectively compared among different species
to establish evolutionary relationships. Furthermore, this approach can be used to compare
any two existing organisms, no matter how greatly they differ in their morphological traits.
For example, we can compare DNA sequences between humans and bacteria, or between
plants and fruit flies. Such comparisons would be very difficult at a morphological level.
98.
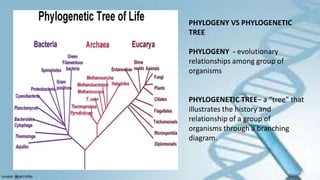
PHYLOGENY VS PHYLOGENETIC
TREE
PHYLOGENY- evolutionary
relationships among group of
organisms
PHYLOGENETIC TREE– a “tree” that
illustrates the history and
relationship of a group of
organisms through a branching
diagram.
99.
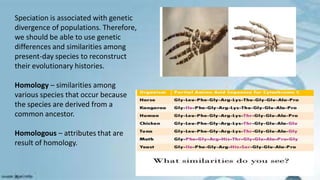
Speciation is associatedwith genetic
divergence of populations. Therefore,
we should be able to use genetic
differences and similarities among
present-day species to reconstruct
their evolutionary histories.
Homology – similarities among
various species that occur because
the species are derived from a
common ancestor.
Homologous – attributes that are
result of homology.
102.
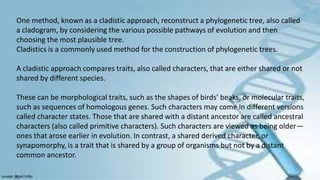
One method, knownas a cladistic approach, reconstruct a phylogenetic tree, also called
a cladogram, by considering the various possible pathways of evolution and then
choosing the most plausible tree.
Cladistics is a commonly used method for the construction of phylogenetic trees.
A cladistic approach compares traits, also called characters, that are either shared or not
shared by different species.
These can be morphological traits, such as the shapes of birds’ beaks, or molecular traits,
such as sequences of homologous genes. Such characters may come in different versions
called character states. Those that are shared with a distant ancestor are called ancestral
characters (also called primitive characters). Such characters are viewed as being older—
ones that arose earlier in evolution. In contrast, a shared derived character, or
synapomorphy, is a trait that is shared by a group of organisms but not by a distant
common ancestor.
103.
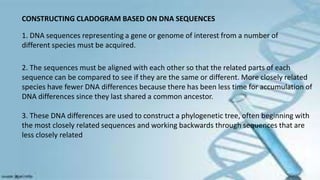
CONSTRUCTING CLADOGRAM BASEDON DNA SEQUENCES
1. DNA sequences representing a gene or genome of interest from a number of
different species must be acquired.
2. The sequences must be aligned with each other so that the related parts of each
sequence can be compared to see if they are the same or different. More closely related
species have fewer DNA differences because there has been less time for accumulation of
DNA differences since they last shared a common ancestor.
3. These DNA differences are used to construct a phylogenetic tree, often beginning with
the most closely related sequences and working backwards through sequences that are
less closely related
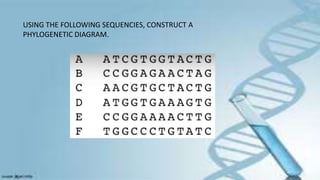
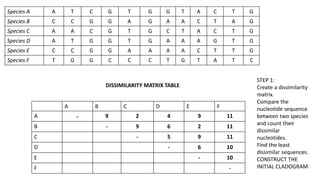
Species A AT C G T G G T A C T G
Species B C C G G A G A A C T A G
Species C A A C G T G C T A C T G
Species D A T G G T G A A A G T G
Species E C C G G A A A A C T T G
Species F T G G C C C T G T A T C
A B C D E F
A - 9 2 4 9 11
B - 9 6 2 11
C - 5 9 11
D - 6 10
E - 10
F -
DISSIMILARITY MATRIX TABLE
STEP 1:
Create a dissimilarity
matrix.
Compare the
nucleotide sequence
between two species
and count their
dissimilar
nucleotides.
Find the least
dissimilar sequences.
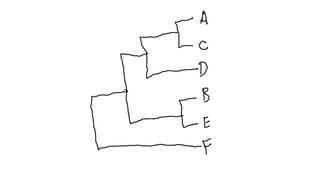
CONSTRUCT THE
INITIAL CLADOGRAM
106.
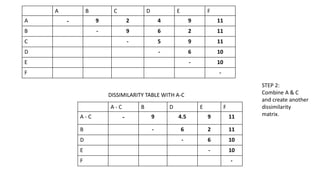
A - CB D E F
A - C - 9 4.5 9 11
B - 6 2 11
D - 6 10
E - 10
F -
DISSIMILARITY TABLE WITH A-C
A B C D E F
A - 9 2 4 9 11
B - 9 6 2 11
C - 5 9 11
D - 6 10
E - 10
F -
STEP 2:
Combine A & C
and create another
dissimilarity
matrix.
107.
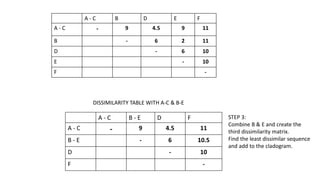
A - CB - E D F
A - C - 9 4.5 11
B - E - 6 10.5
D - 10
F -
A - C B D E F
A - C - 9 4.5 9 11
B - 6 2 11
D - 6 10
E - 10
F -
DISSIMILARITY TABLE WITH A-C & B-E
STEP 3:
Combine B & E and create the
third dissimilarity matrix.
Find the least dissimilar sequence
and add to the cladogram.
108.
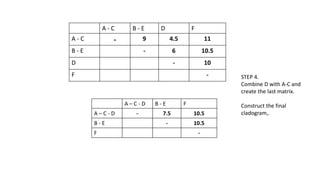
A – C- D B - E F
A – C - D - 7.5 10.5
B - E - 10.5
F -
A - C B - E D F
A - C - 9 4.5 11
B - E - 6 10.5
D - 10
F - STEP 4.
Combine D with A-C and
create the last matrix.
Construct the final
cladogram,.
110.
RATE OF MOLECULAREVOLUTION
Refers to the speed at which the sequences of molecules, such as DNA or proteins,
change over time within a population or lineage of organisms.
This rate is typically measured as the number of substitutions or changes that accumulate
in the sequences of these molecules per unit of time.
111.
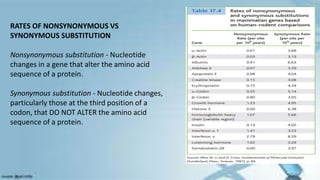
RATES OF NONSYNONYMOUSVS
SYNONYMOUS SUBSTITUTION
Nonsynonymous substitution - Nucleotide
changes in a gene that alter the amino acid
sequence of a protein.
Synonymous substitution - Nucleotide changes,
particularly those at the third position of a
codon, that DO NOT ALTER the amino acid
sequence of a protein.
112.
The synonymous rateof change is considerably higher than the
nonsynonymous rate because synonymous mutations are tolerated by
natural selection.
Nonsynonymous mutations, on the other hand, alter the amino acid
sequence of the protein and, in many cases, are detrimental to the
fitness of the organism; so most of these mutations are eliminated by
natural selection.
113.
Substitution Rates forDifferent Parts of a Gene
Different parts of a gene also evolve at different rates.
The highest rates of substitution occur in those regions of the gene that have the least
effect on function, such as the third position of a codon, flanking regions, and introns.
The 5 ′ and 3 ′ flanking regions of genes are not transcribed into RNA; therefore,
substitutions in these regions do not alter the amino acid sequence of the protein.
Substitution rates are somewhat lower in the 5’ and 3’ untranslated regions of a gene.
The 5 untranslated region contains the ribosome-binding site, which is essential for
translation, and the 3 untranslated region contains sequences that may function in
regulating mRNA stability and translation; so substitutions in these regions may have
deleterious effects on organismal fitness and may not be tolerated.
114.
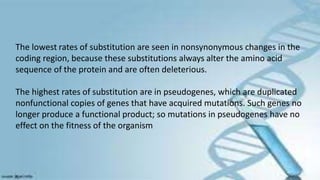
The lowest ratesof substitution are seen in nonsynonymous changes in the
coding region, because these substitutions always alter the amino acid
sequence of the protein and are often deleterious.
The highest rates of substitution are in pseudogenes, which are duplicated
nonfunctional copies of genes that have acquired mutations. Such genes no
longer produce a functional product; so mutations in pseudogenes have no
effect on the fitness of the organism
115.
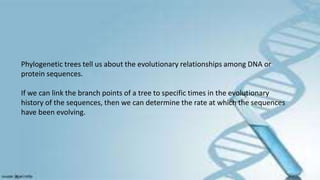
Phylogenetic trees tellus about the evolutionary relationships among DNA or
protein sequences.
If we can link the branch points of a tree to specific times in the evolutionary
history of the sequences, then we can determine the rate at which the sequences
have been evolving.
116.
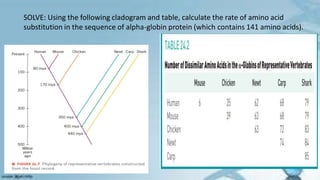
SOLVE: Using thefollowing cladogram and table, calculate the rate of amino acid
substitution in the sequence of alpha-globin protein (which contains 141 amino acids).
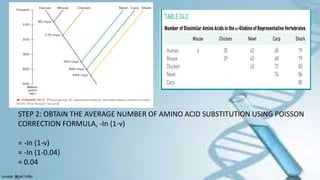
117.
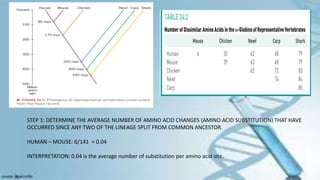
STEP 1: DETERMINETHE AVERAGE NUMBER OF AMINO ACID CHANGES (AMINO ACID SUBSTITUTION) THAT HAVE
OCCURRED SINCE ANY TWO OF THE LINEAGE SPLIT FROM COMMON ANCESTOR.
HUMAN – MOUSE: 6/141 = 0.04
INTERPRETATION: 0.04 is the average number of substitution per amino acid site.
118.
STEP 2: OBTAINTHE AVERAGE NUMBER OF AMINO ACID SUBSTITUTION USING POISSON
CORRECTION FORMULA, -In (1-v)
= -In (1-v)
= -In (1-0.04)
= 0.04
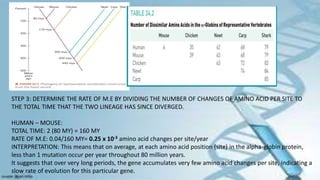
119.
STEP 3: DETERMINETHE RATE OF M.E BY DIVIDING THE NUMBER OF CHANGES OF AMINO ACID PER SITE TO
THE TOTAL TIME THAT THE TWO LINEAGE HAS SINCE DIVERGED.
HUMAN – MOUSE:
TOTAL TIME: 2 (80 MY) = 160 MY
RATE OF M.E: 0.04/160 MY= 0.25 x 10⁻³ amino acid changes per site/year
INTERPRETATION: This means that on average, at each amino acid position (site) in the alpha-globin protein,
less than 1 mutation occur per year throughout 80 million years.
It suggests that over very long periods, the gene accumulates very few amino acid changes per site, indicating a
slow rate of evolution for this particular gene.
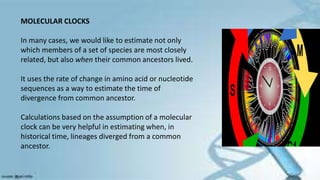
120.
MOLECULAR CLOCKS
In manycases, we would like to estimate not only
which members of a set of species are most closely
related, but also when their common ancestors lived.
It uses the rate of change in amino acid or nucleotide
sequences as a way to estimate the time of
divergence from common ancestor.
Calculations based on the assumption of a molecular
clock can be very helpful in estimating when, in
historical time, lineages diverged from a common
ancestor.
121.
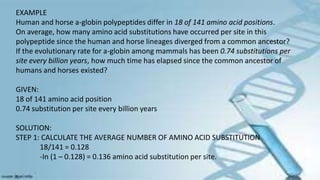
EXAMPLE
Human and horsea-globin polypeptides differ in 18 of 141 amino acid positions.
On average, how many amino acid substitutions have occurred per site in this
polypeptide since the human and horse lineages diverged from a common ancestor?
If the evolutionary rate for a-globin among mammals has been 0.74 substitutions per
site every billion years, how much time has elapsed since the common ancestor of
humans and horses existed?
GIVEN:
18 of 141 amino acid position
0.74 substitution per site every billion years
SOLUTION:
STEP 1: CALCULATE THE AVERAGE NUMBER OF AMINO ACID SUBSTITUTION
18/141 = 0.128
-In (1 – 0.128) = 0.136 amino acid substitution per site.
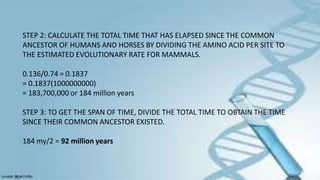
122.
STEP 2: CALCULATETHE TOTAL TIME THAT HAS ELAPSED SINCE THE COMMON
ANCESTOR OF HUMANS AND HORSES BY DIVIDING THE AMINO ACID PER SITE TO
THE ESTIMATED EVOLUTIONARY RATE FOR MAMMALS.
0.136/0.74 = 0.1837
= 0.1837(1000000000)
= 183,700,000 or 184 million years
STEP 3: TO GET THE SPAN OF TIME, DIVIDE THE TOTAL TIME TO OBTAIN THE TIME
SINCE THEIR COMMON ANCESTOR EXISTED.
184 my/2 = 92 million years
123.
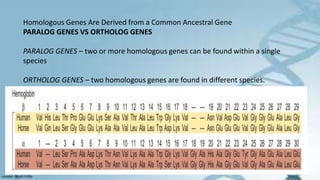
Homologous Genes AreDerived from a Common Ancestral Gene
PARALOG GENES VS ORTHOLOG GENES
PARALOG GENES – two or more homologous genes can be found within a single
species
ORTHOLOG GENES – two homologous genes are found in different species.
124.
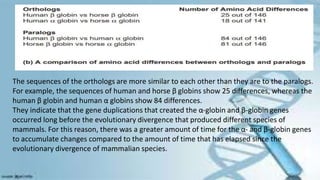
The sequences ofthe orthologs are more similar to each other than they are to the paralogs.
For example, the sequences of human and horse β globins show 25 differences, whereas the
human β globin and human α globins show 84 differences.
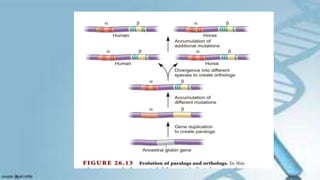
They indicate that the gene duplications that created the α-globin and β-globin genes
occurred long before the evolutionary divergence that produced different species of
mammals. For this reason, there was a greater amount of time for the α- and β-globin genes
to accumulate changes compared to the amount of time that has elapsed since the
evolutionary divergence of mammalian species.