Downloaded 106 times


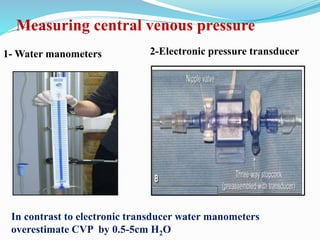
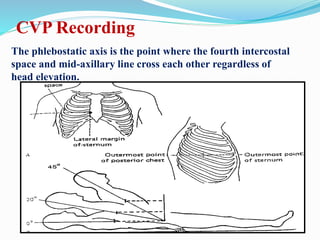
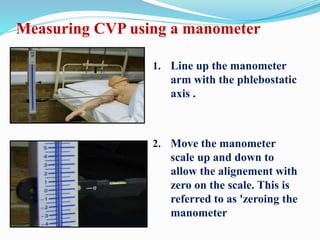
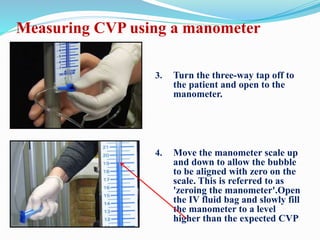
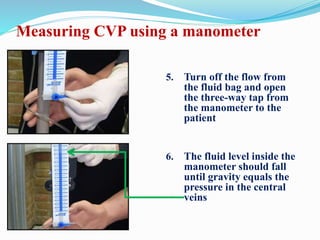
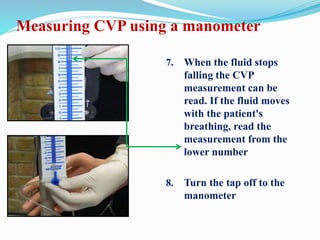
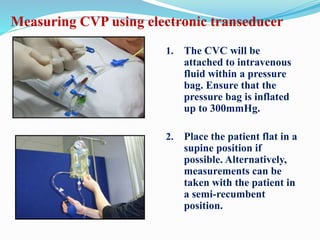
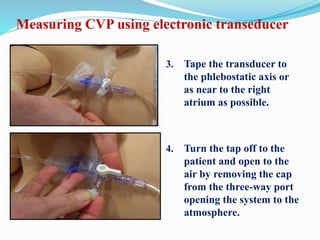
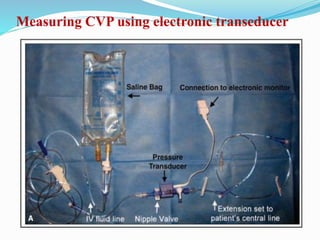
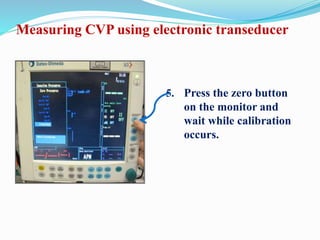
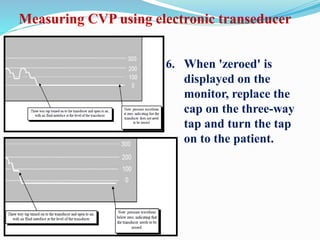

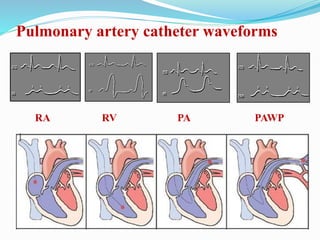


This document defines different hemodynamic waveforms and how to interpret them. There are three basic waveform morphologies: atrial, arterial, and ventricular. Atrial waveforms from the right and left atria are similar, as are waveforms between the pulmonary artery and aorta, and the right and left ventricles. The document describes how to measure central venous pressure using water manometers or electronic transducers, and interpret pulmonary artery catheter waveforms to evaluate pressures in the right atrium, right ventricle, and pulmonary artery.


![CASE_PRESENTATION_ON_subdural_hematoma(SDH)[1 FINAL PPT]-1.pptx](https://cdn.slidesharecdn.com/ss_thumbnails/casepresentationonsubduralhematomasdh1finalppt-1-260129172522-d405d375-thumbnail.jpg?width=640&height=640&fit=bounds)


