The document discusses the pulmonary artery catheter, including its history, parts, specifications, insertion technique, measurements, complications, and indications. Some key points:
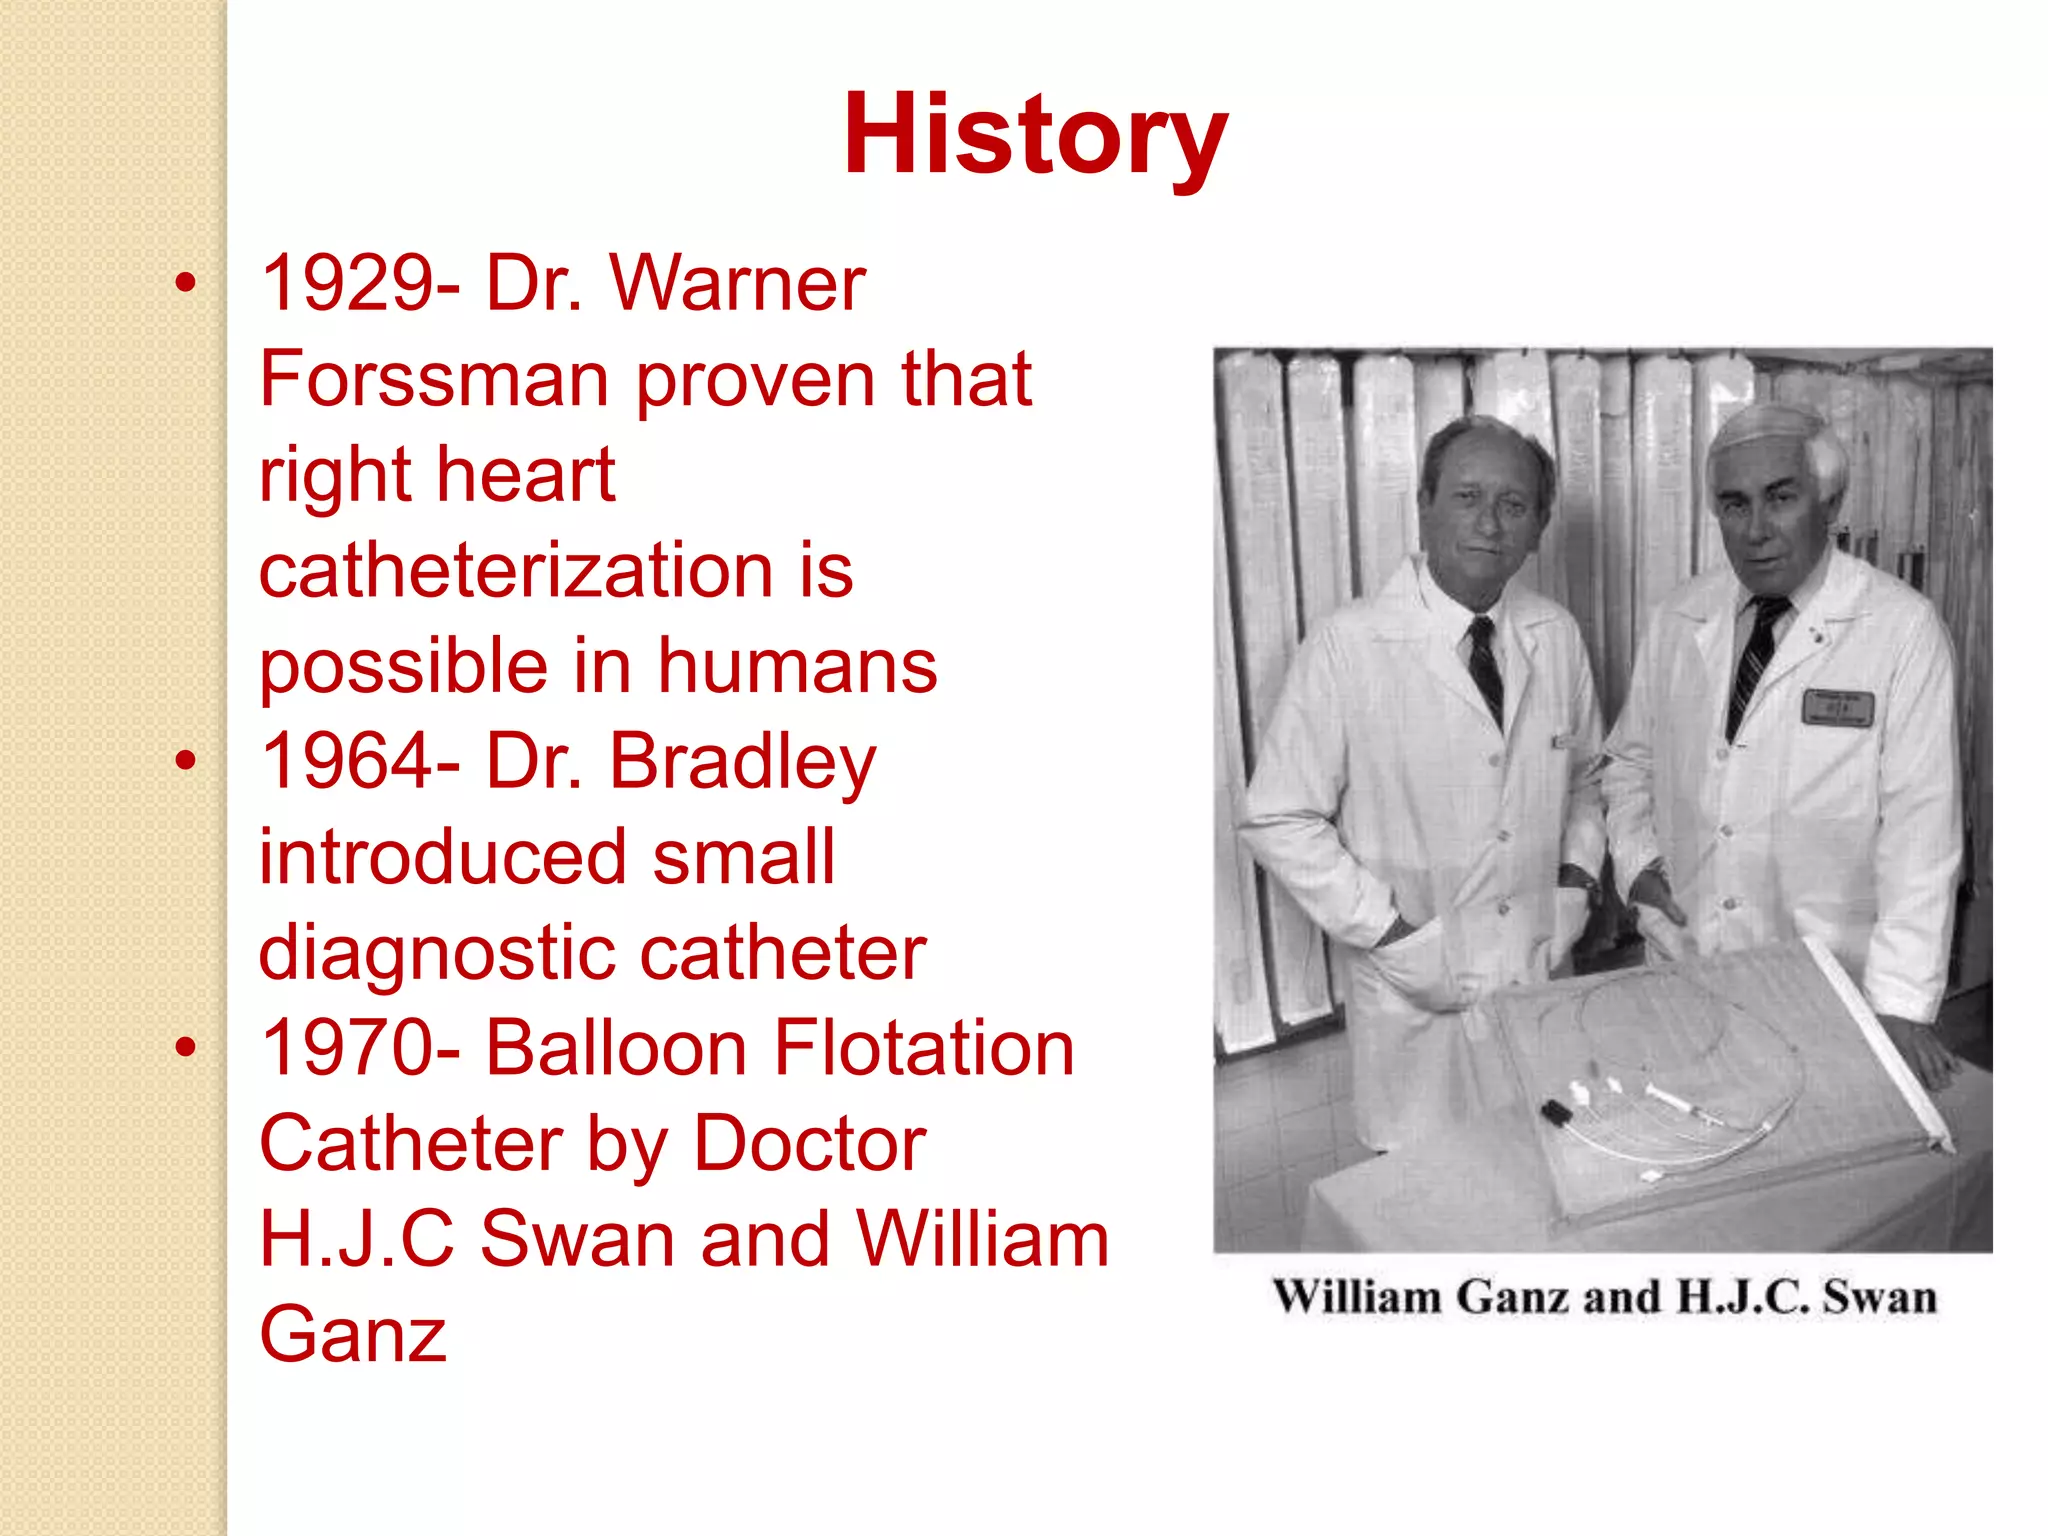
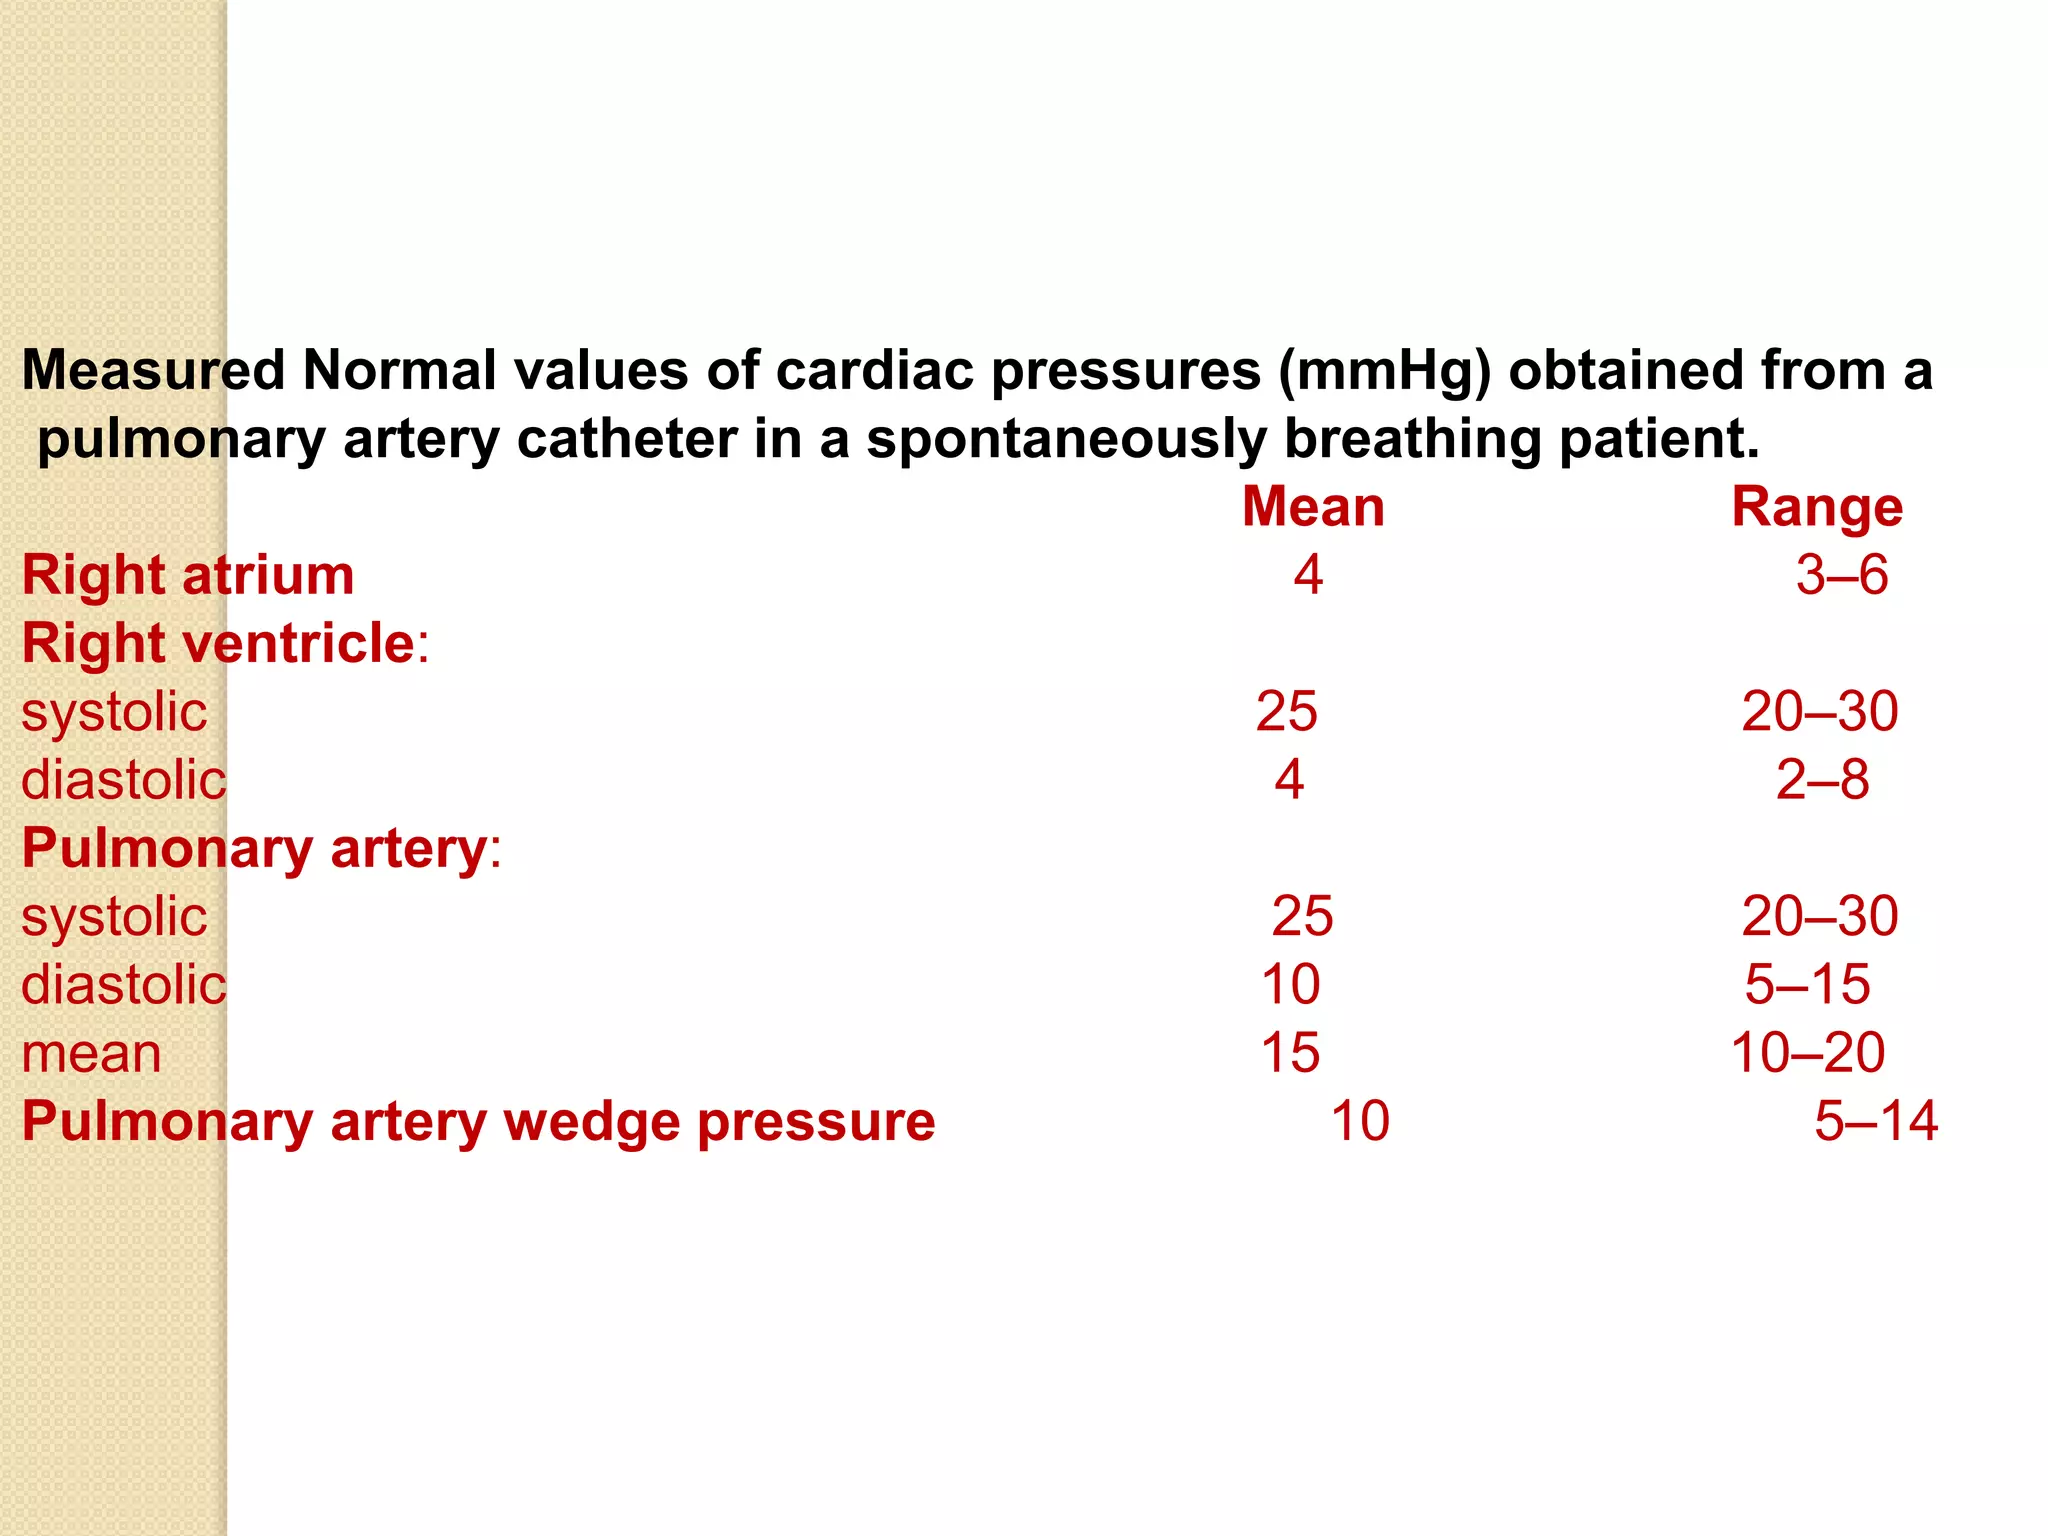
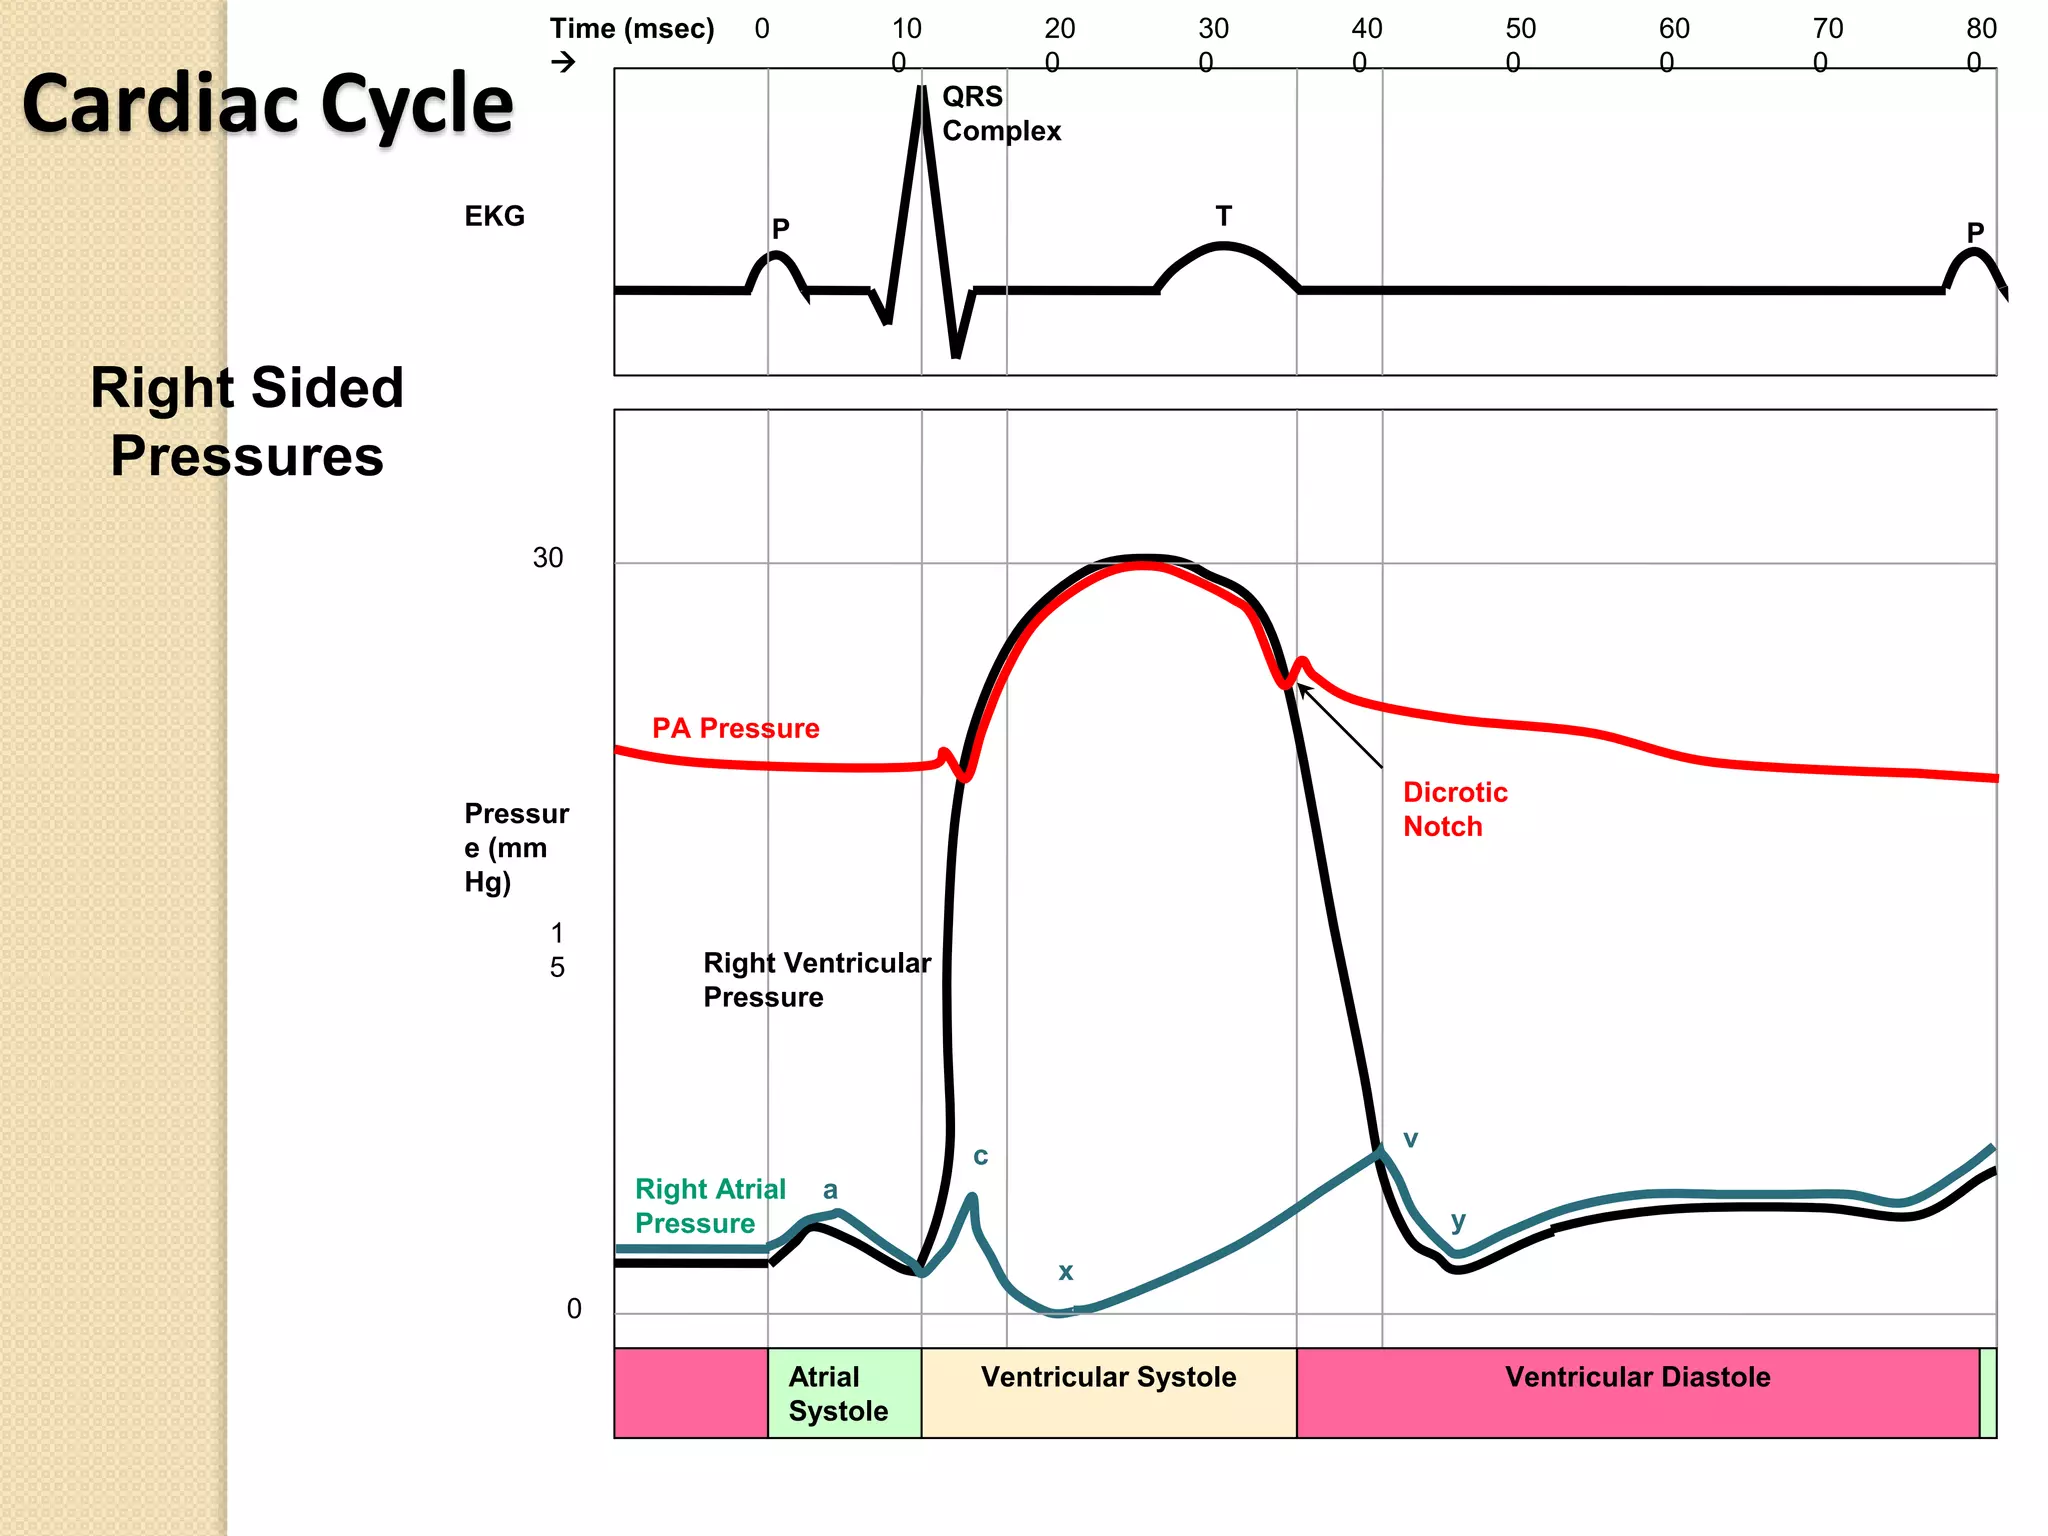
- The pulmonary artery catheter was introduced in the 1970s and can measure pressures in the right atrium, right ventricle, pulmonary artery, and pulmonary capillary wedge.
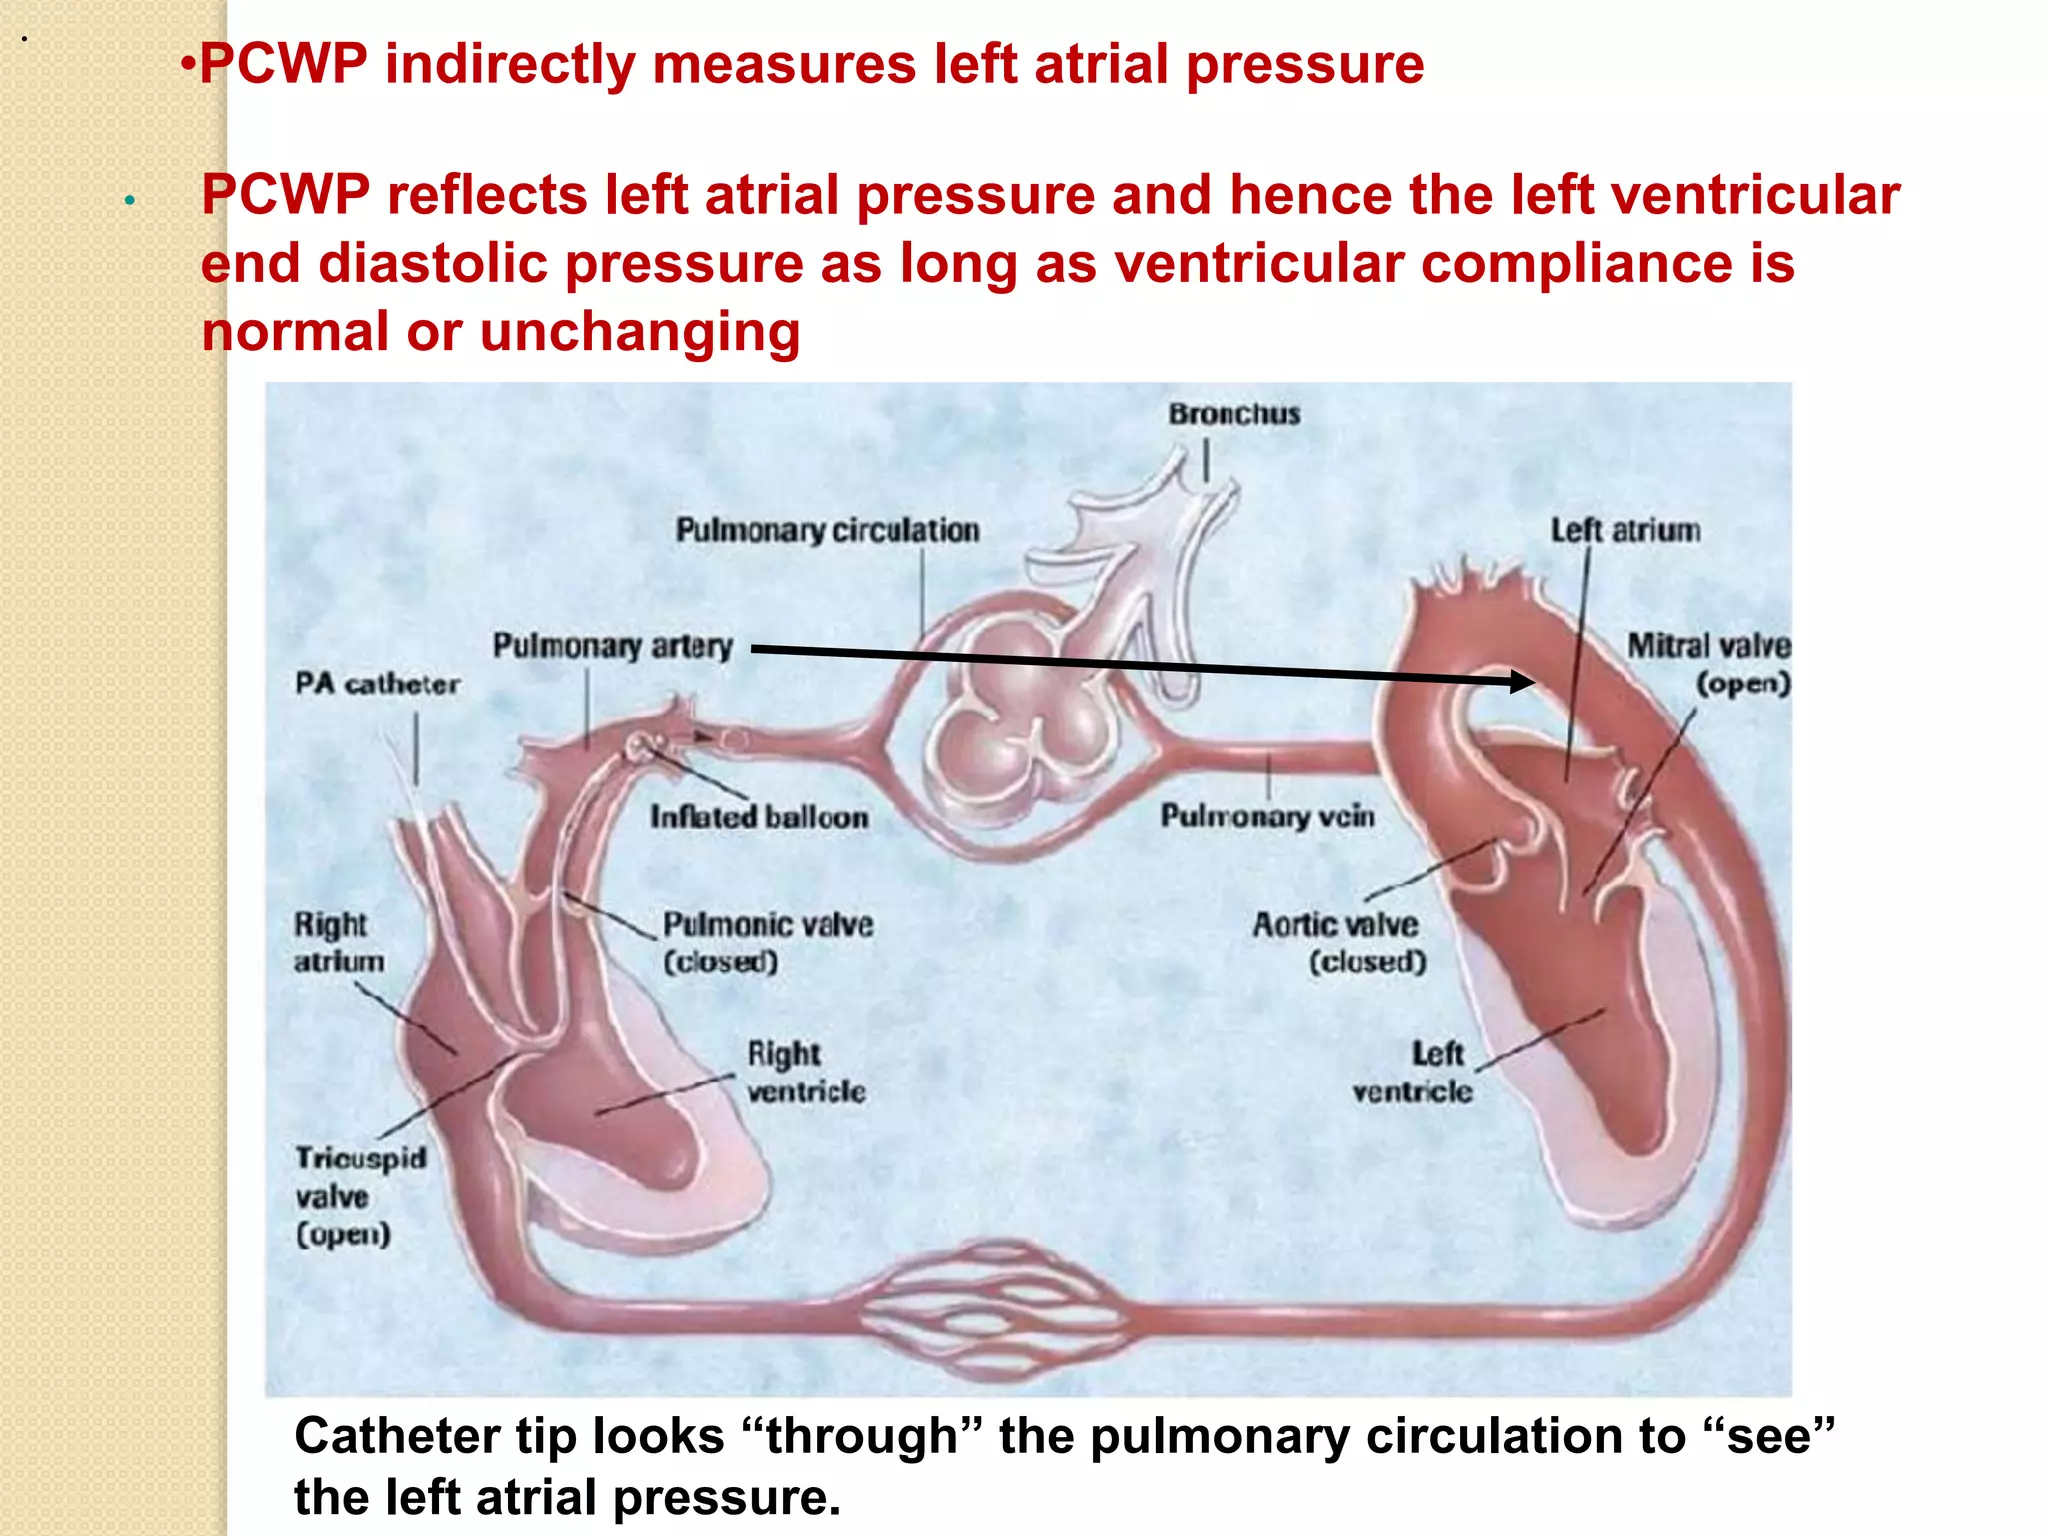
- It has multiple ports and a balloon at the tip that can be inflated to obtain pulmonary capillary wedge pressure measurements.
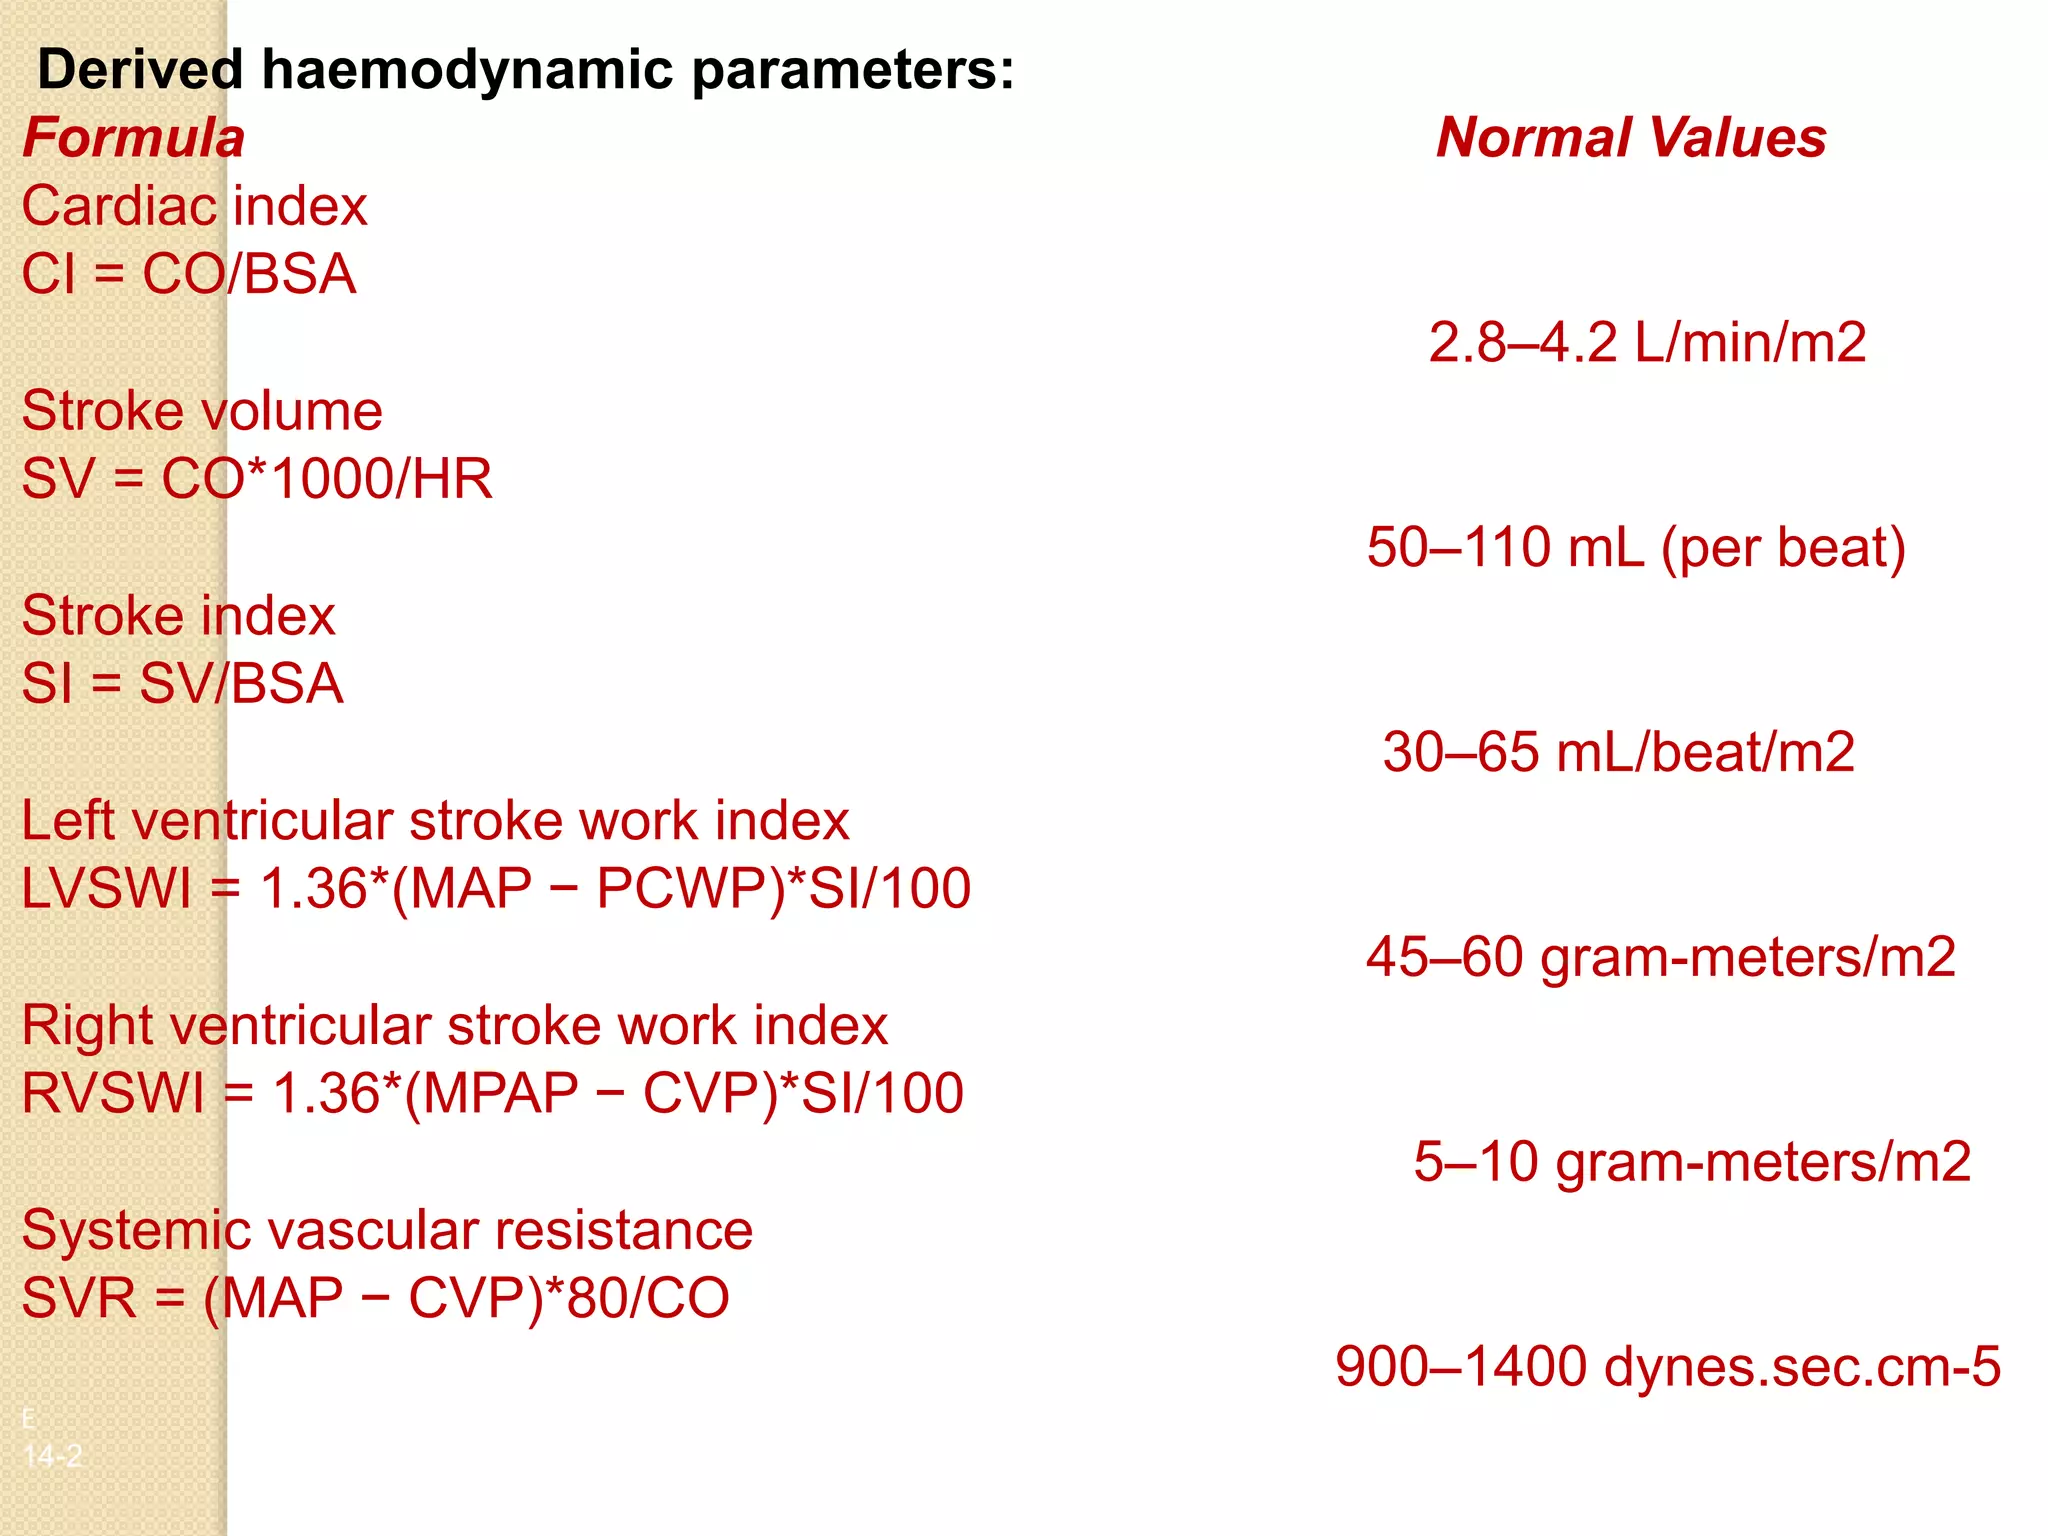
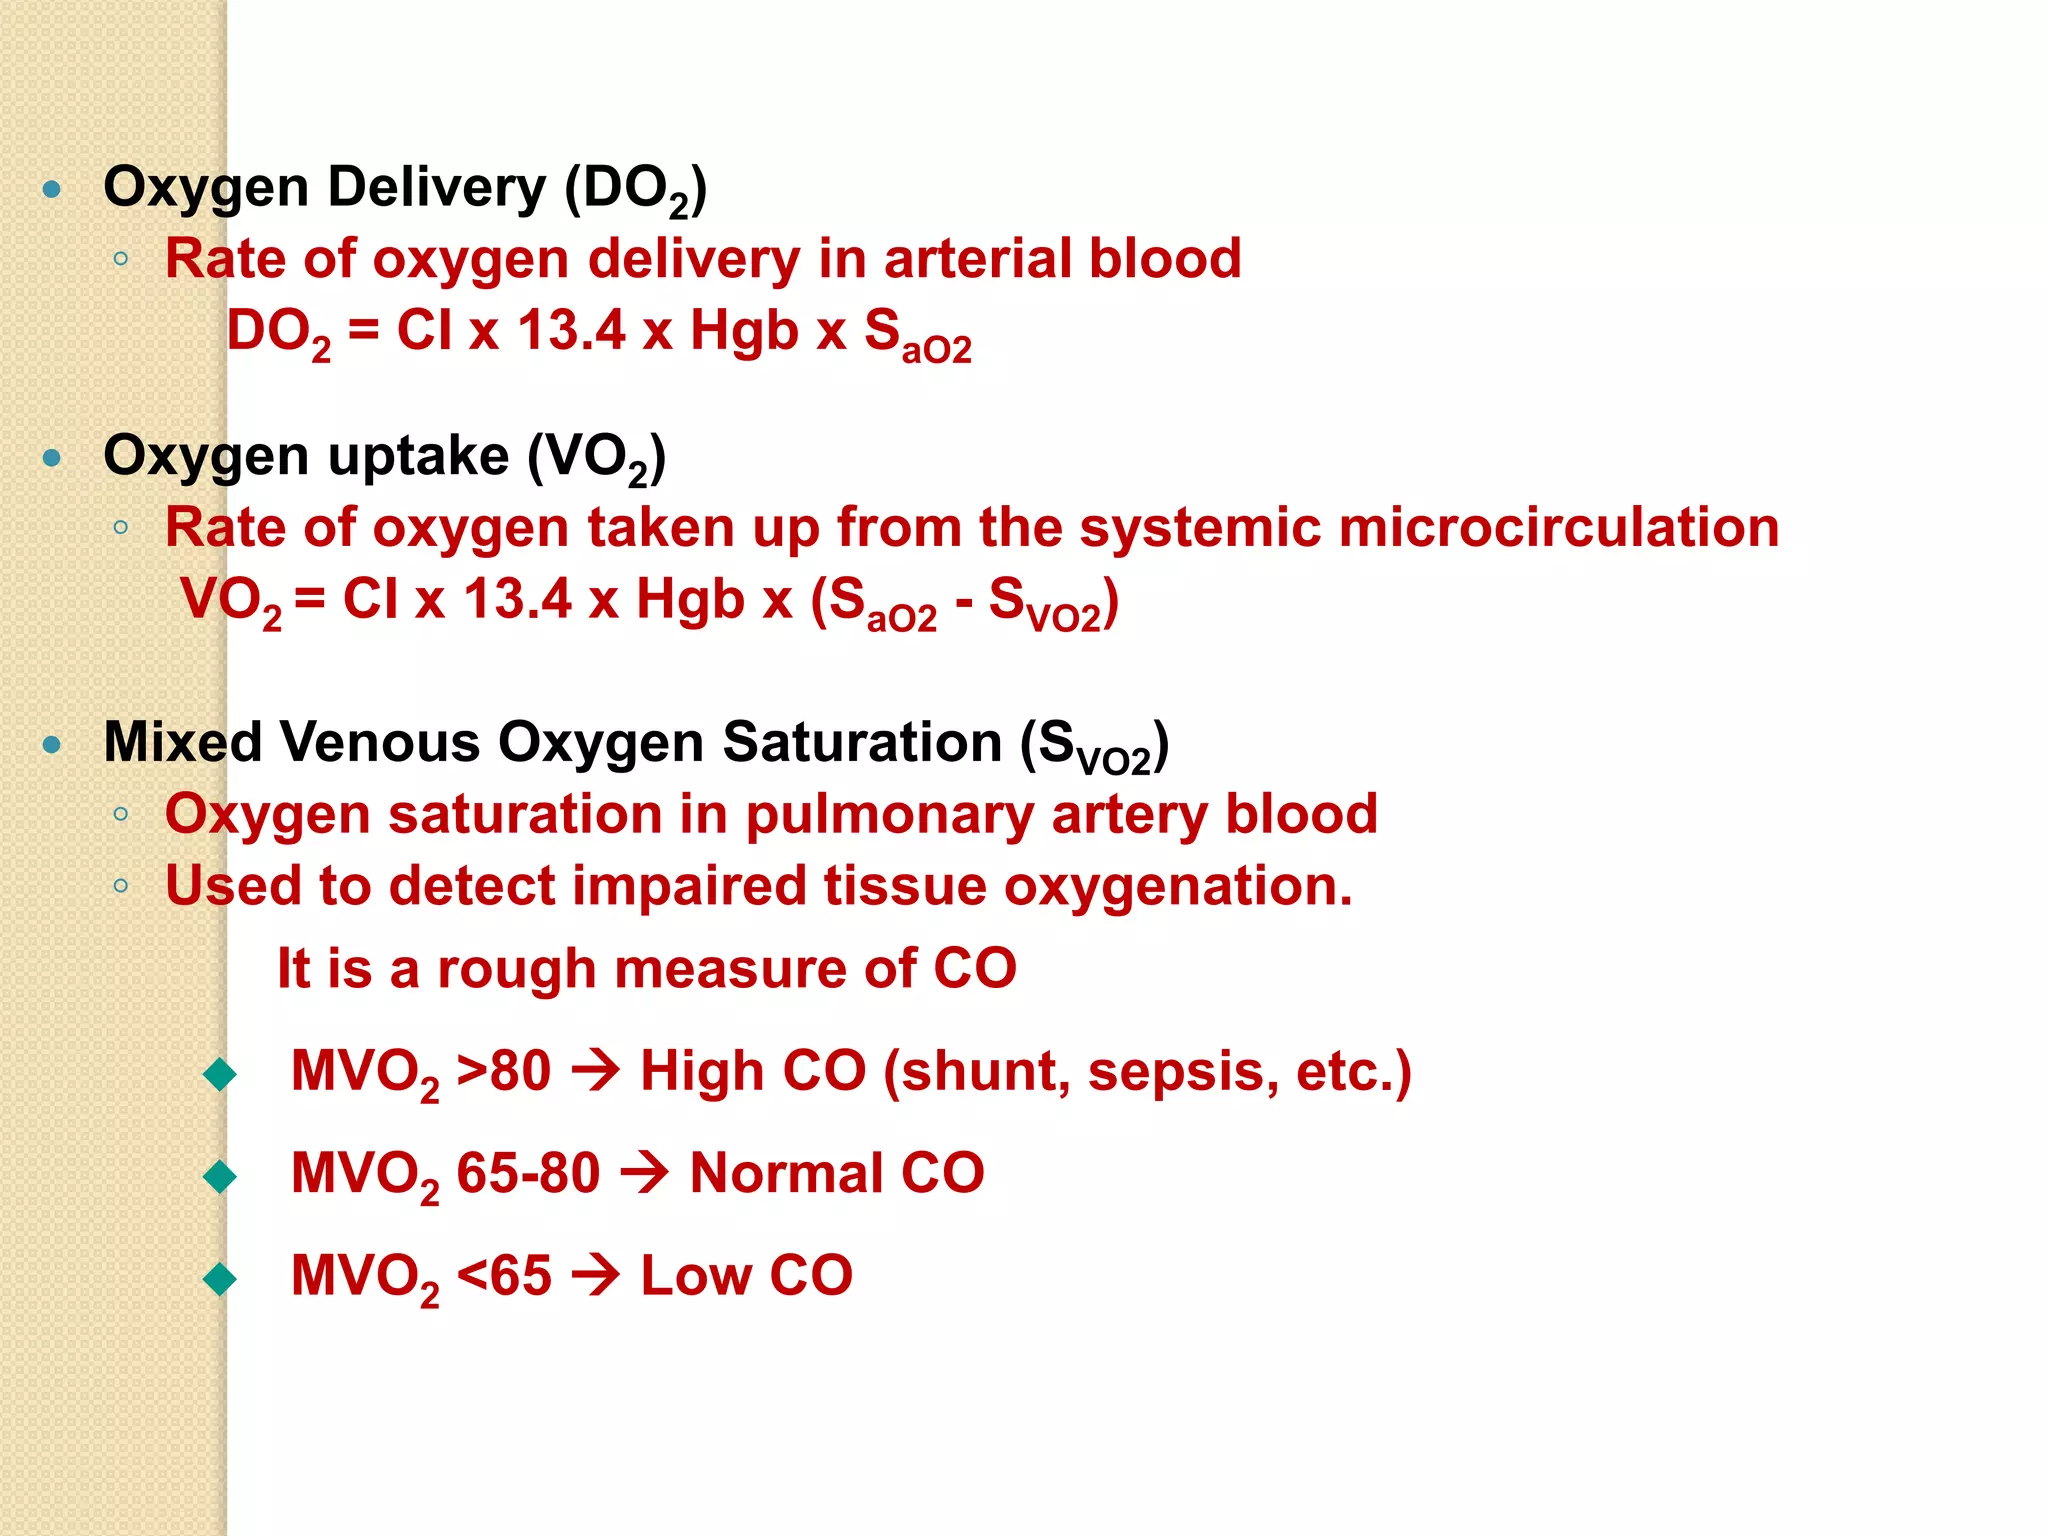
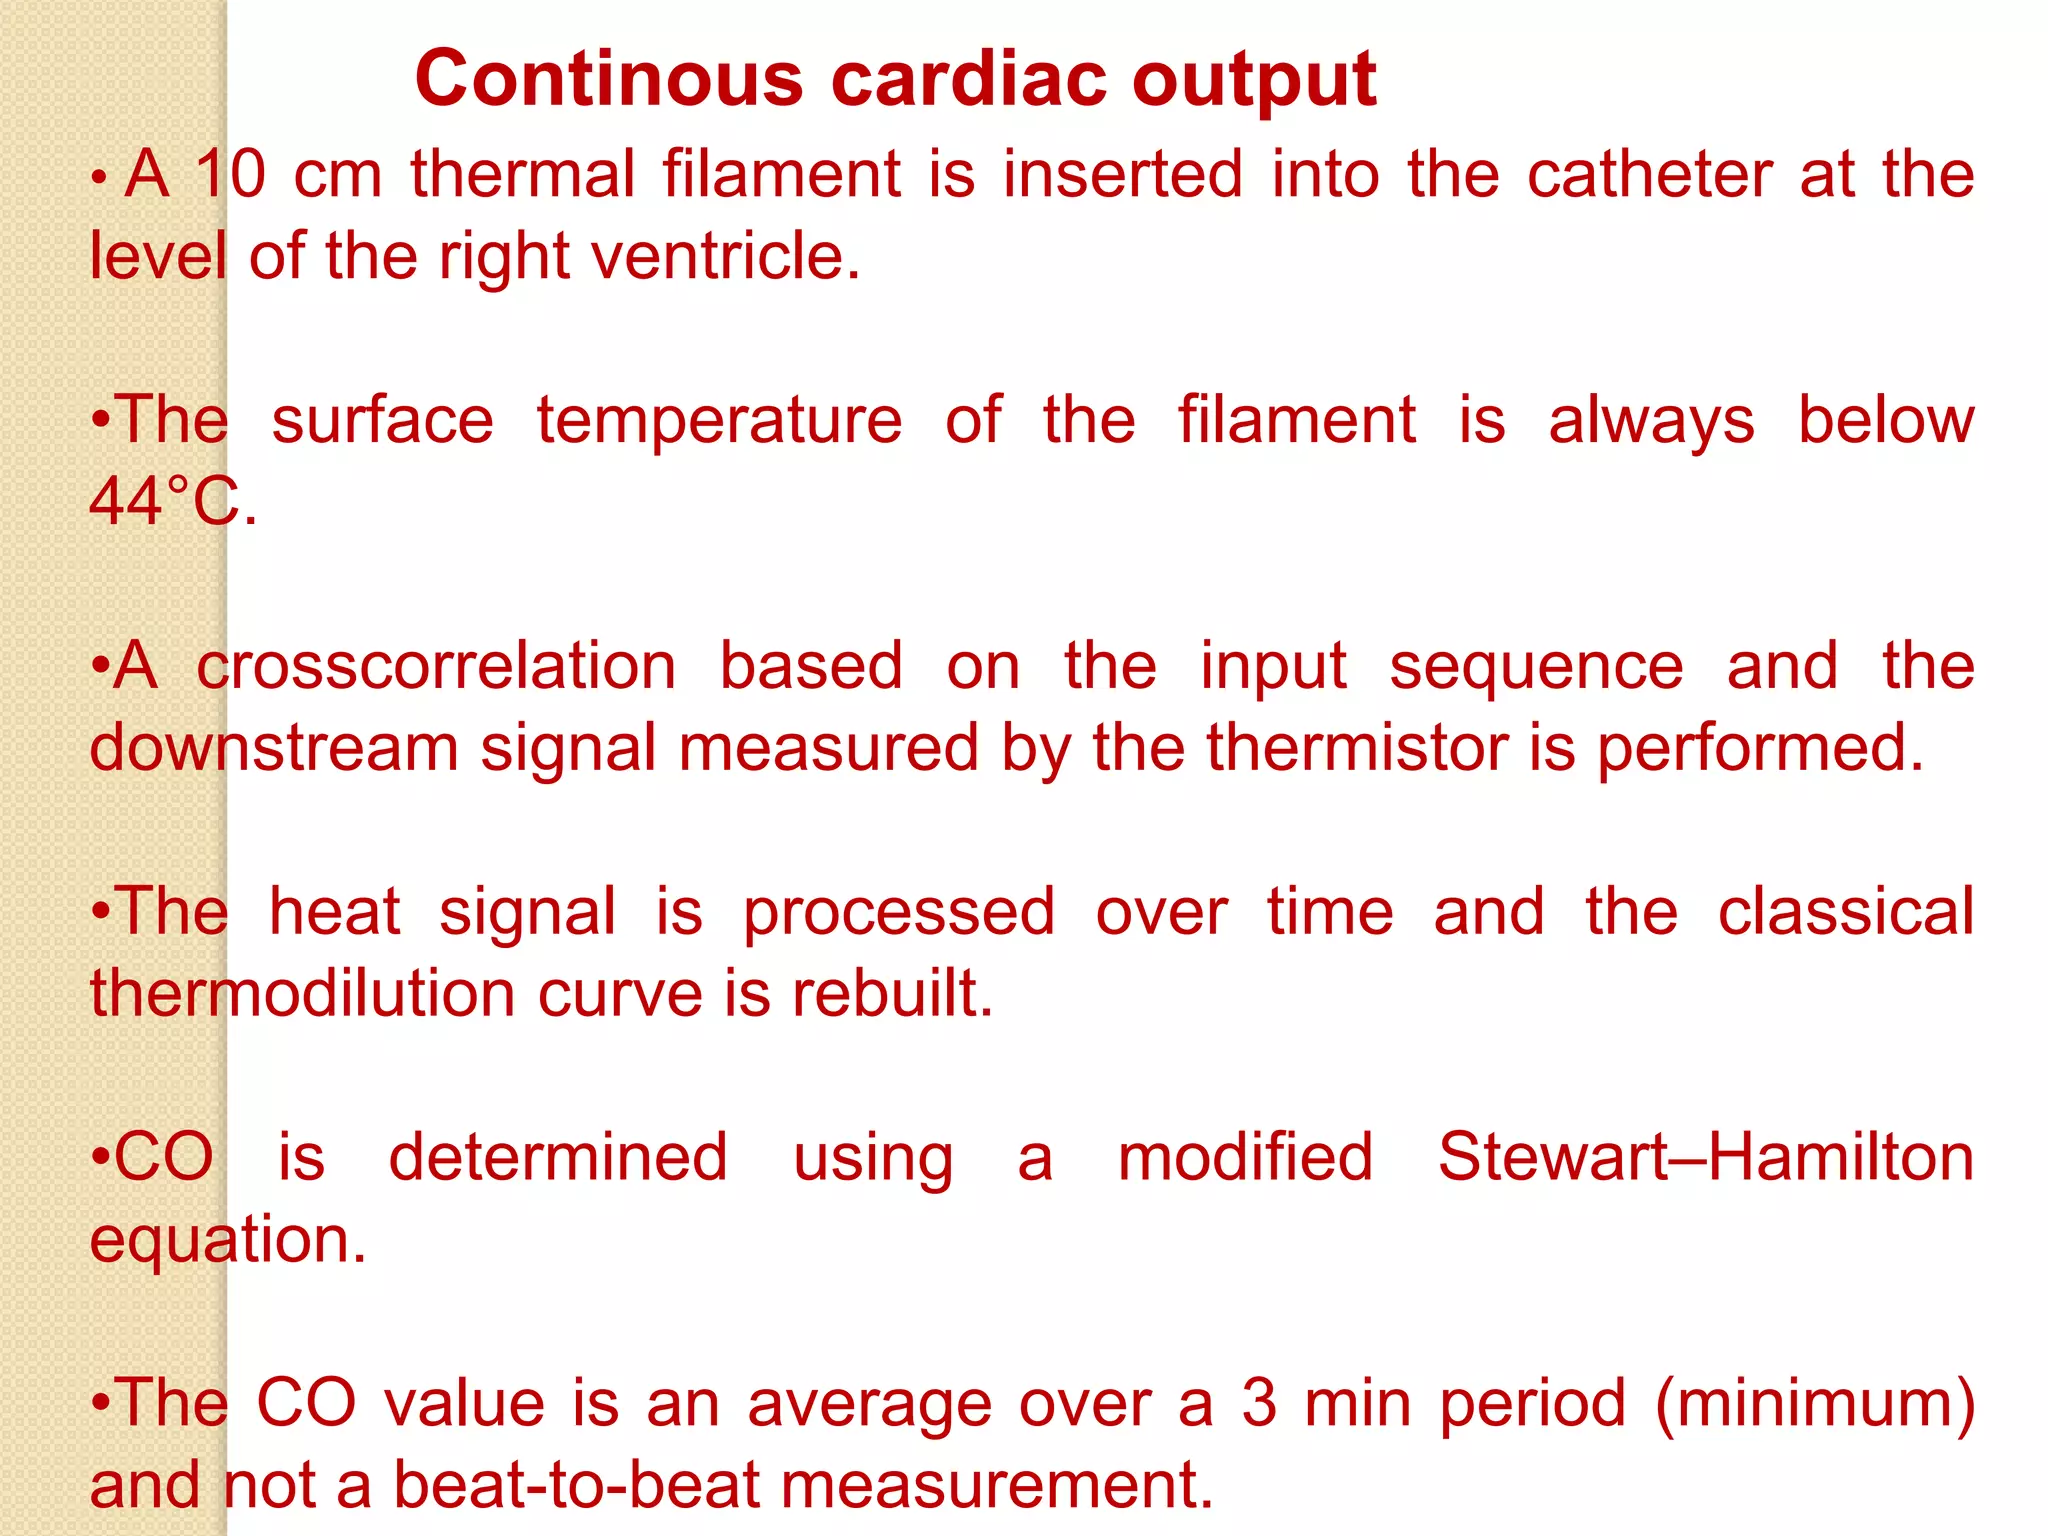
- Measurements include pressures, cardiac output via thermodilution, and derived parameters like stroke volume, vascular resistances, and oxygen transport values.
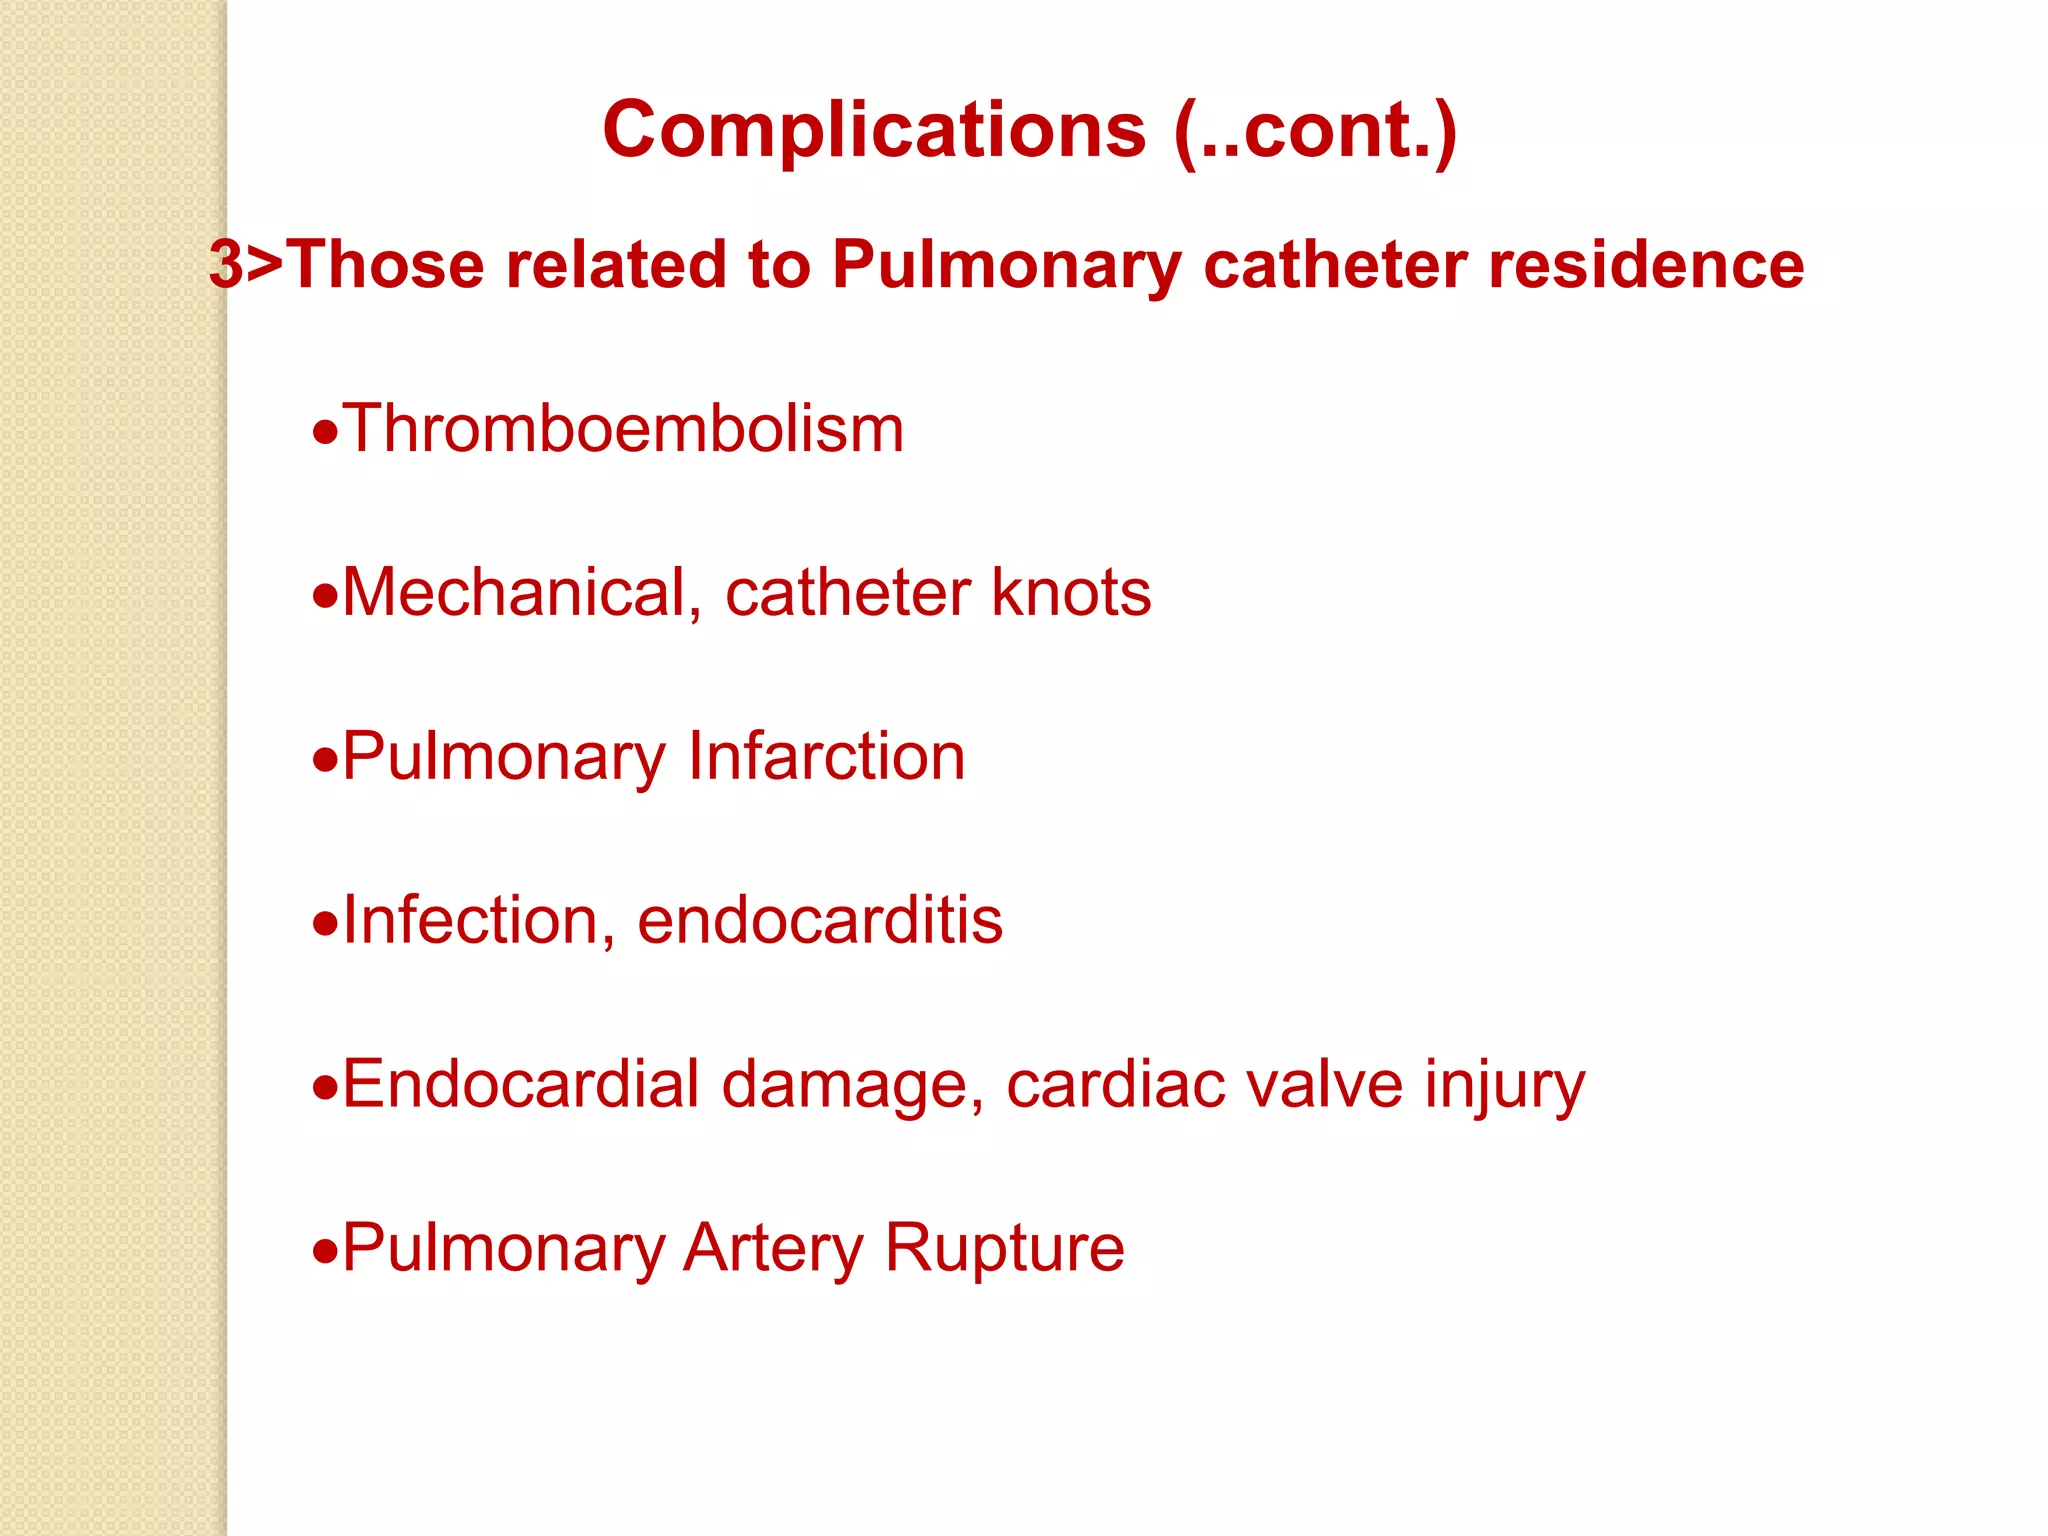
- Complications can include arrhythmias, infection, or pulmonary artery damage. Indications include