Download to read offline
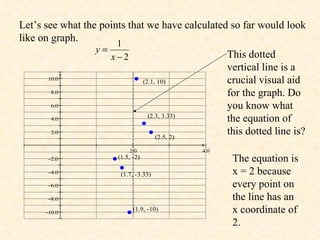
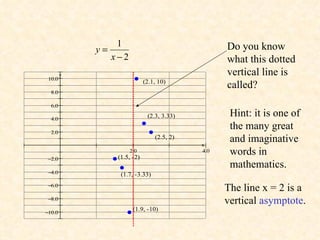
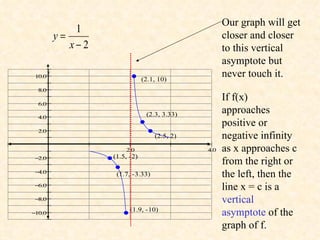
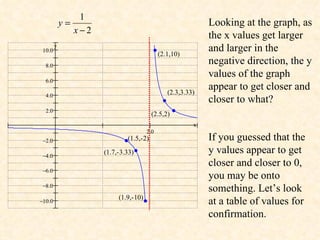
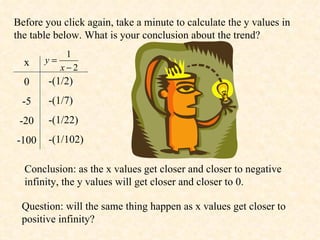
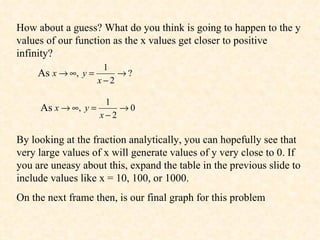
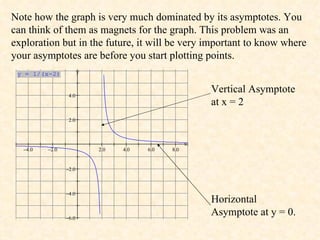
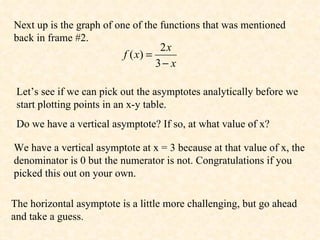
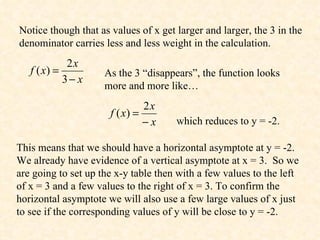
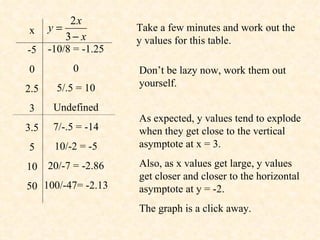
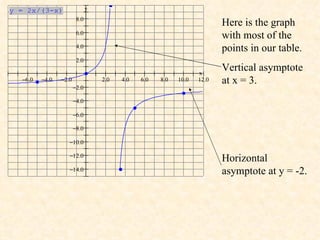
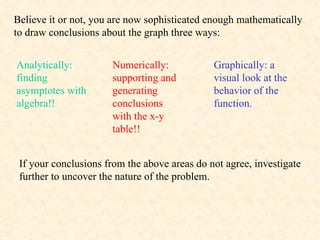
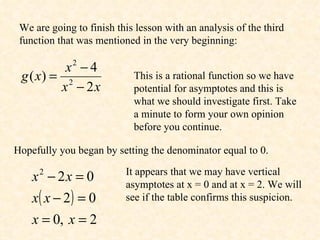
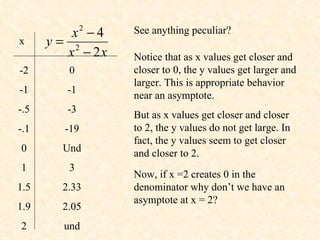
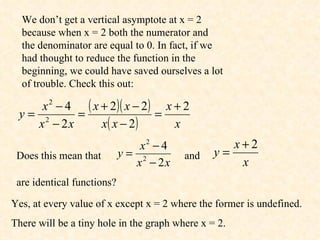
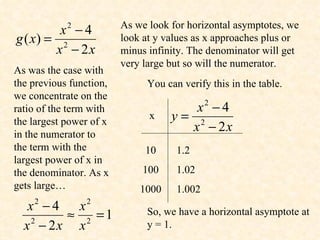
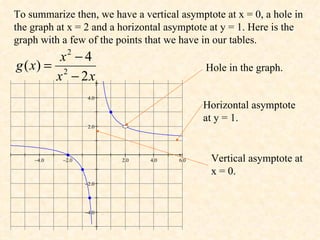
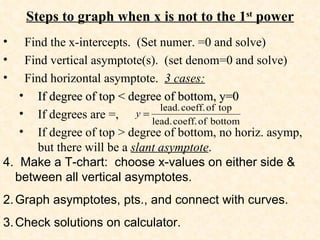

The document discusses graphs of rational functions and how to analyze them. It covers identifying vertical and horizontal asymptotes analytically by finding values where the denominator is zero or analyzing behavior as x approaches positive/negative infinity. Examples show graphing rational functions by plotting points near asymptotes and connecting them, confirming asymptotes numerically. Key steps are finding intercepts and asymptotes, making a table near asymptotes, and graphing points and asymptotes. The reader is assigned practice problems applying these skills.