Downloaded 18 times


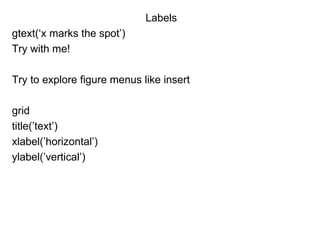
![Another form of plot to draw a line between two points:
coordinates (0, 1) and (4, 3)
plot([0 4], [1 3])
Also has set of easy to use plot commands called ezplot
Eg ezplot(‘tan(x)’)
ezplot(‘cos(x))
ezplot(‘x^2’)](https://image.slidesharecdn.com/matlabgraphics-120429132234-phpapp01/85/Matlab-graphics-4-320.jpg)
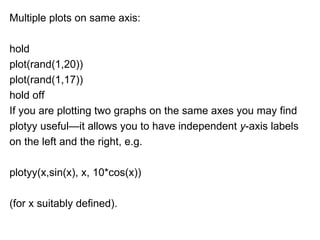
![Axis limits
axis( [xmin, xmax, ymin, ymax] )
Go home try to find out on internet abt other axis commands
Multiple plots in figure](https://image.slidesharecdn.com/matlabgraphics-120429132234-phpapp01/85/Matlab-graphics-8-320.jpg)
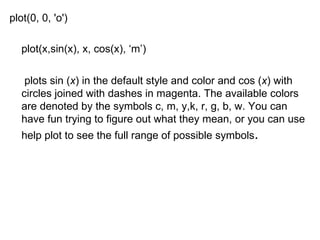
![Plotting rapidly changing mathematical function
x = 0.01:.001:.1;
plot(x, sin(1./x))
.001 ki jagah .0001 daliye graphs significantly alag hai
Instead of this use fplot
fplot('sin(1/x)', [0.01 0.1])](https://image.slidesharecdn.com/matlabgraphics-120429132234-phpapp01/85/Matlab-graphics-10-320.jpg)
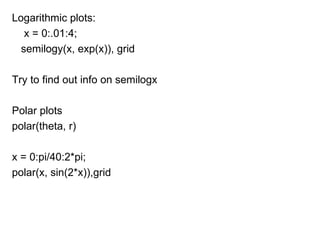
![Mesh surfaces
z =x^2 –y^2
0<=x<=5 and 0<=y<=5
[x,y] =meshgrid(0:5)
z = x.^2 - y.^2
mesh(x,y,z)
Now type
surf(x,y,z)
See what happens](https://image.slidesharecdn.com/matlabgraphics-120429132234-phpapp01/85/Matlab-graphics-12-320.jpg)


Graphics in MATLAB allow visualization of data in 2D and 3D plots. Common 2D plot commands include plot to graph vectors against each other, and ezplot for simple functions. Labels, titles, legends and grids can be added. Multiple graphs can be plotted on the same axes using hold. Logarithmic and polar plots are also possible. 3D plots include plot3 to connect points in space and mesh/surf to visualize surfaces.