Download to read offline
![Teaching Basic Modeling Skills Using Real Data Steven Gordon Senior Director of Education and Client Services [email_address]](https://image.slidesharecdn.com/gordoncorr-1226586660860181-8/85/Gordoncorr-1-320.jpg)
![Teaching Basic Modeling Skills Using Real Data Steven Gordon Senior Director of Education and Client Services [email_address]](https://image.slidesharecdn.com/gordoncorr-1226586660860181-8/75/Gordoncorr-1-2048.jpg)
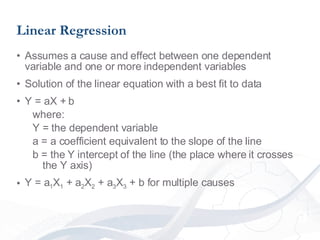
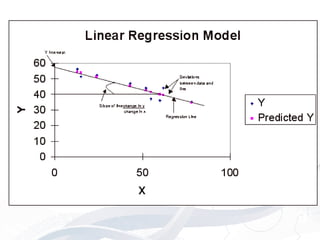
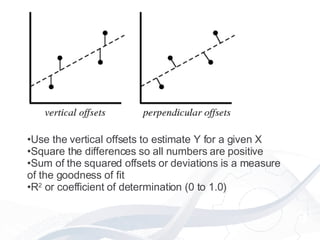
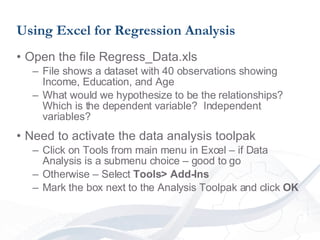
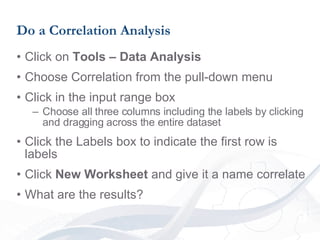
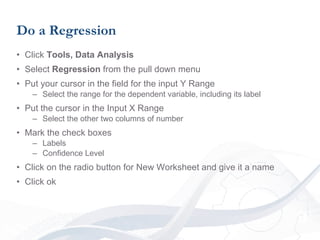
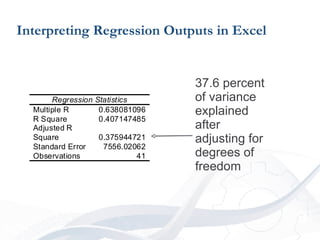
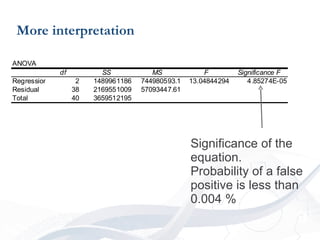
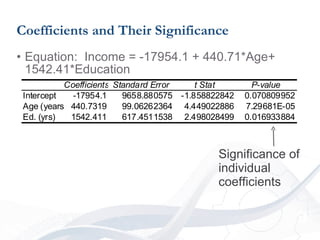
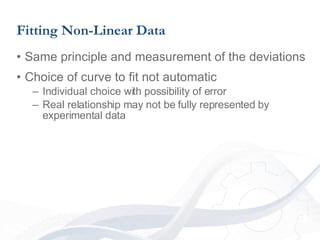

This document provides an overview of statistical modeling techniques using real data, including correlation, linear regression, and interpreting regression outputs in Excel. It discusses measuring the strength of relationships between variables, using linear regression to find relationships between a dependent variable and independent variables, and how to perform correlation and regression analyses in Excel using a sample dataset with income, education and age variables. Potential errors in modeling are also noted.


