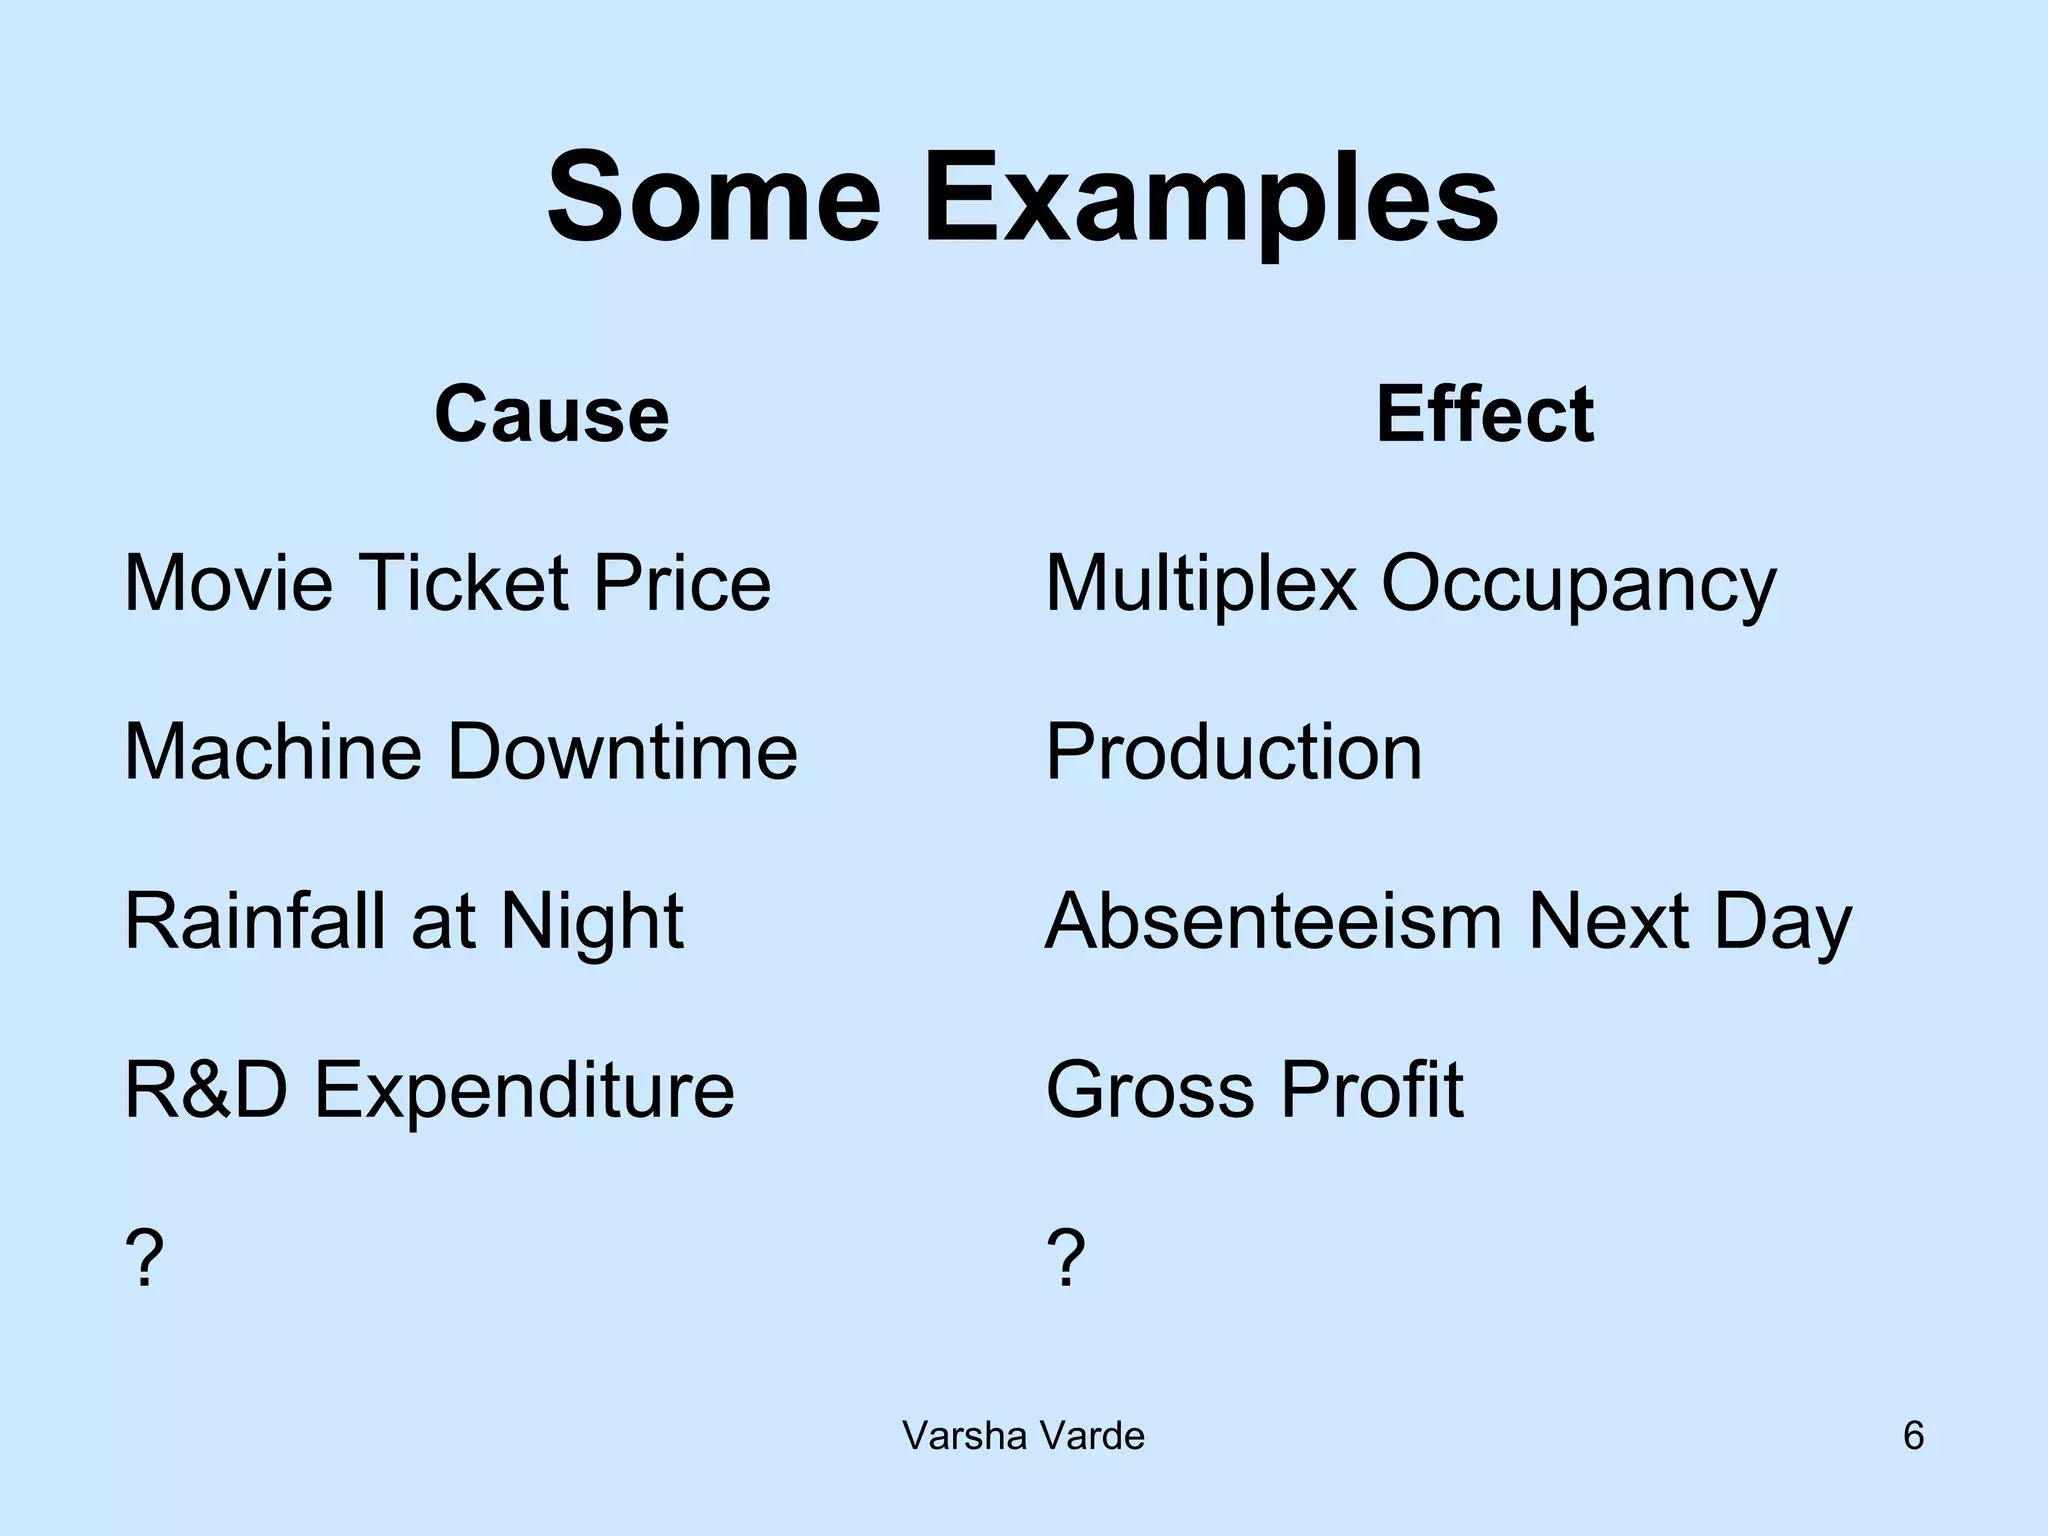
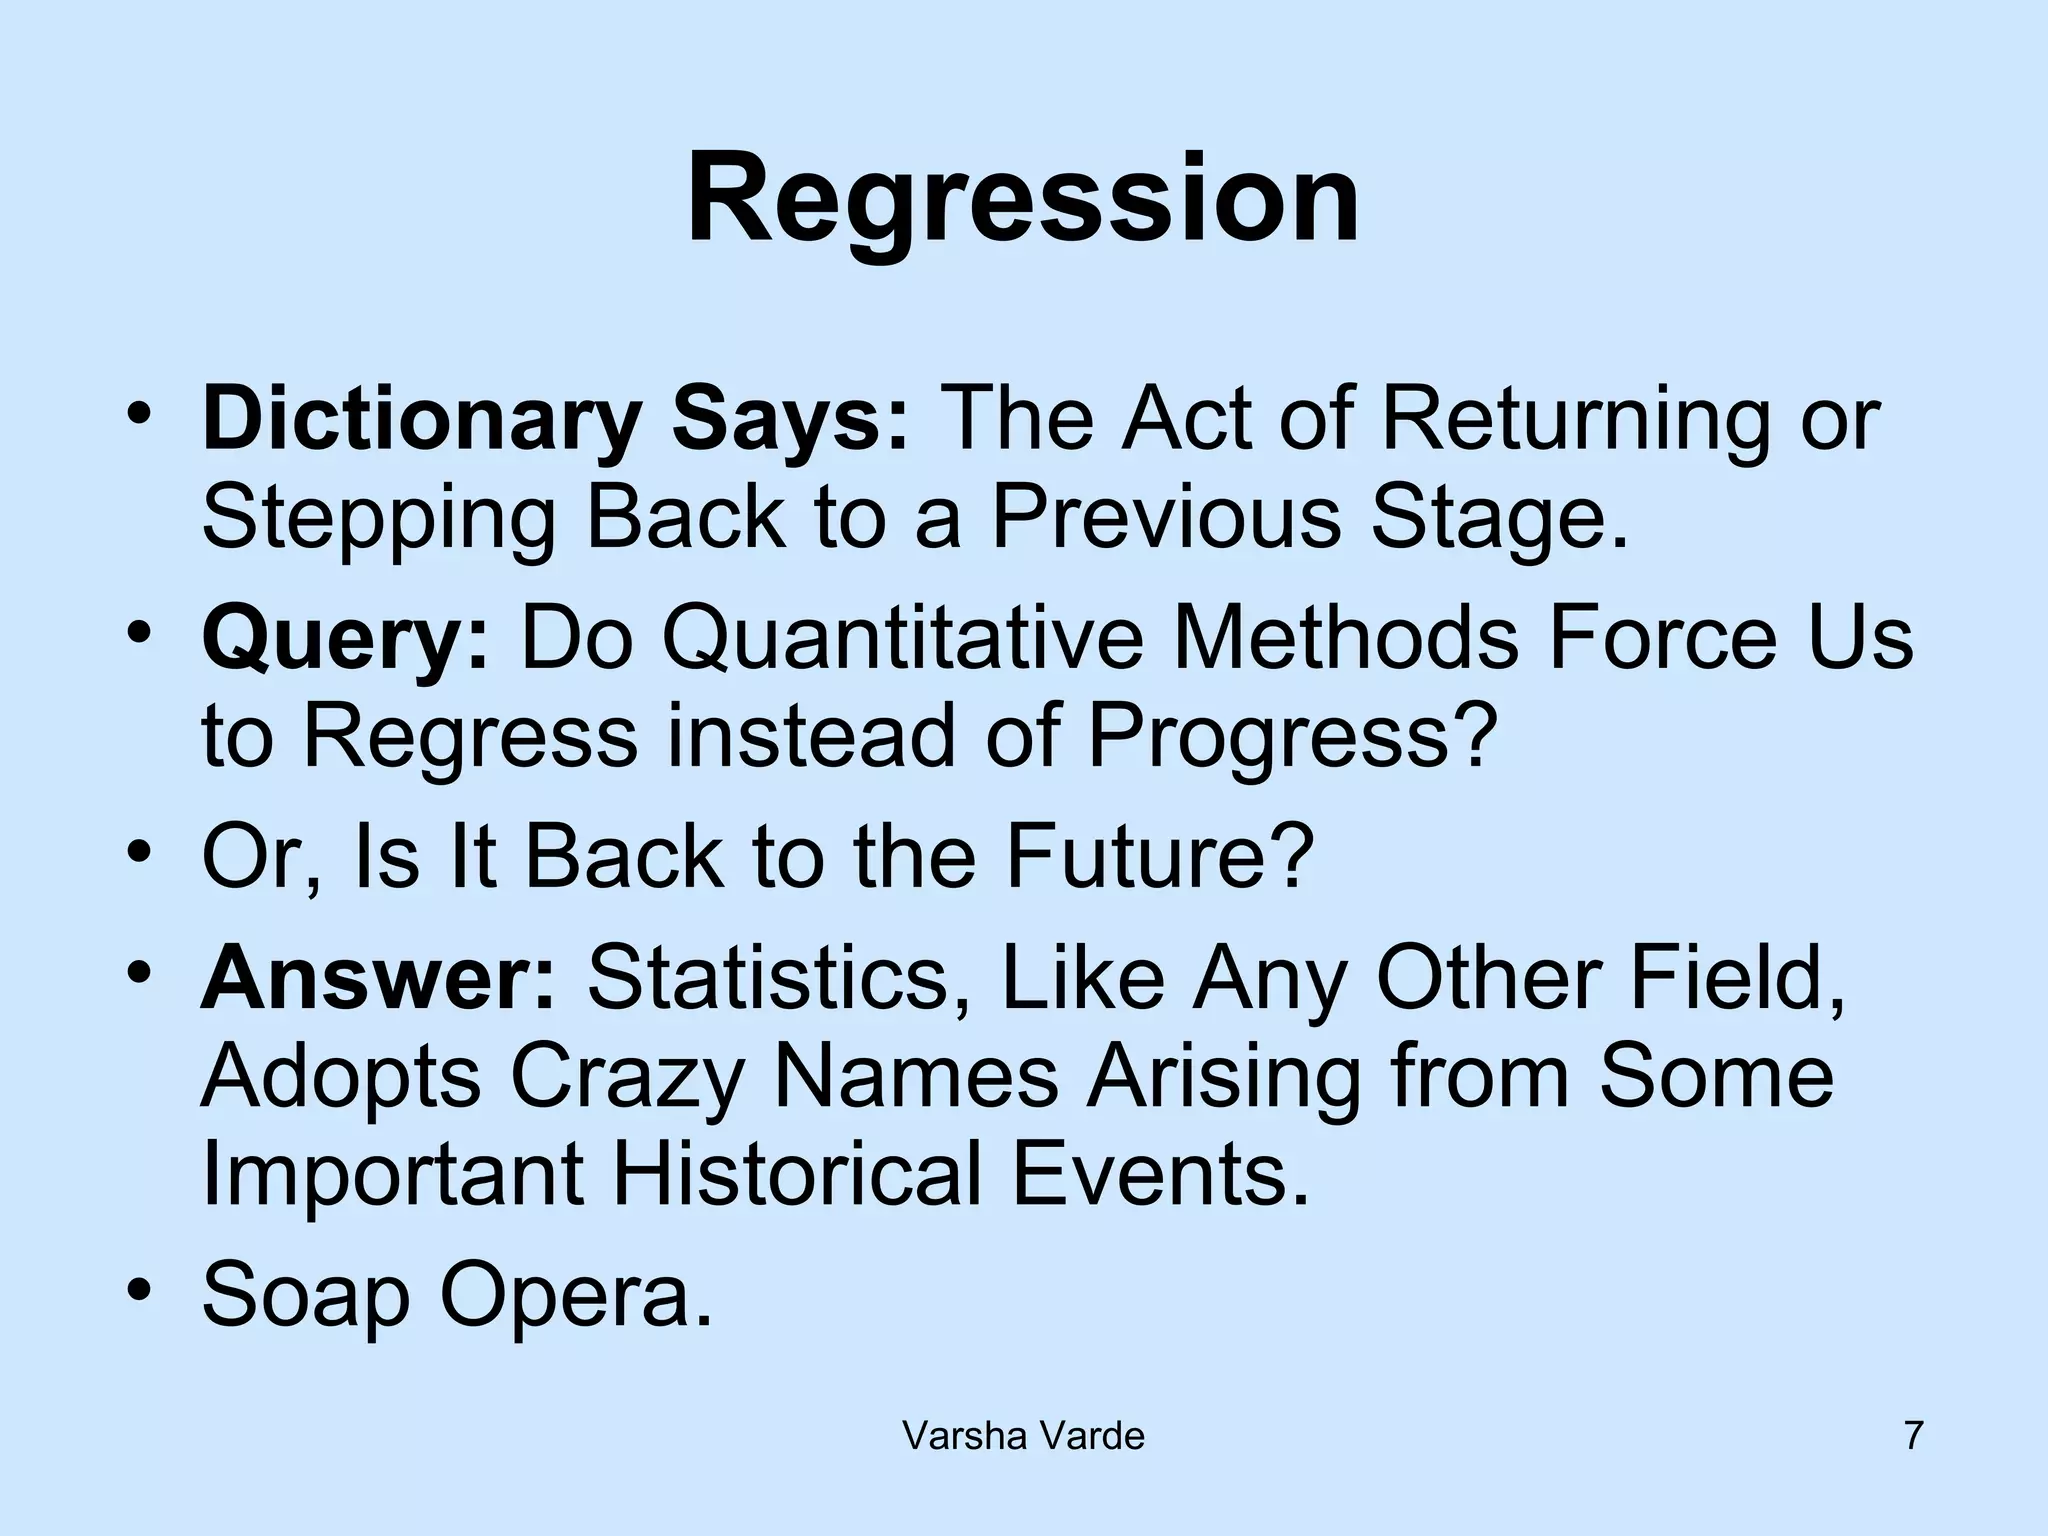
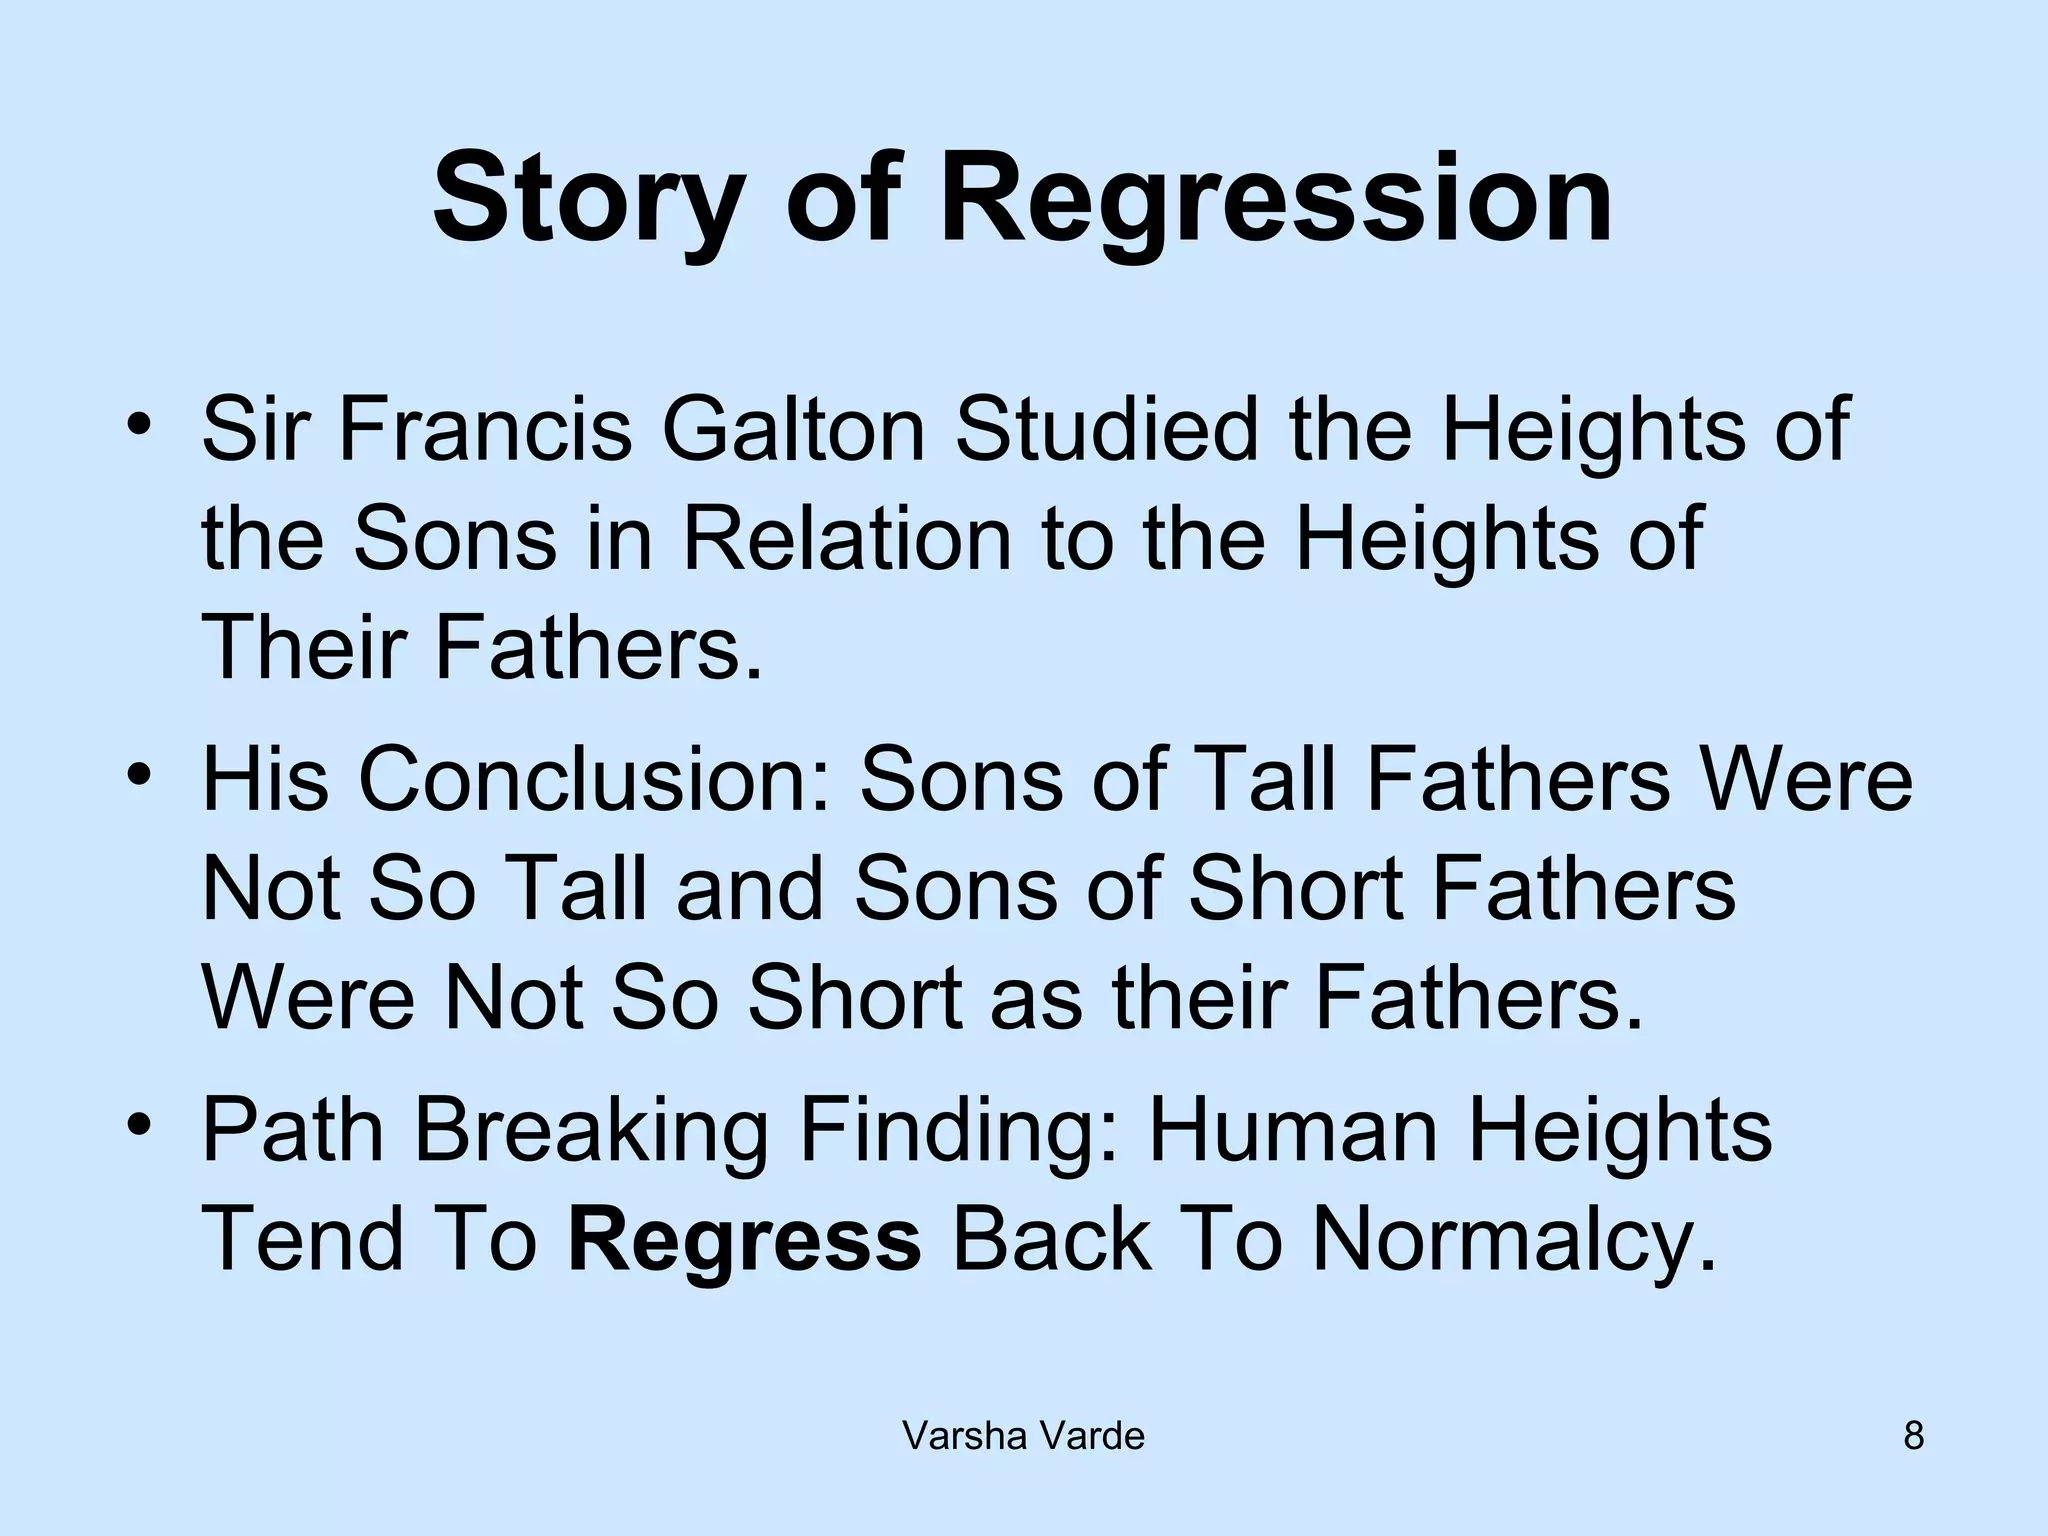
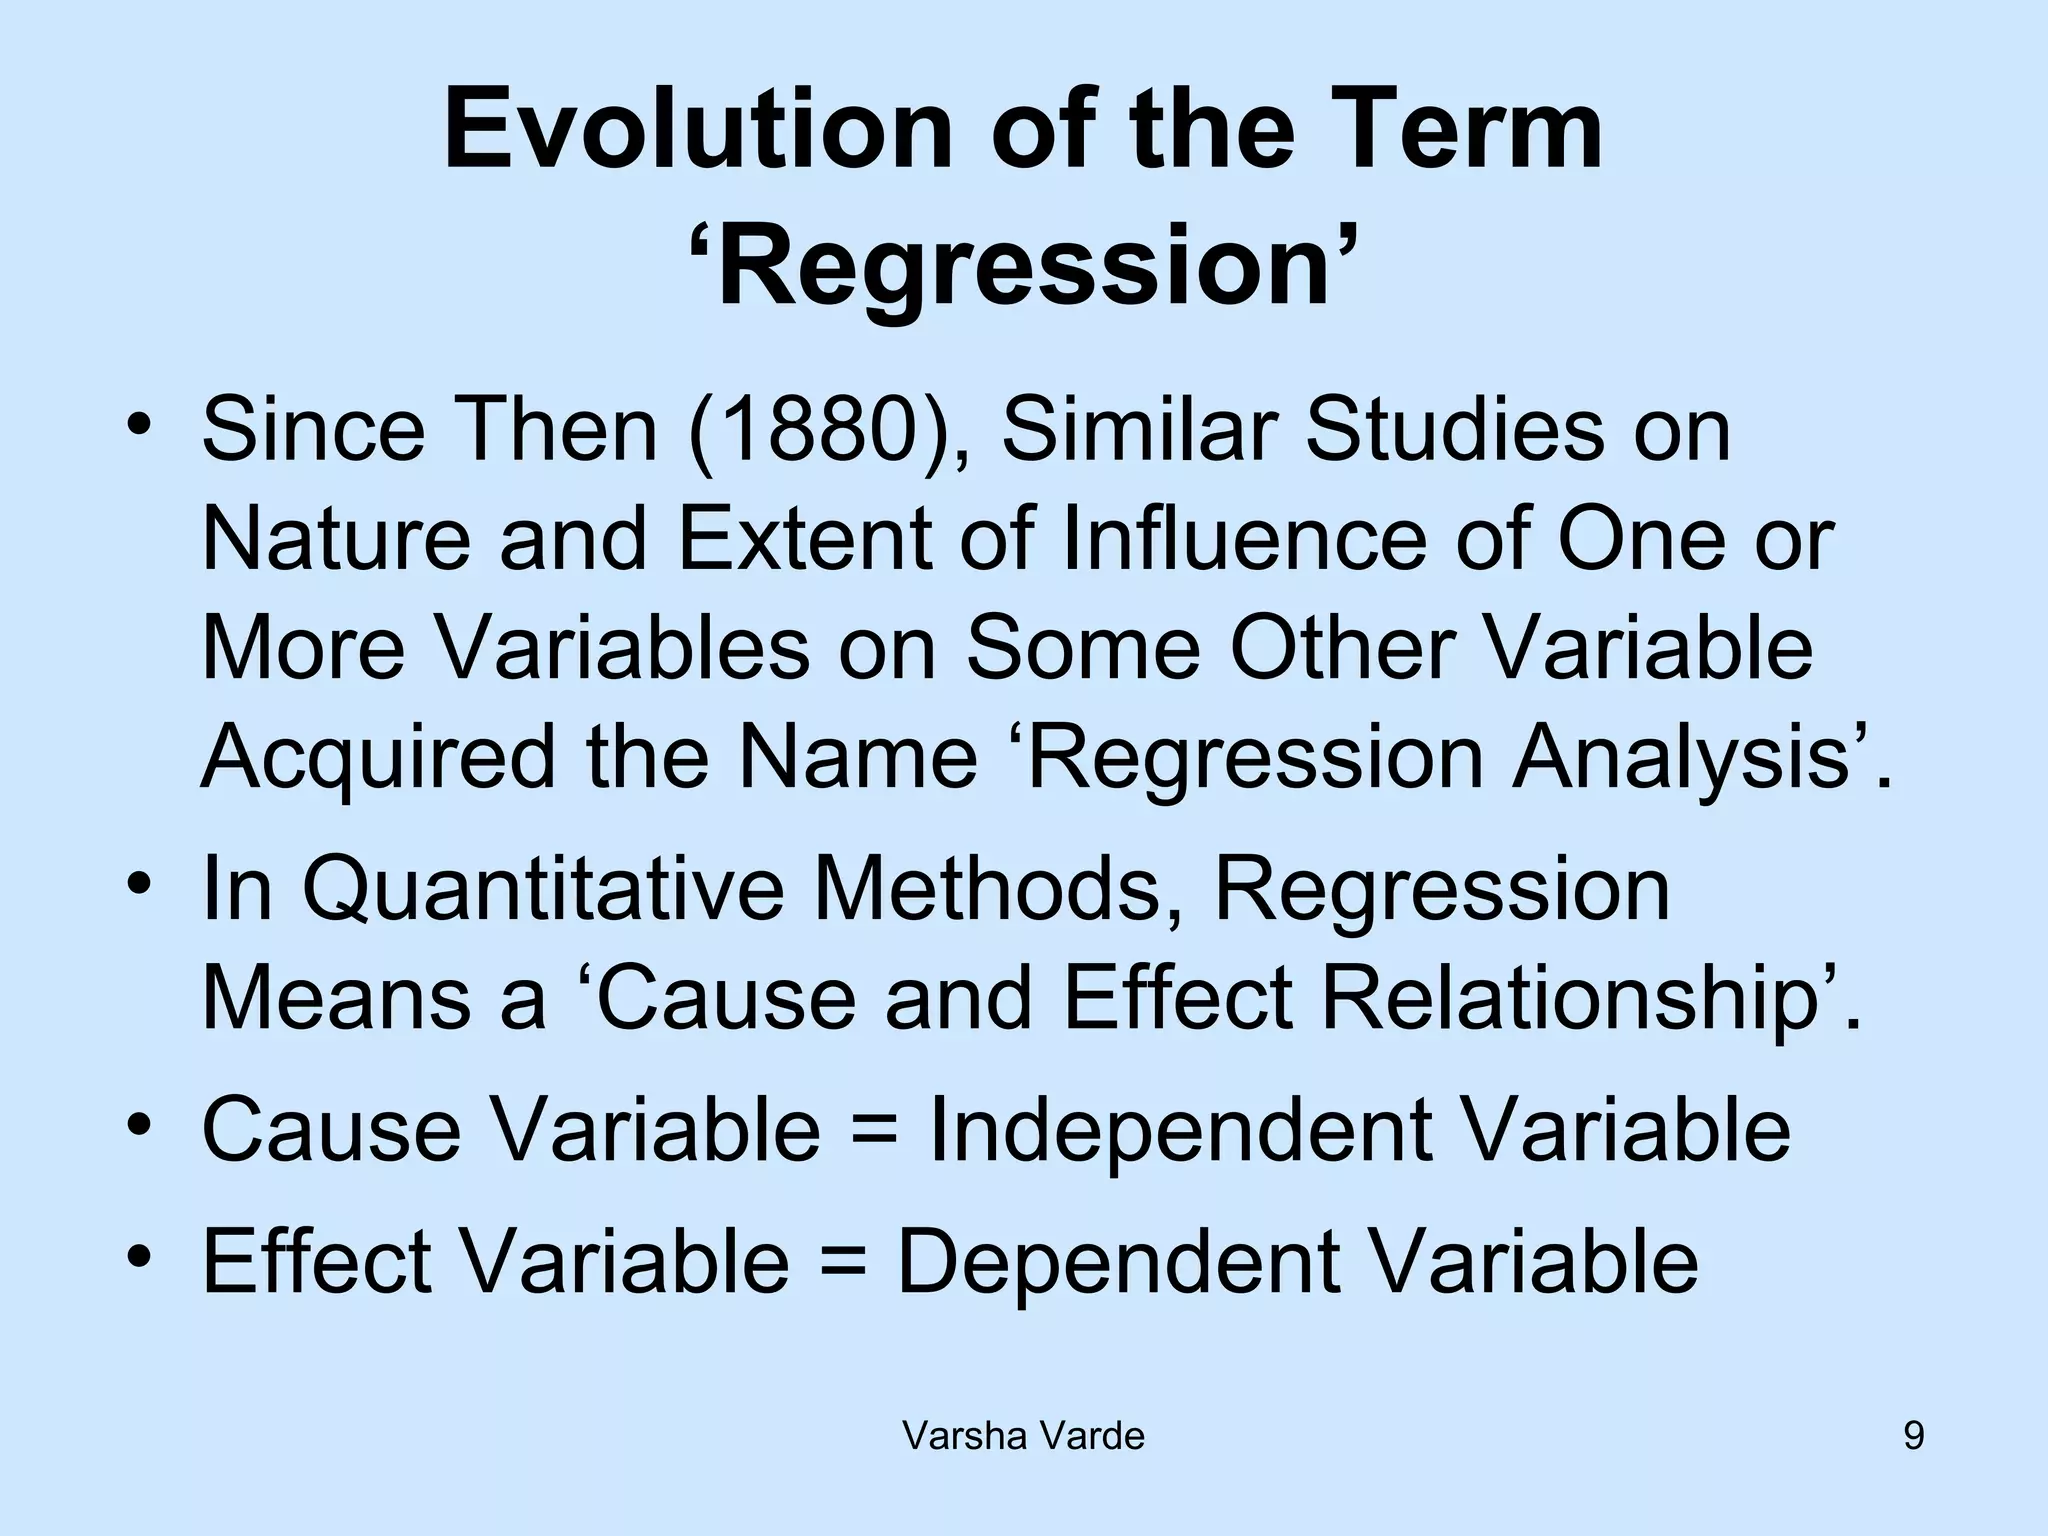
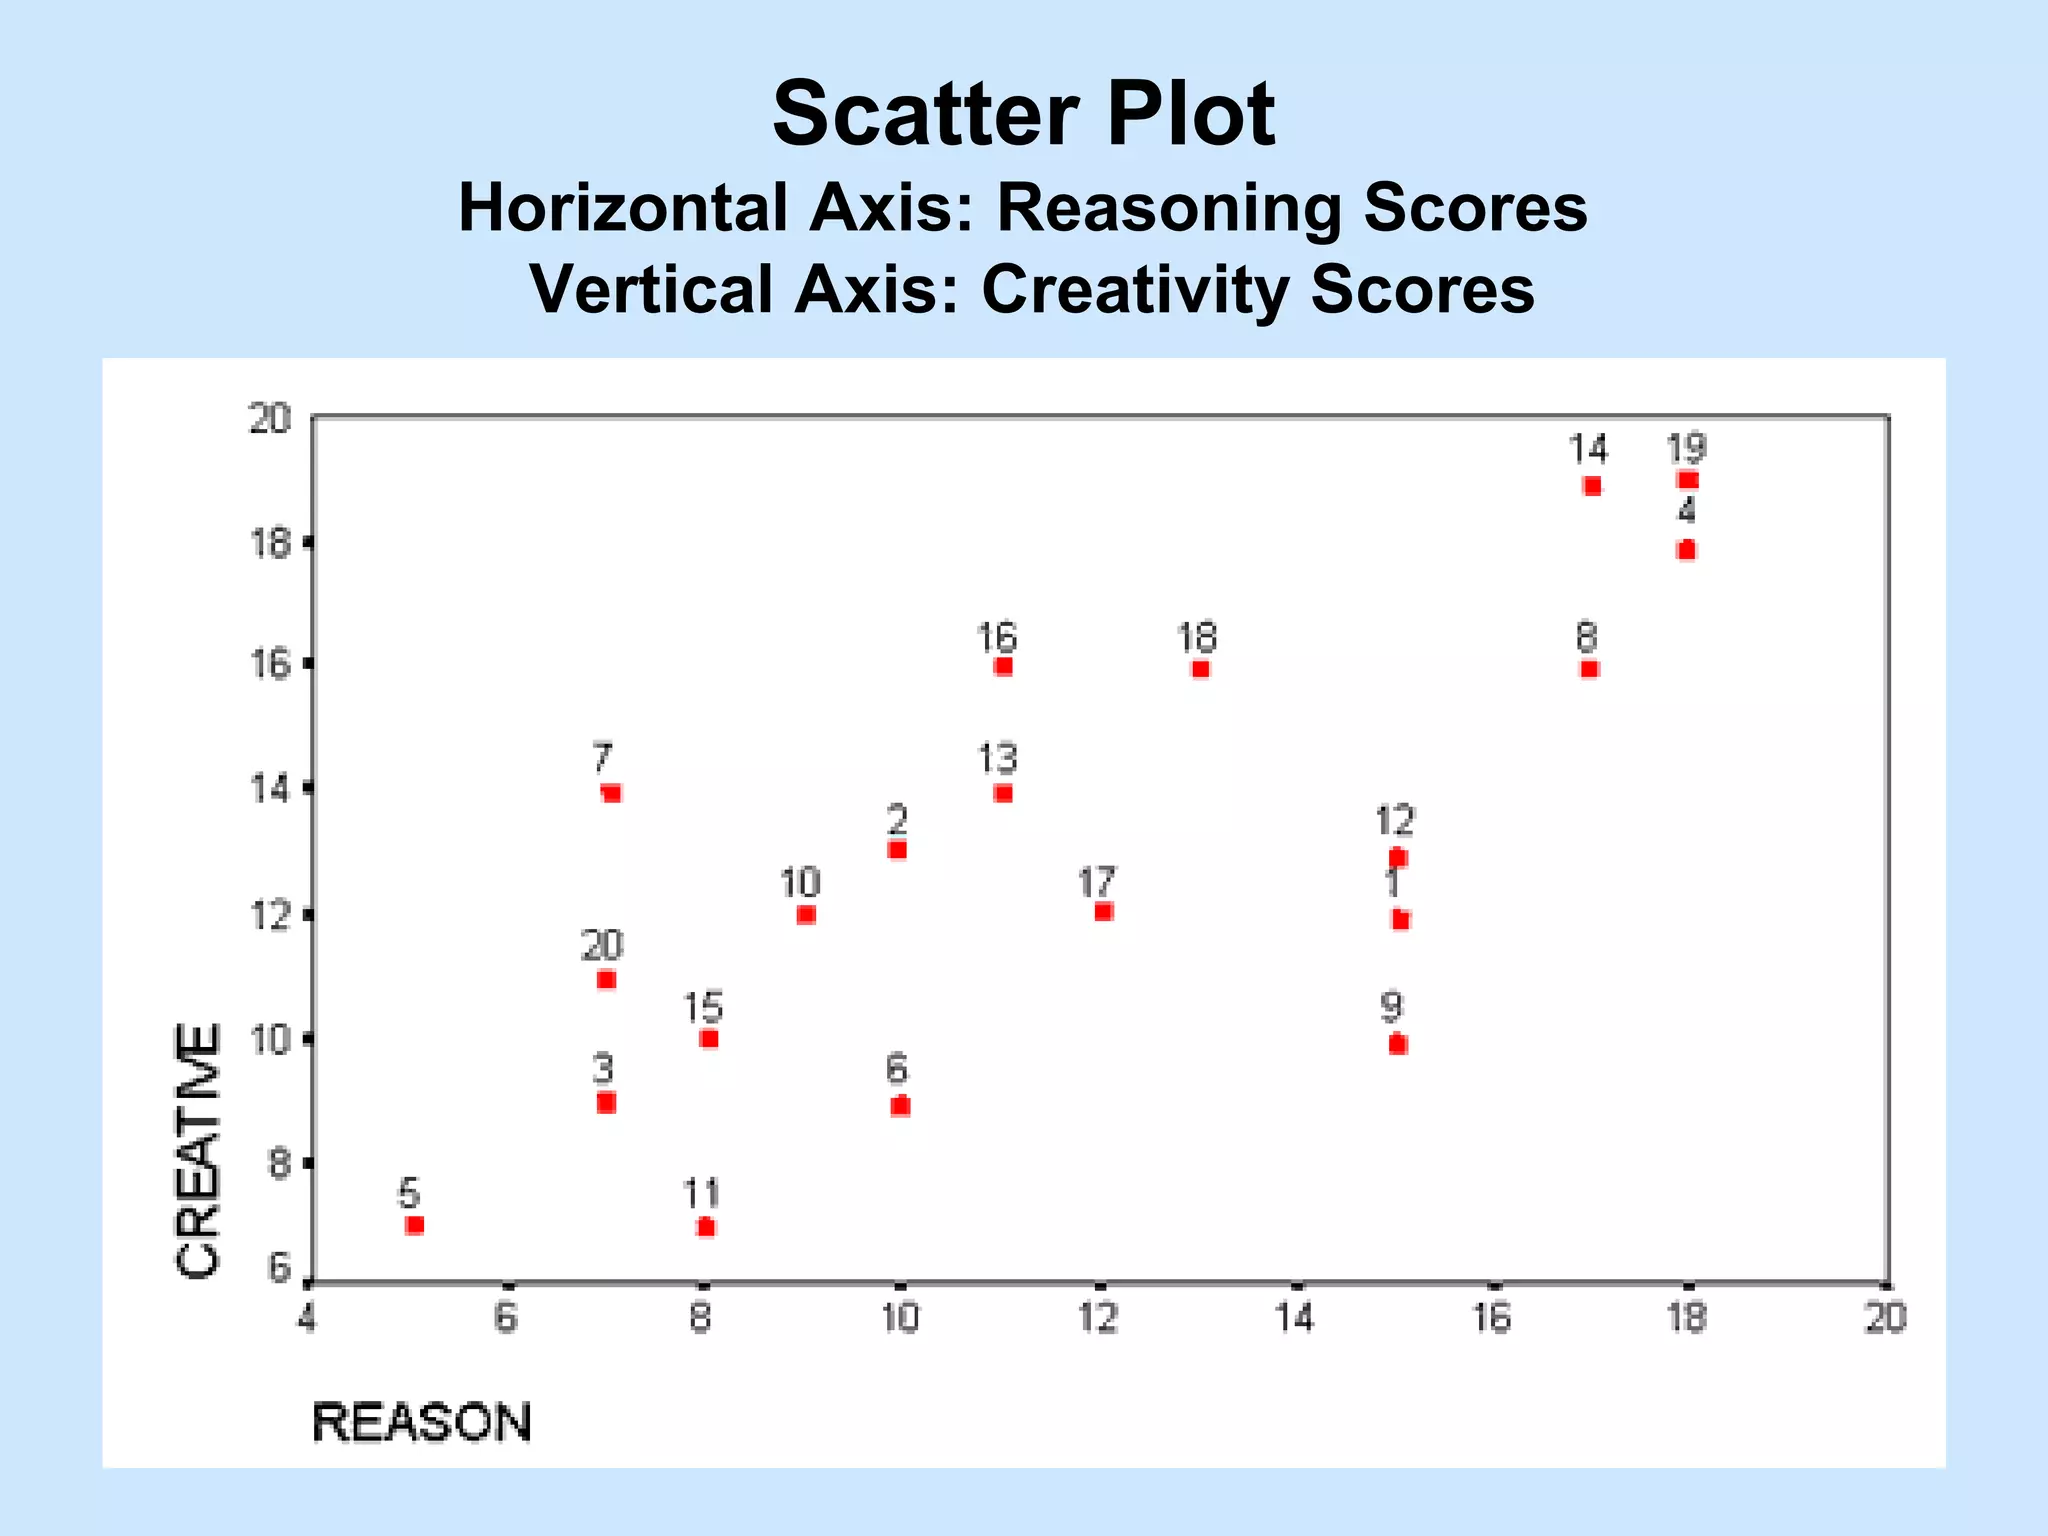
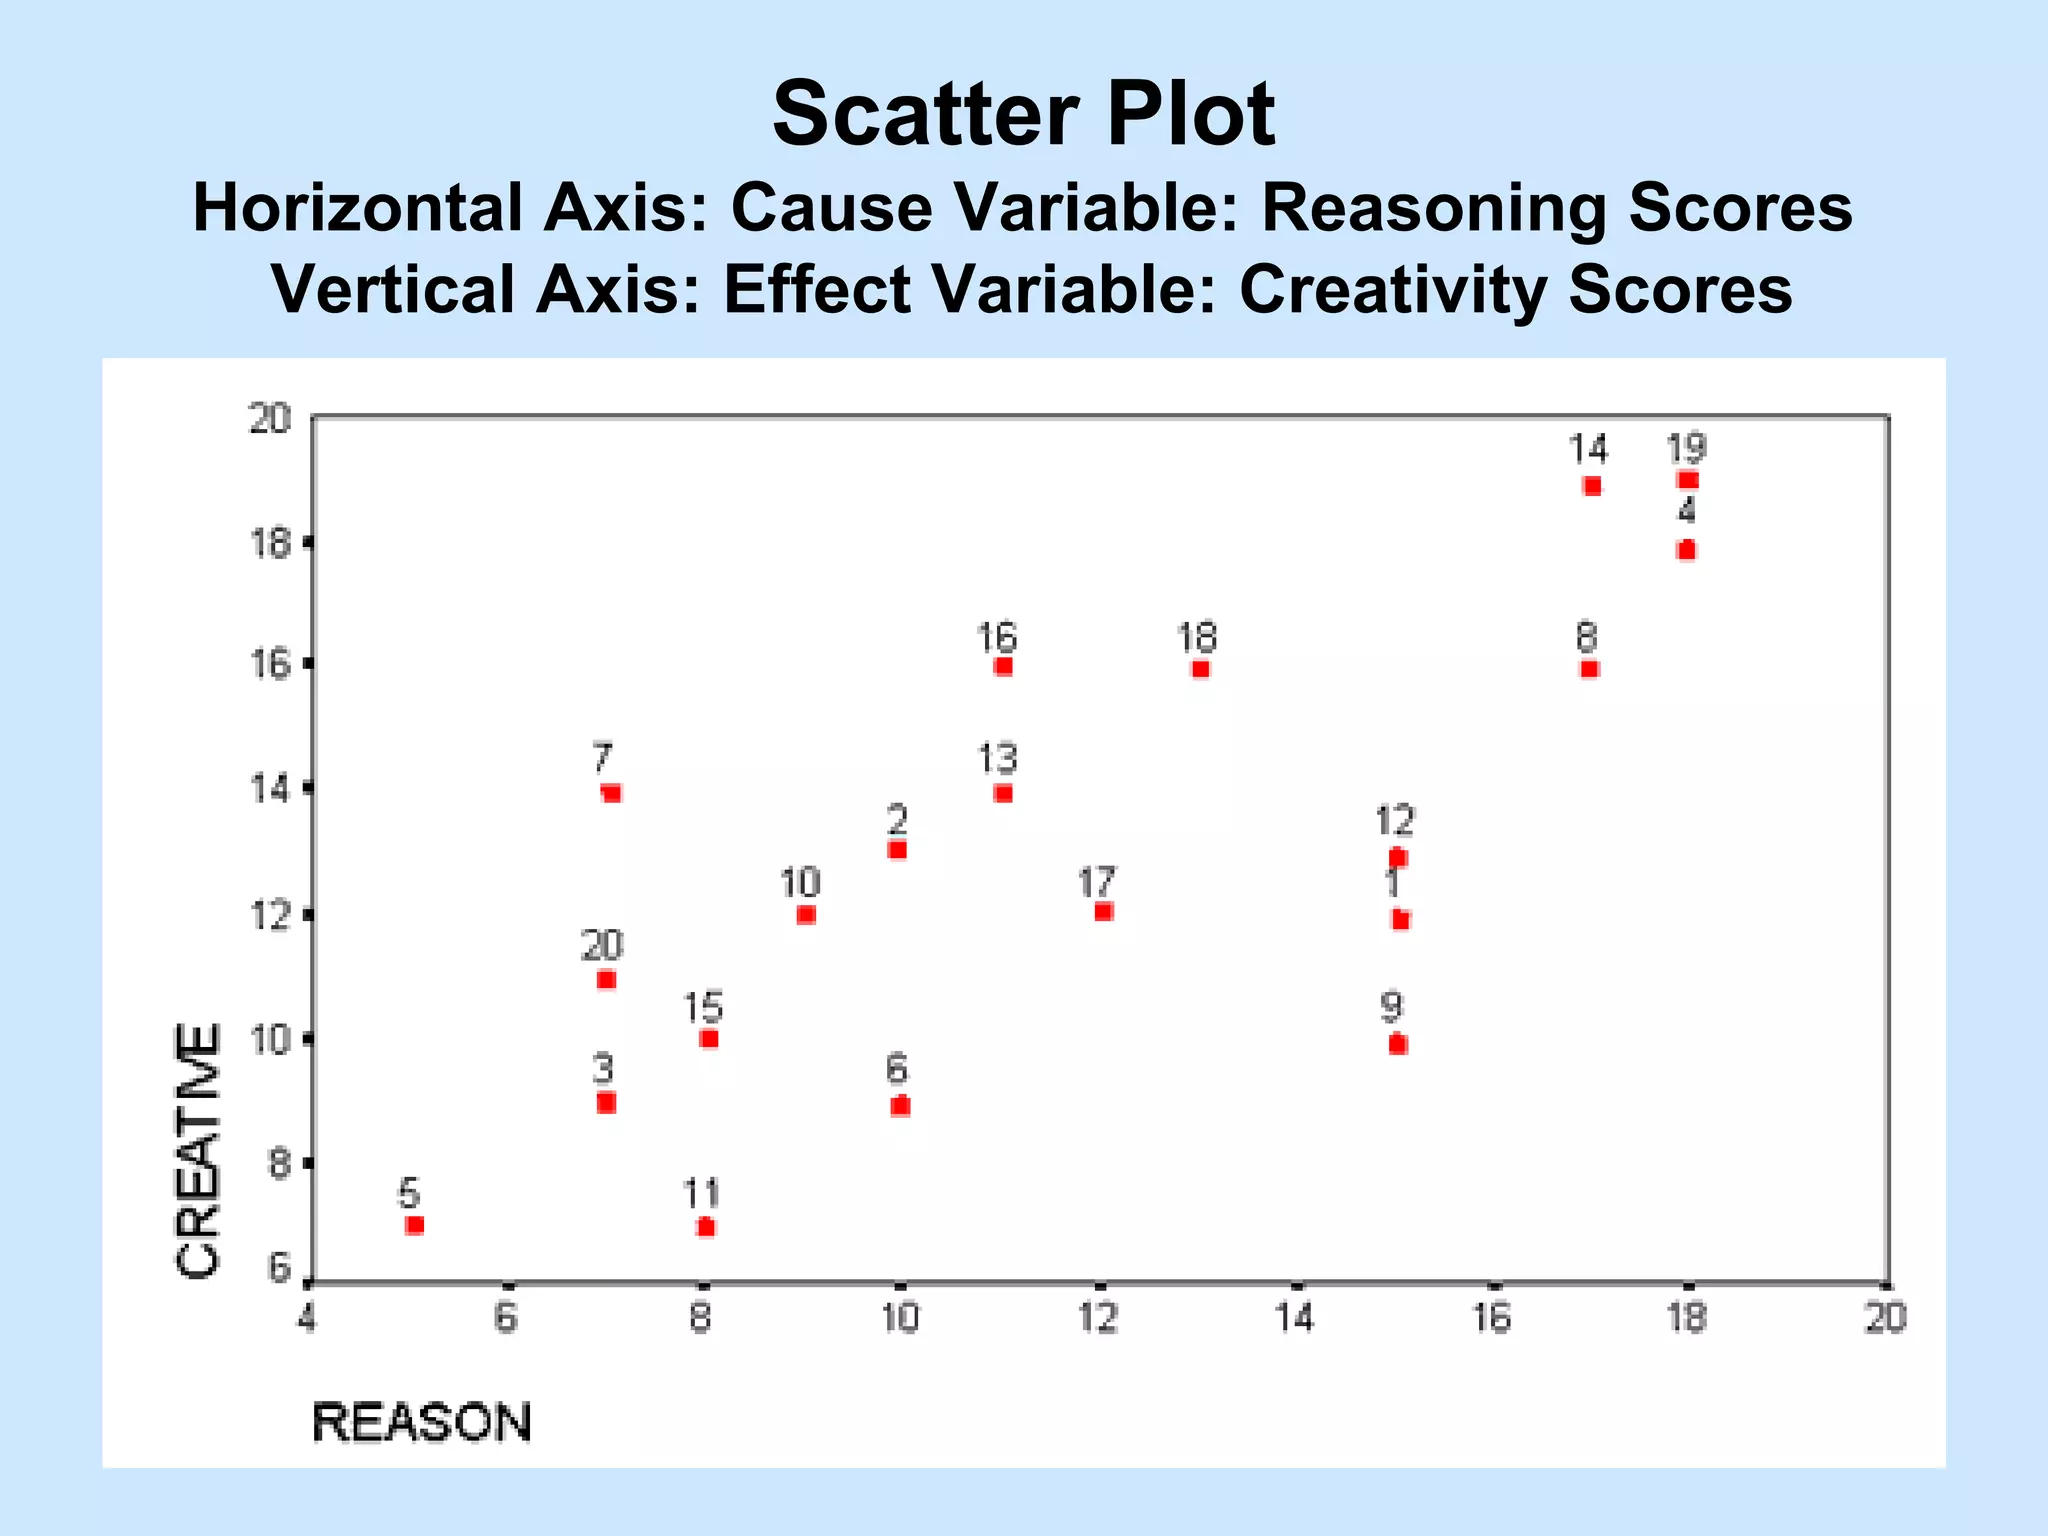
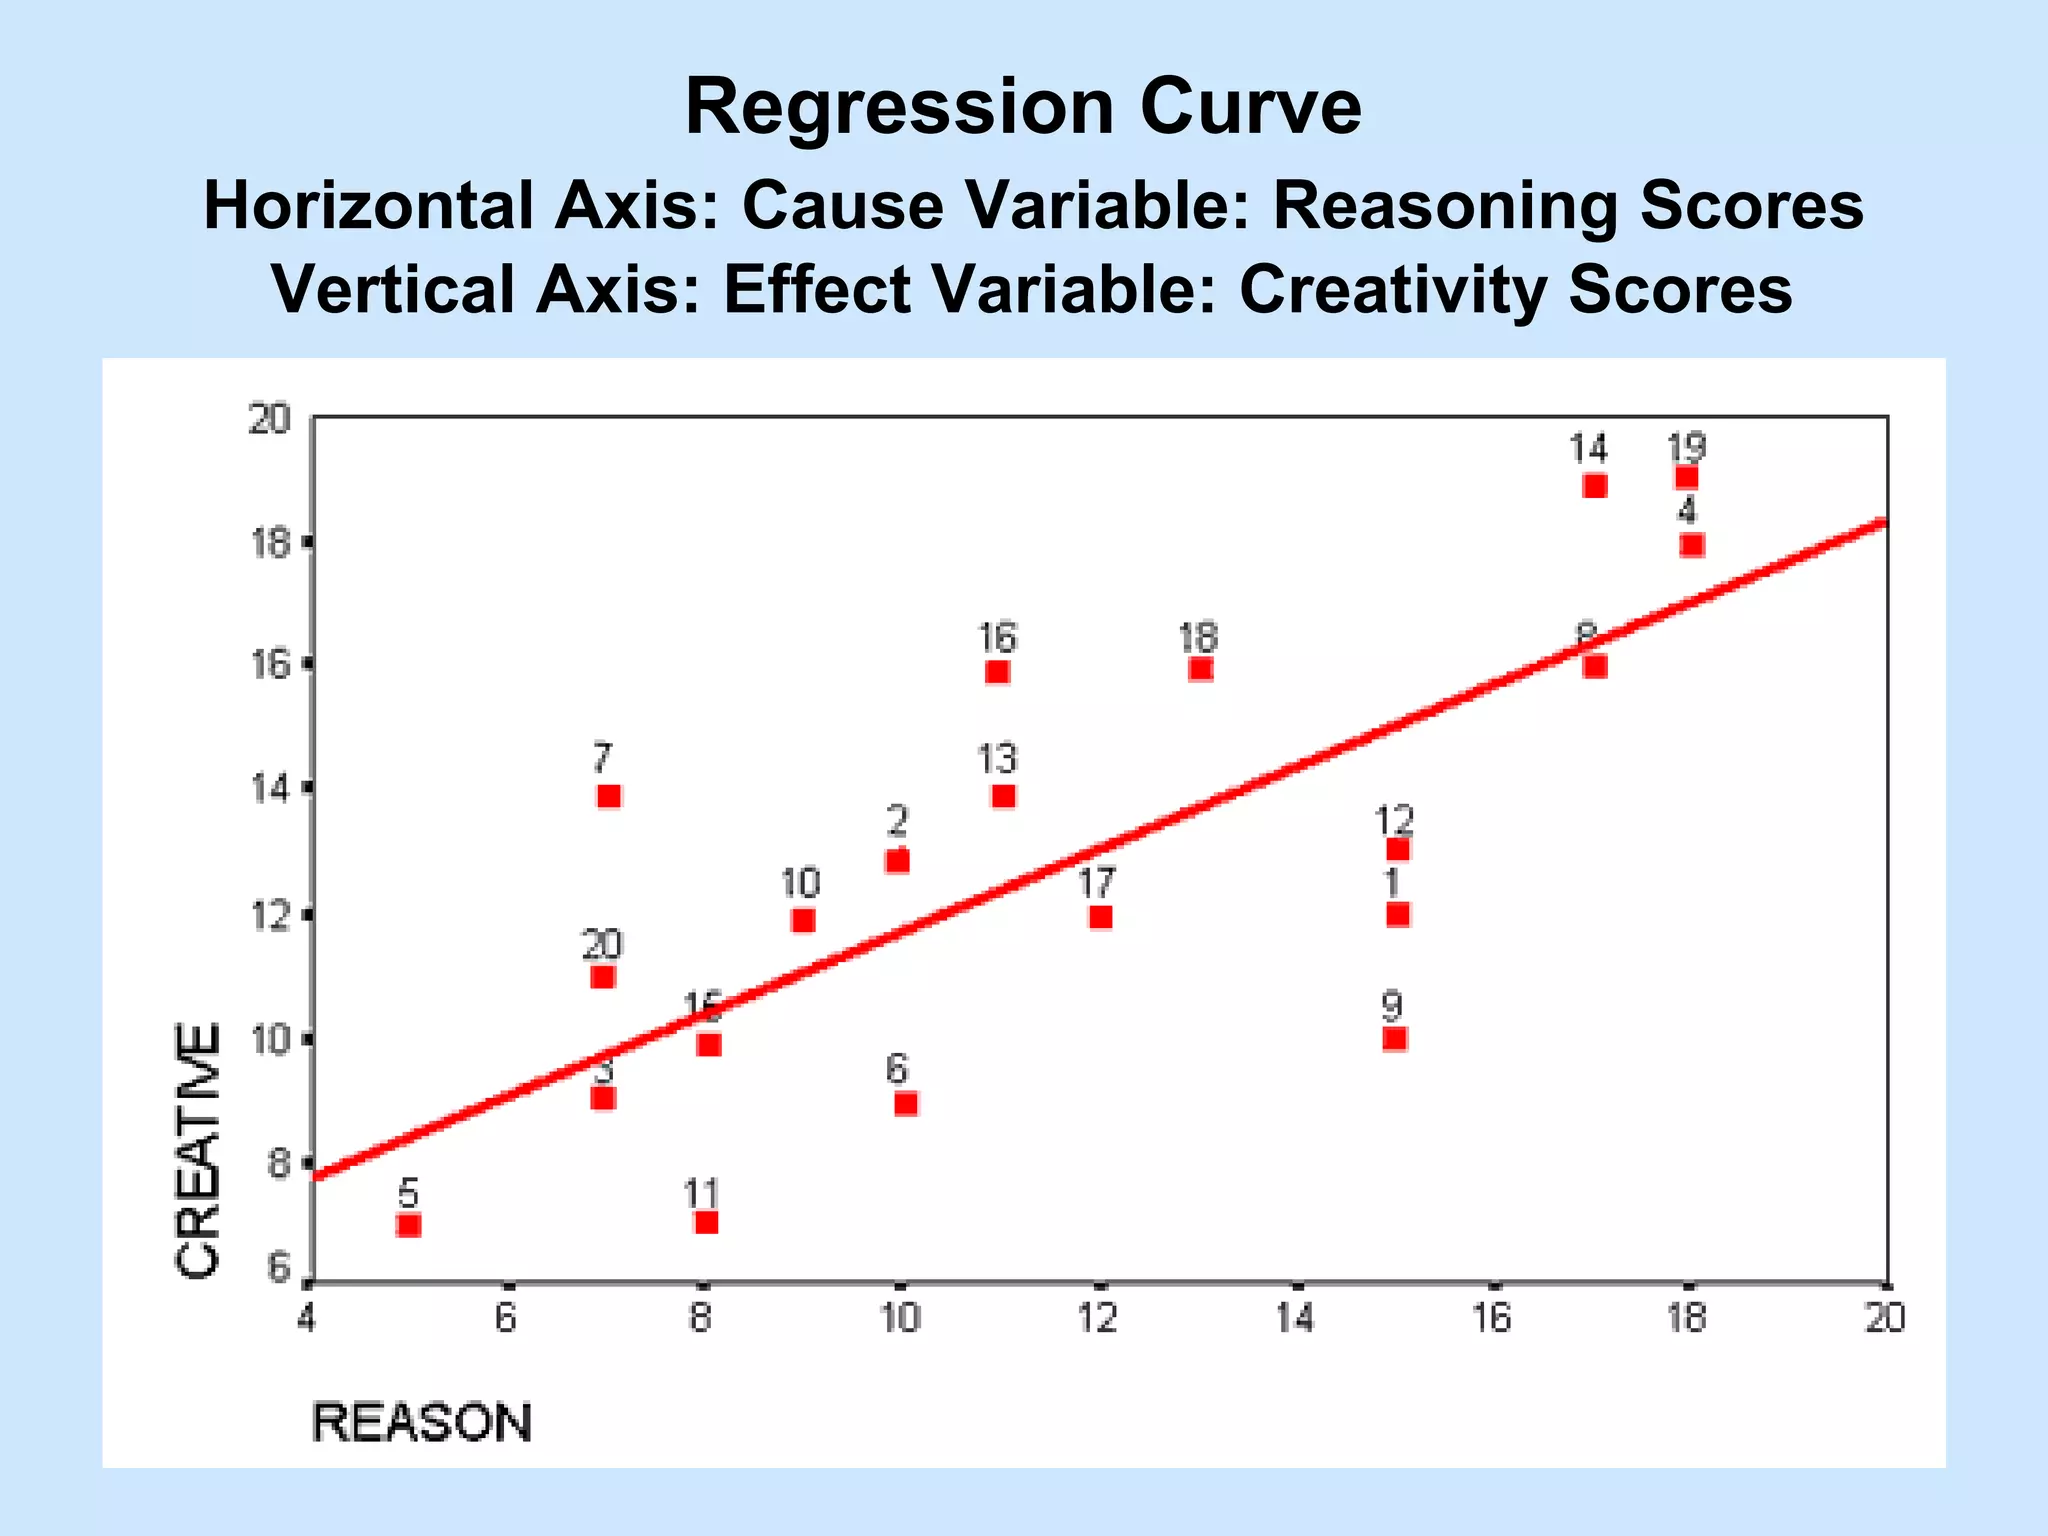
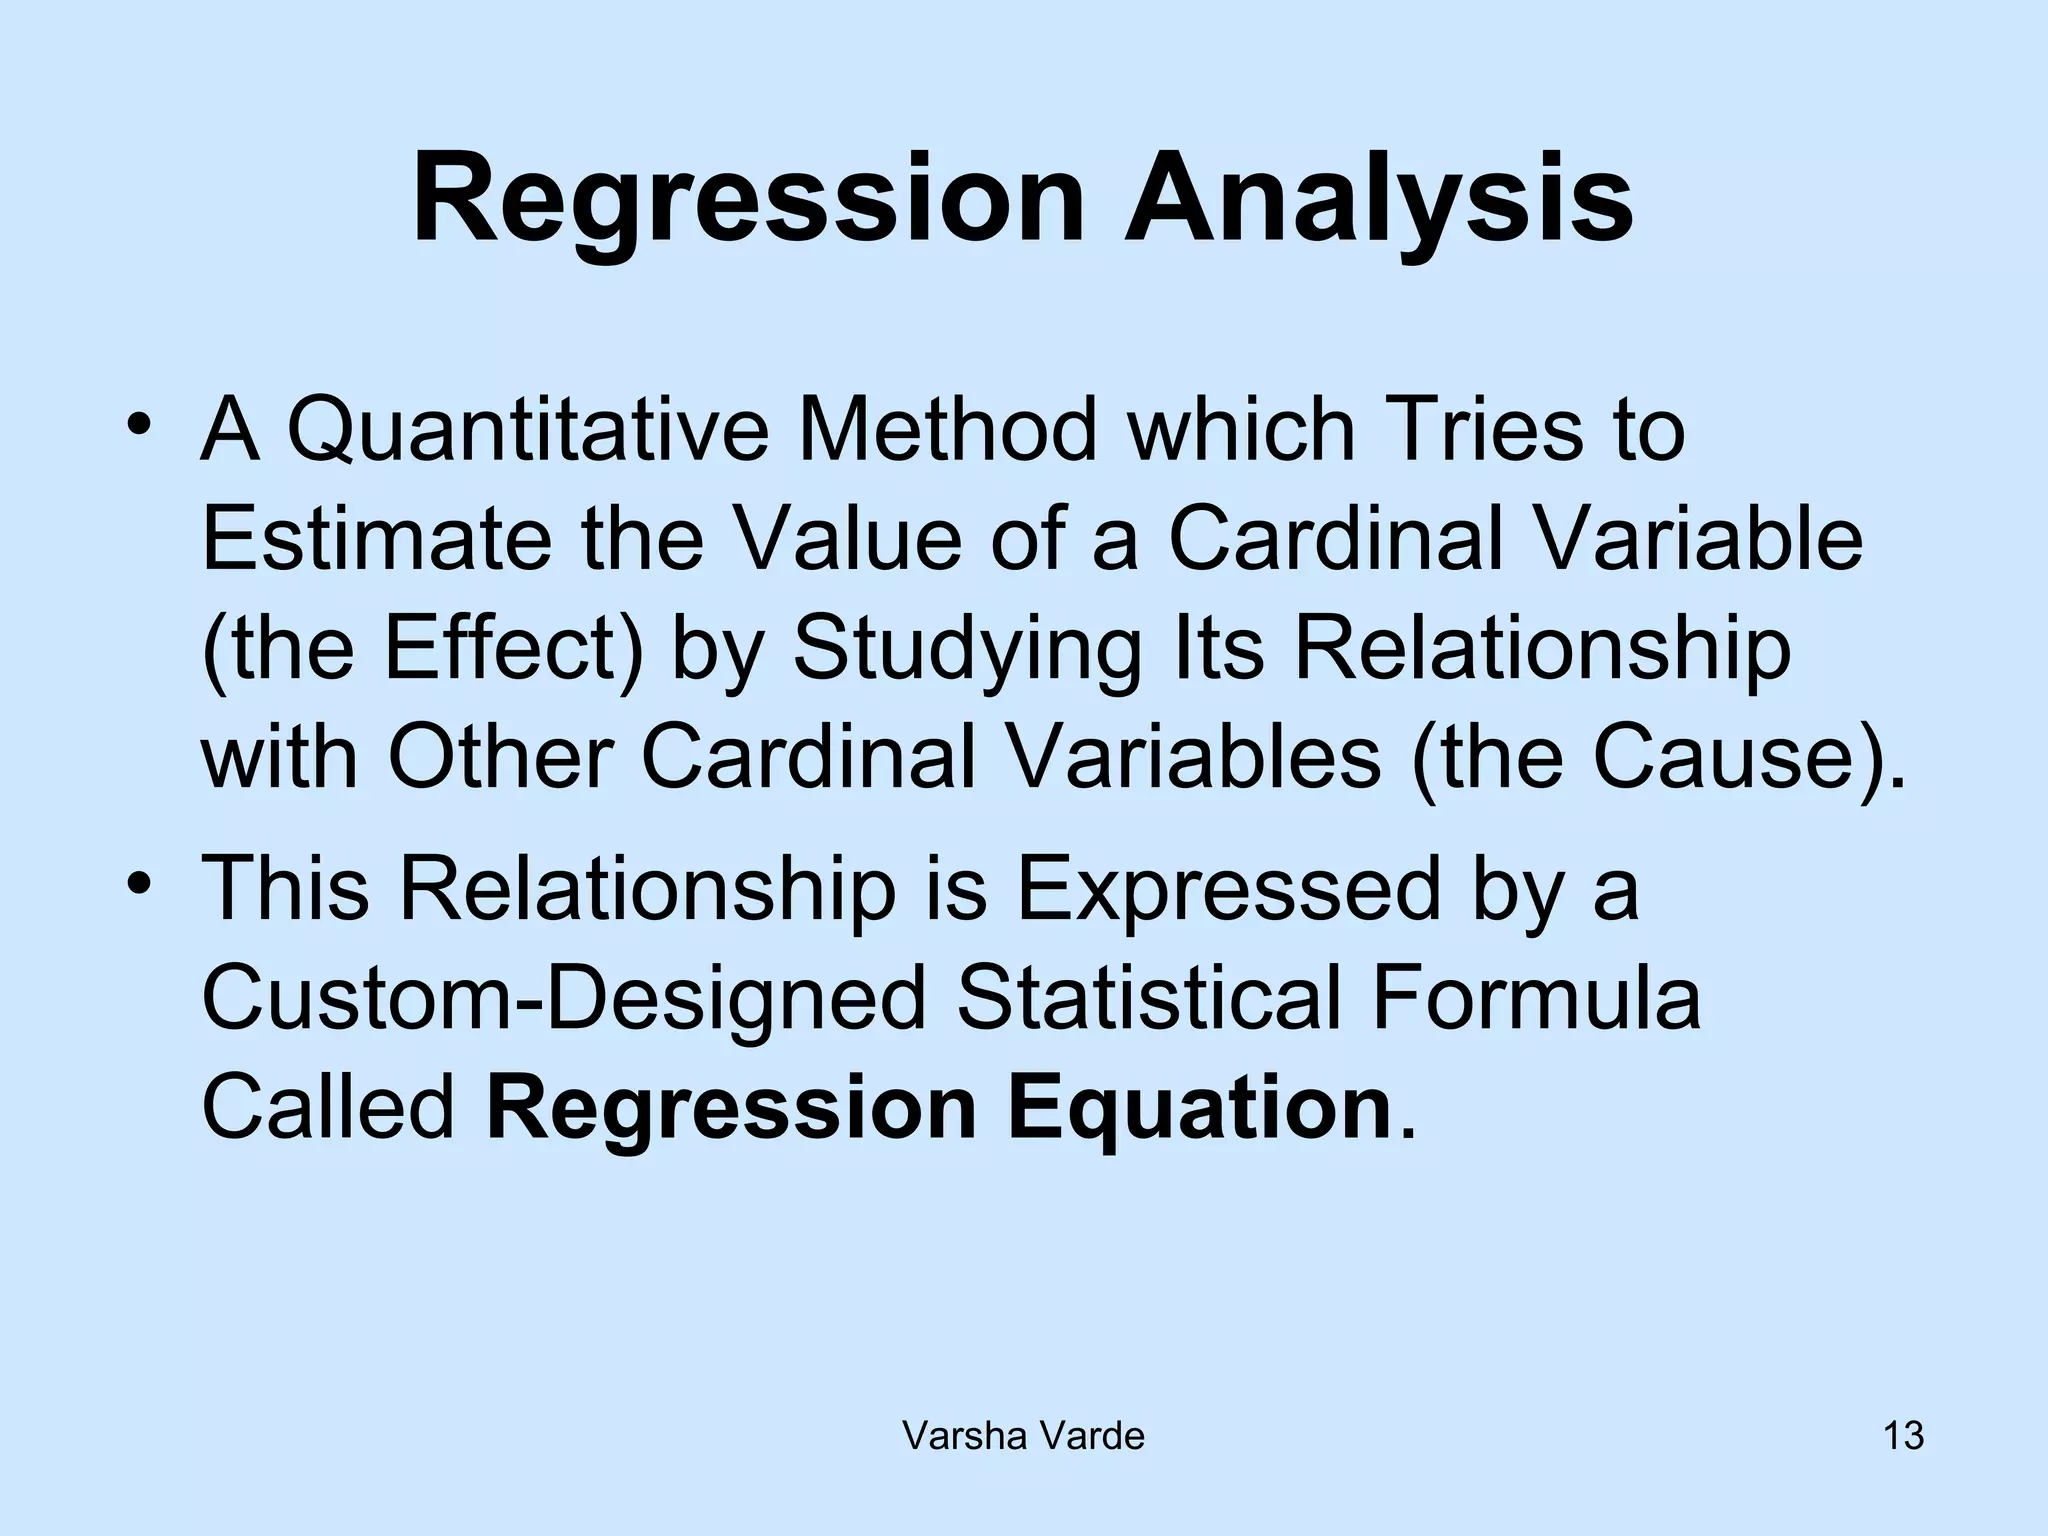
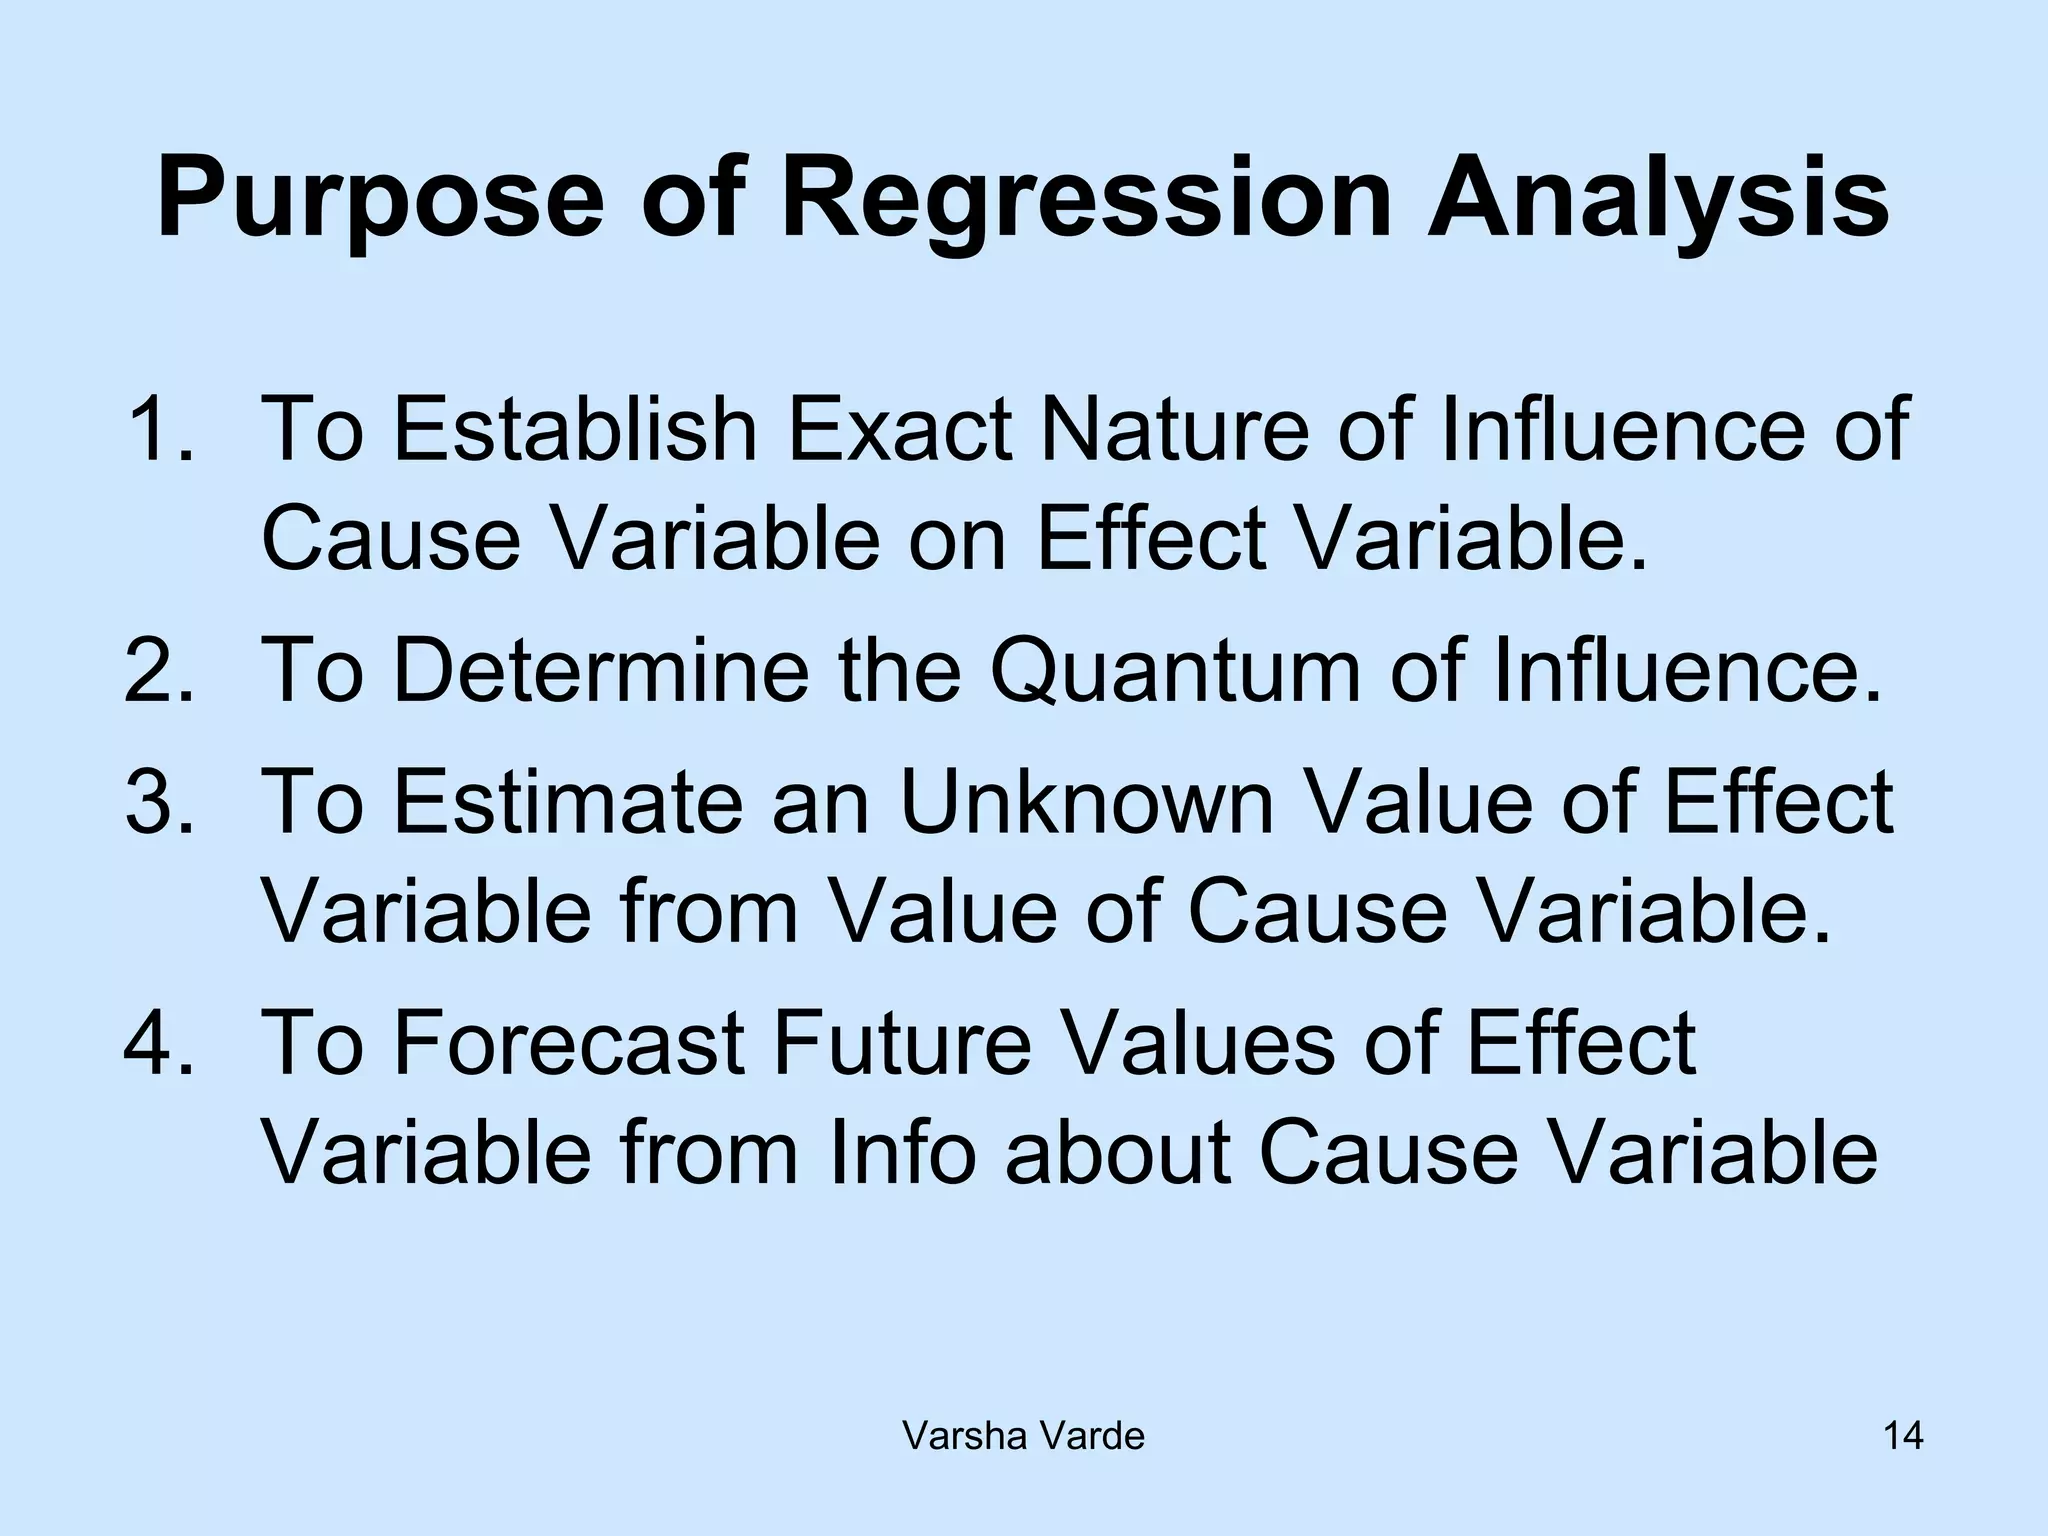
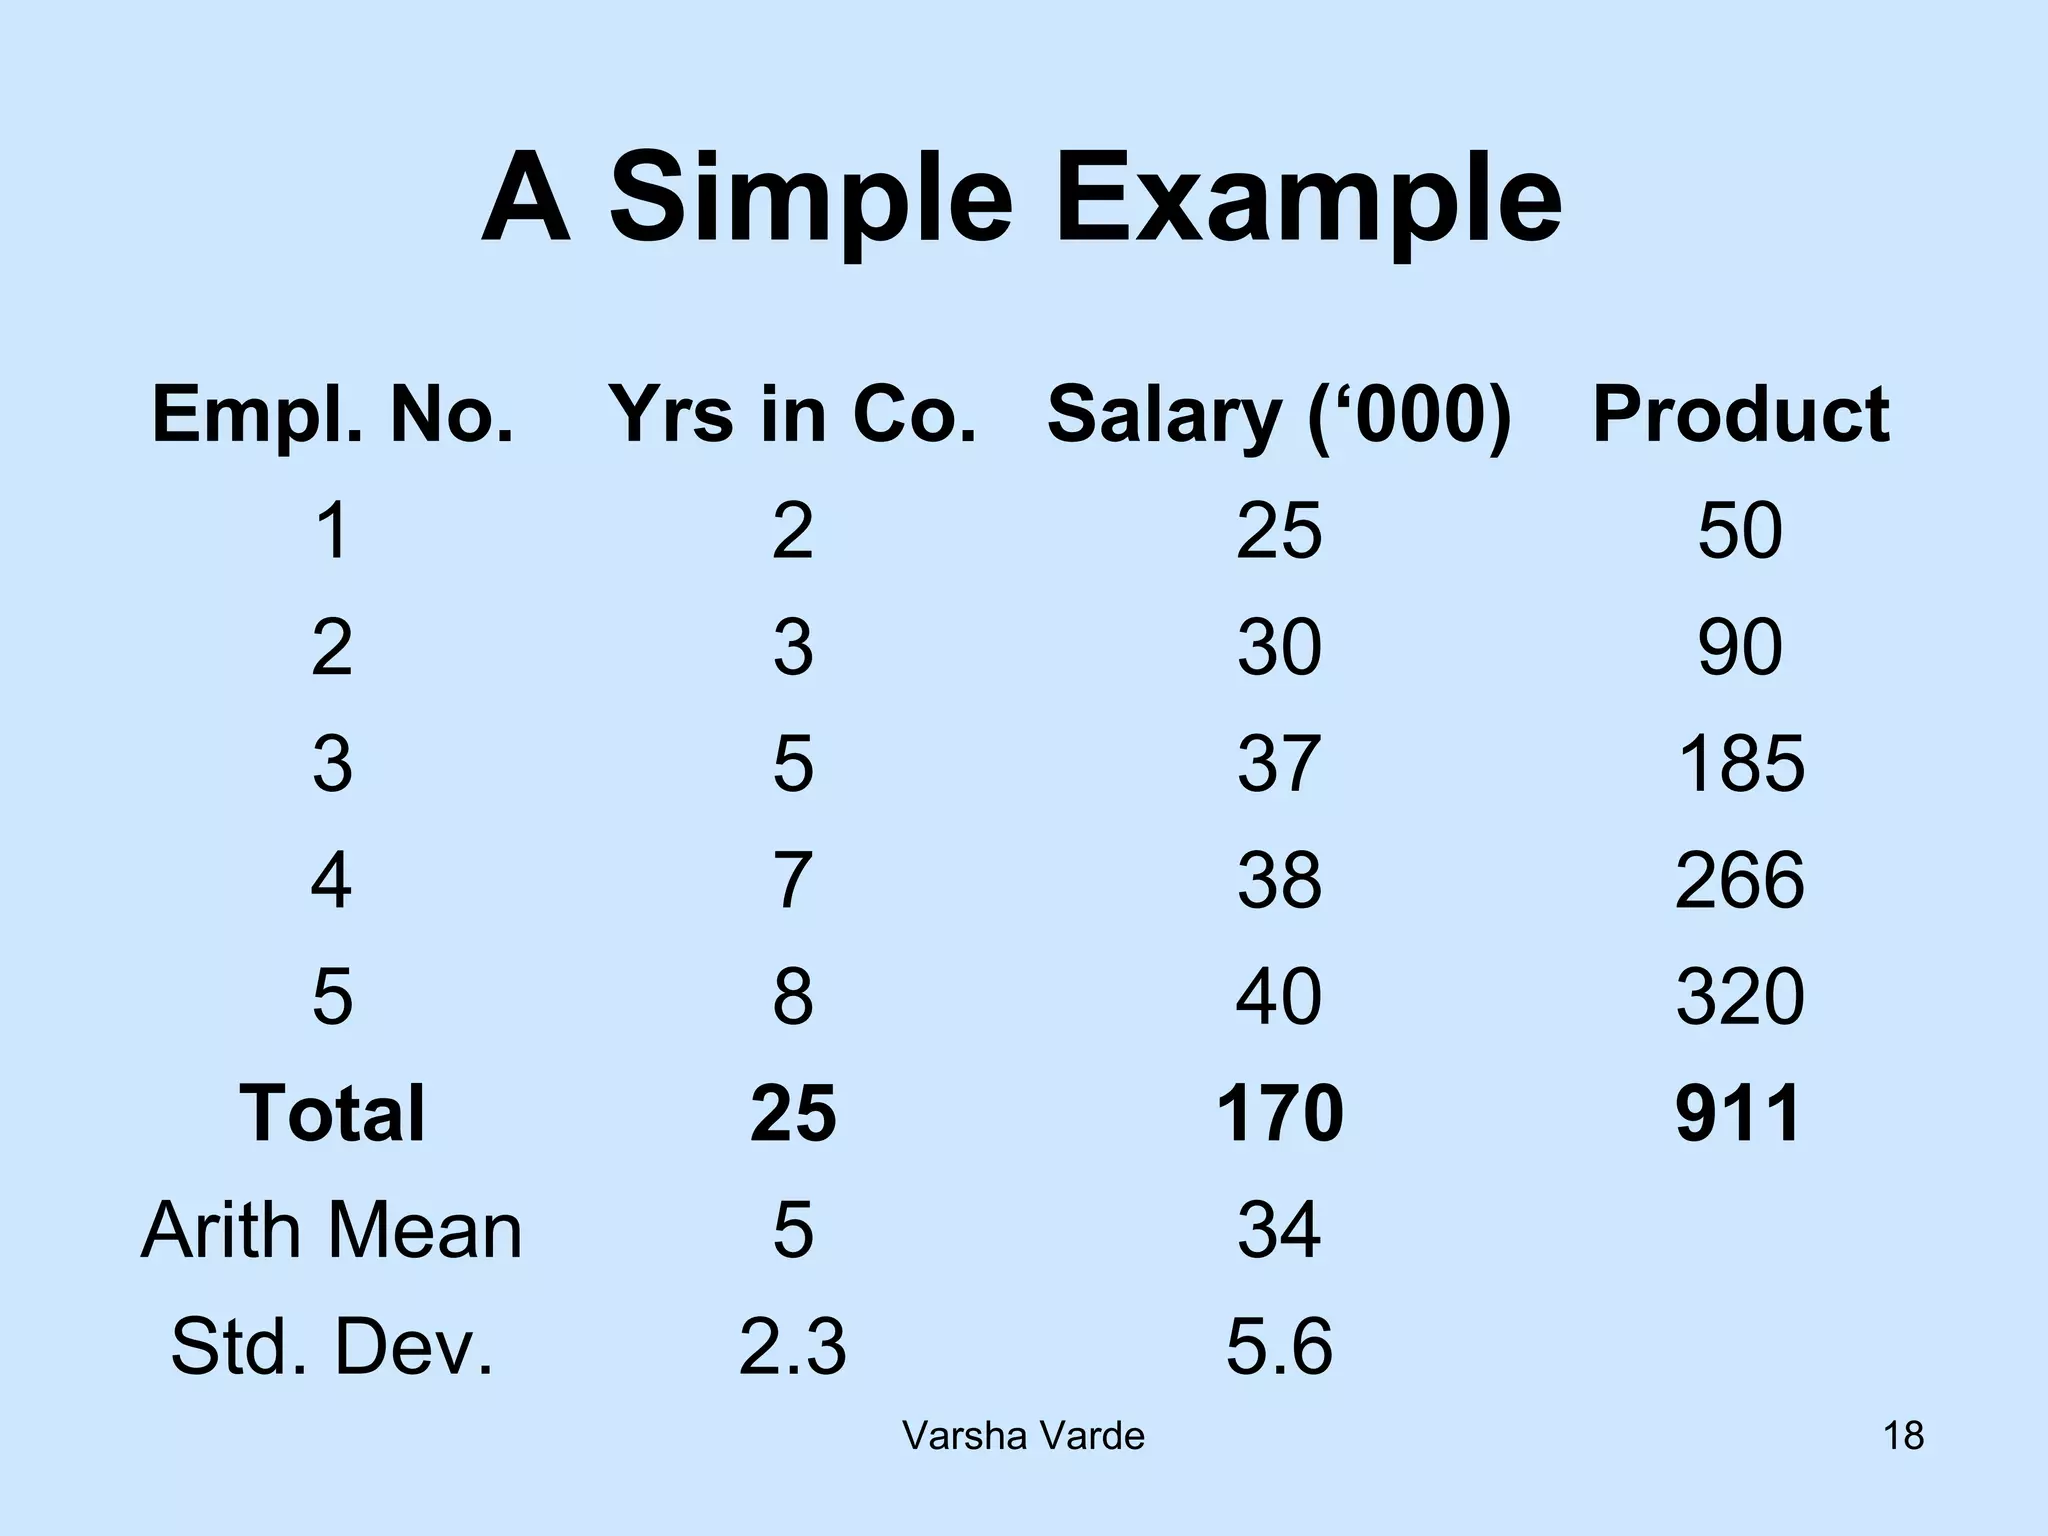
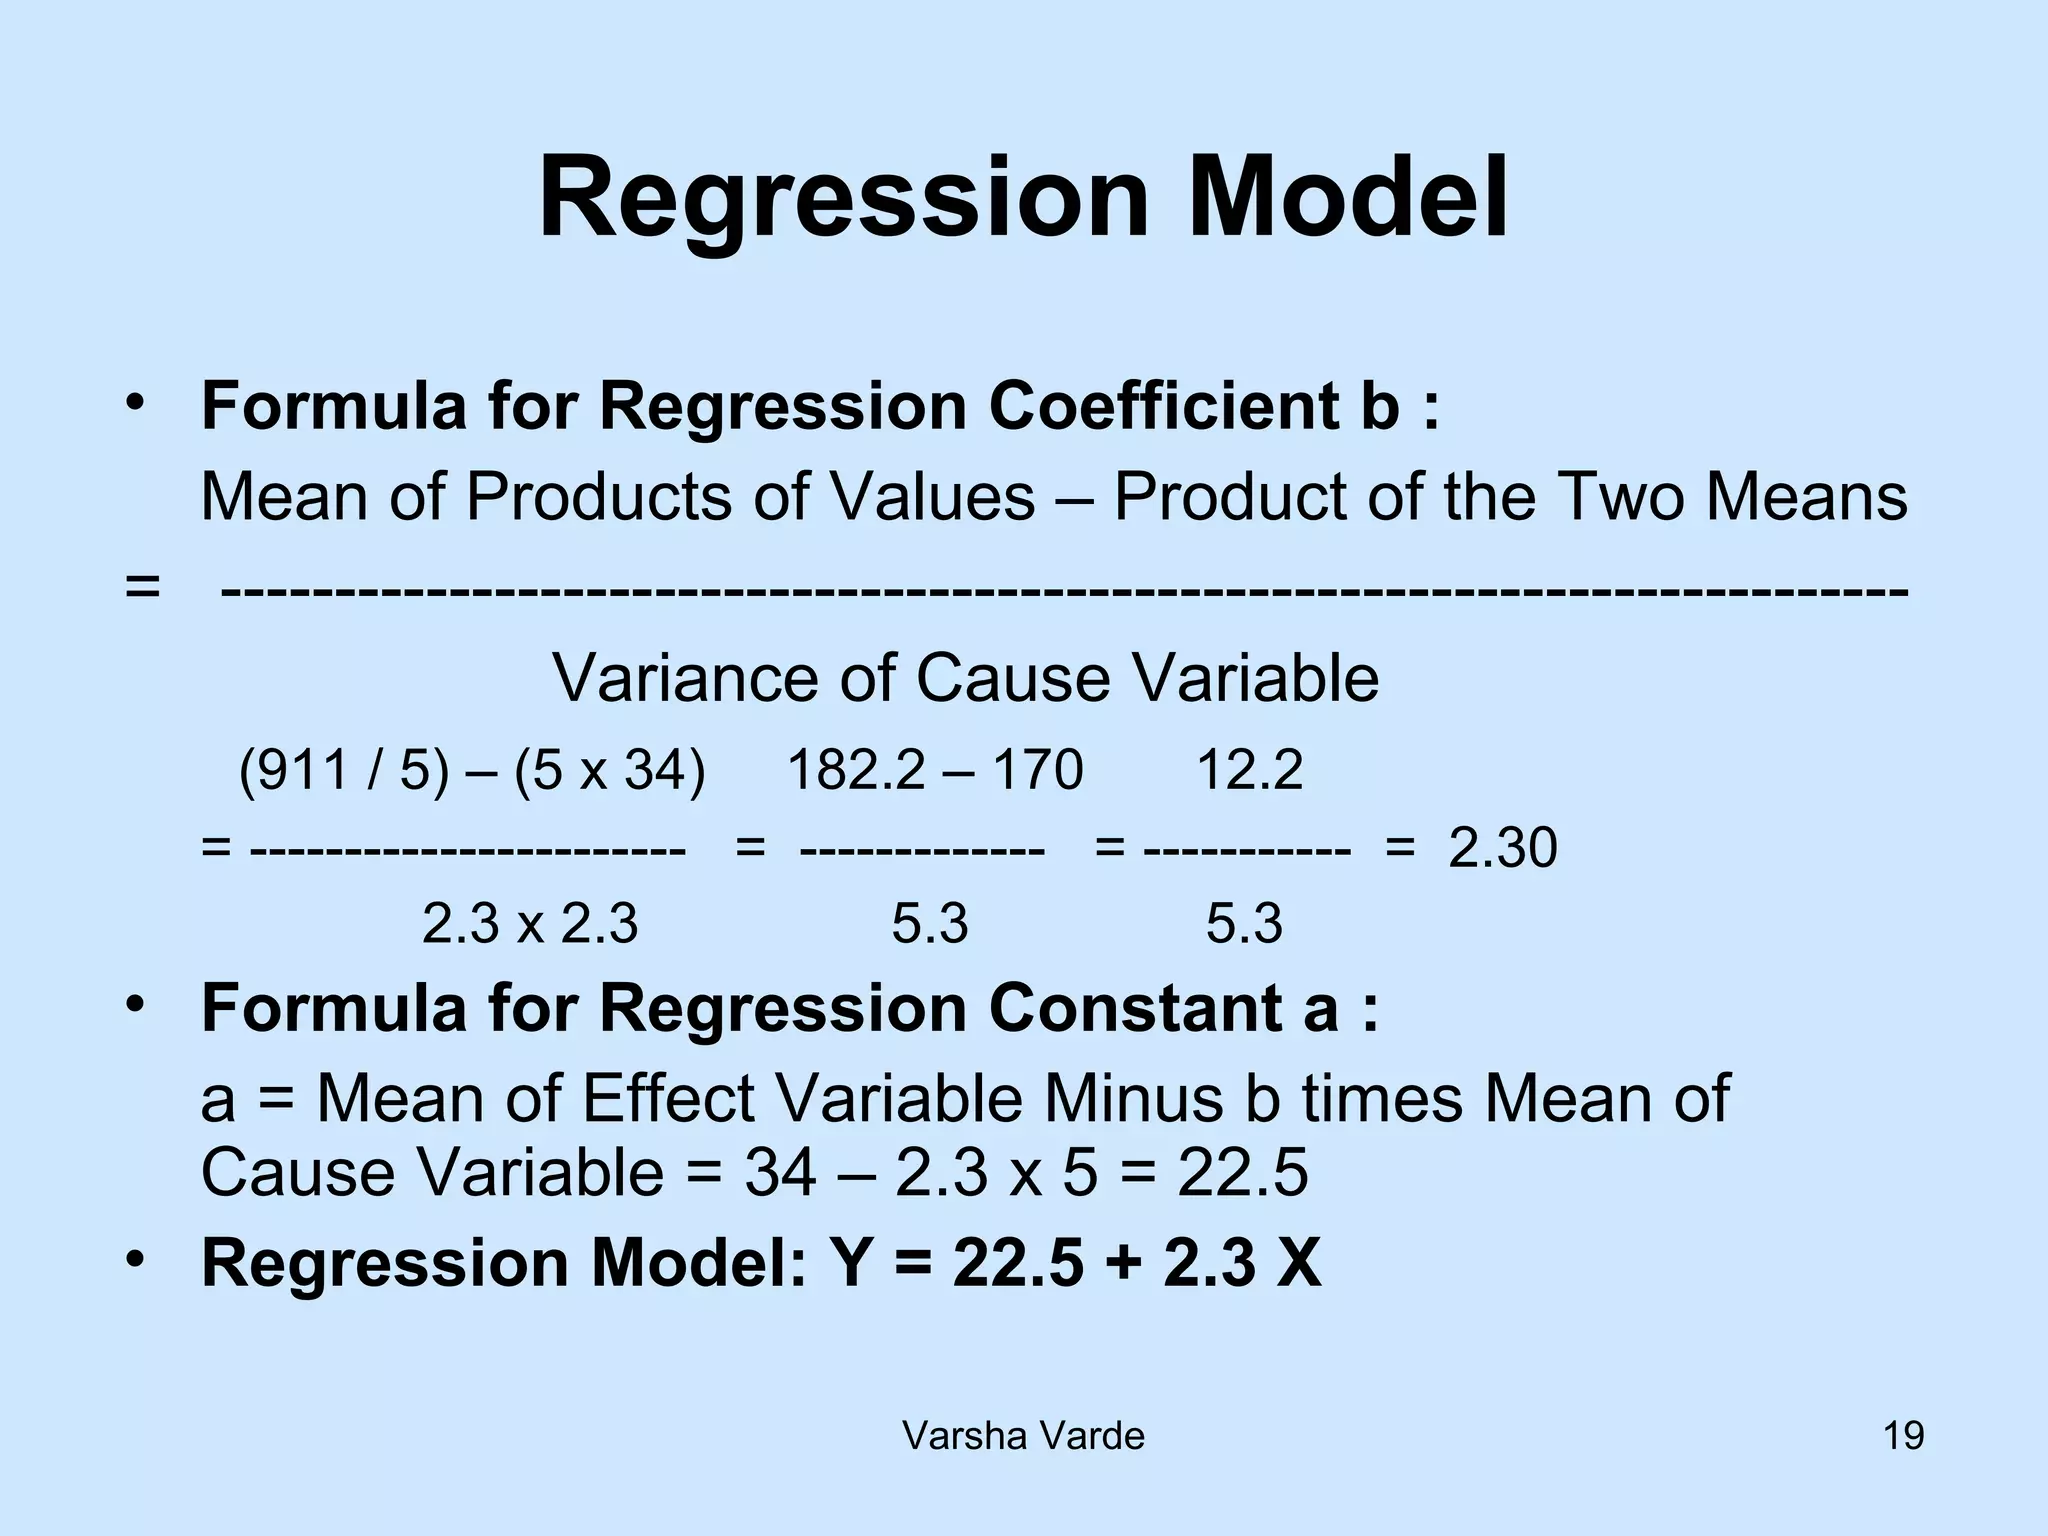
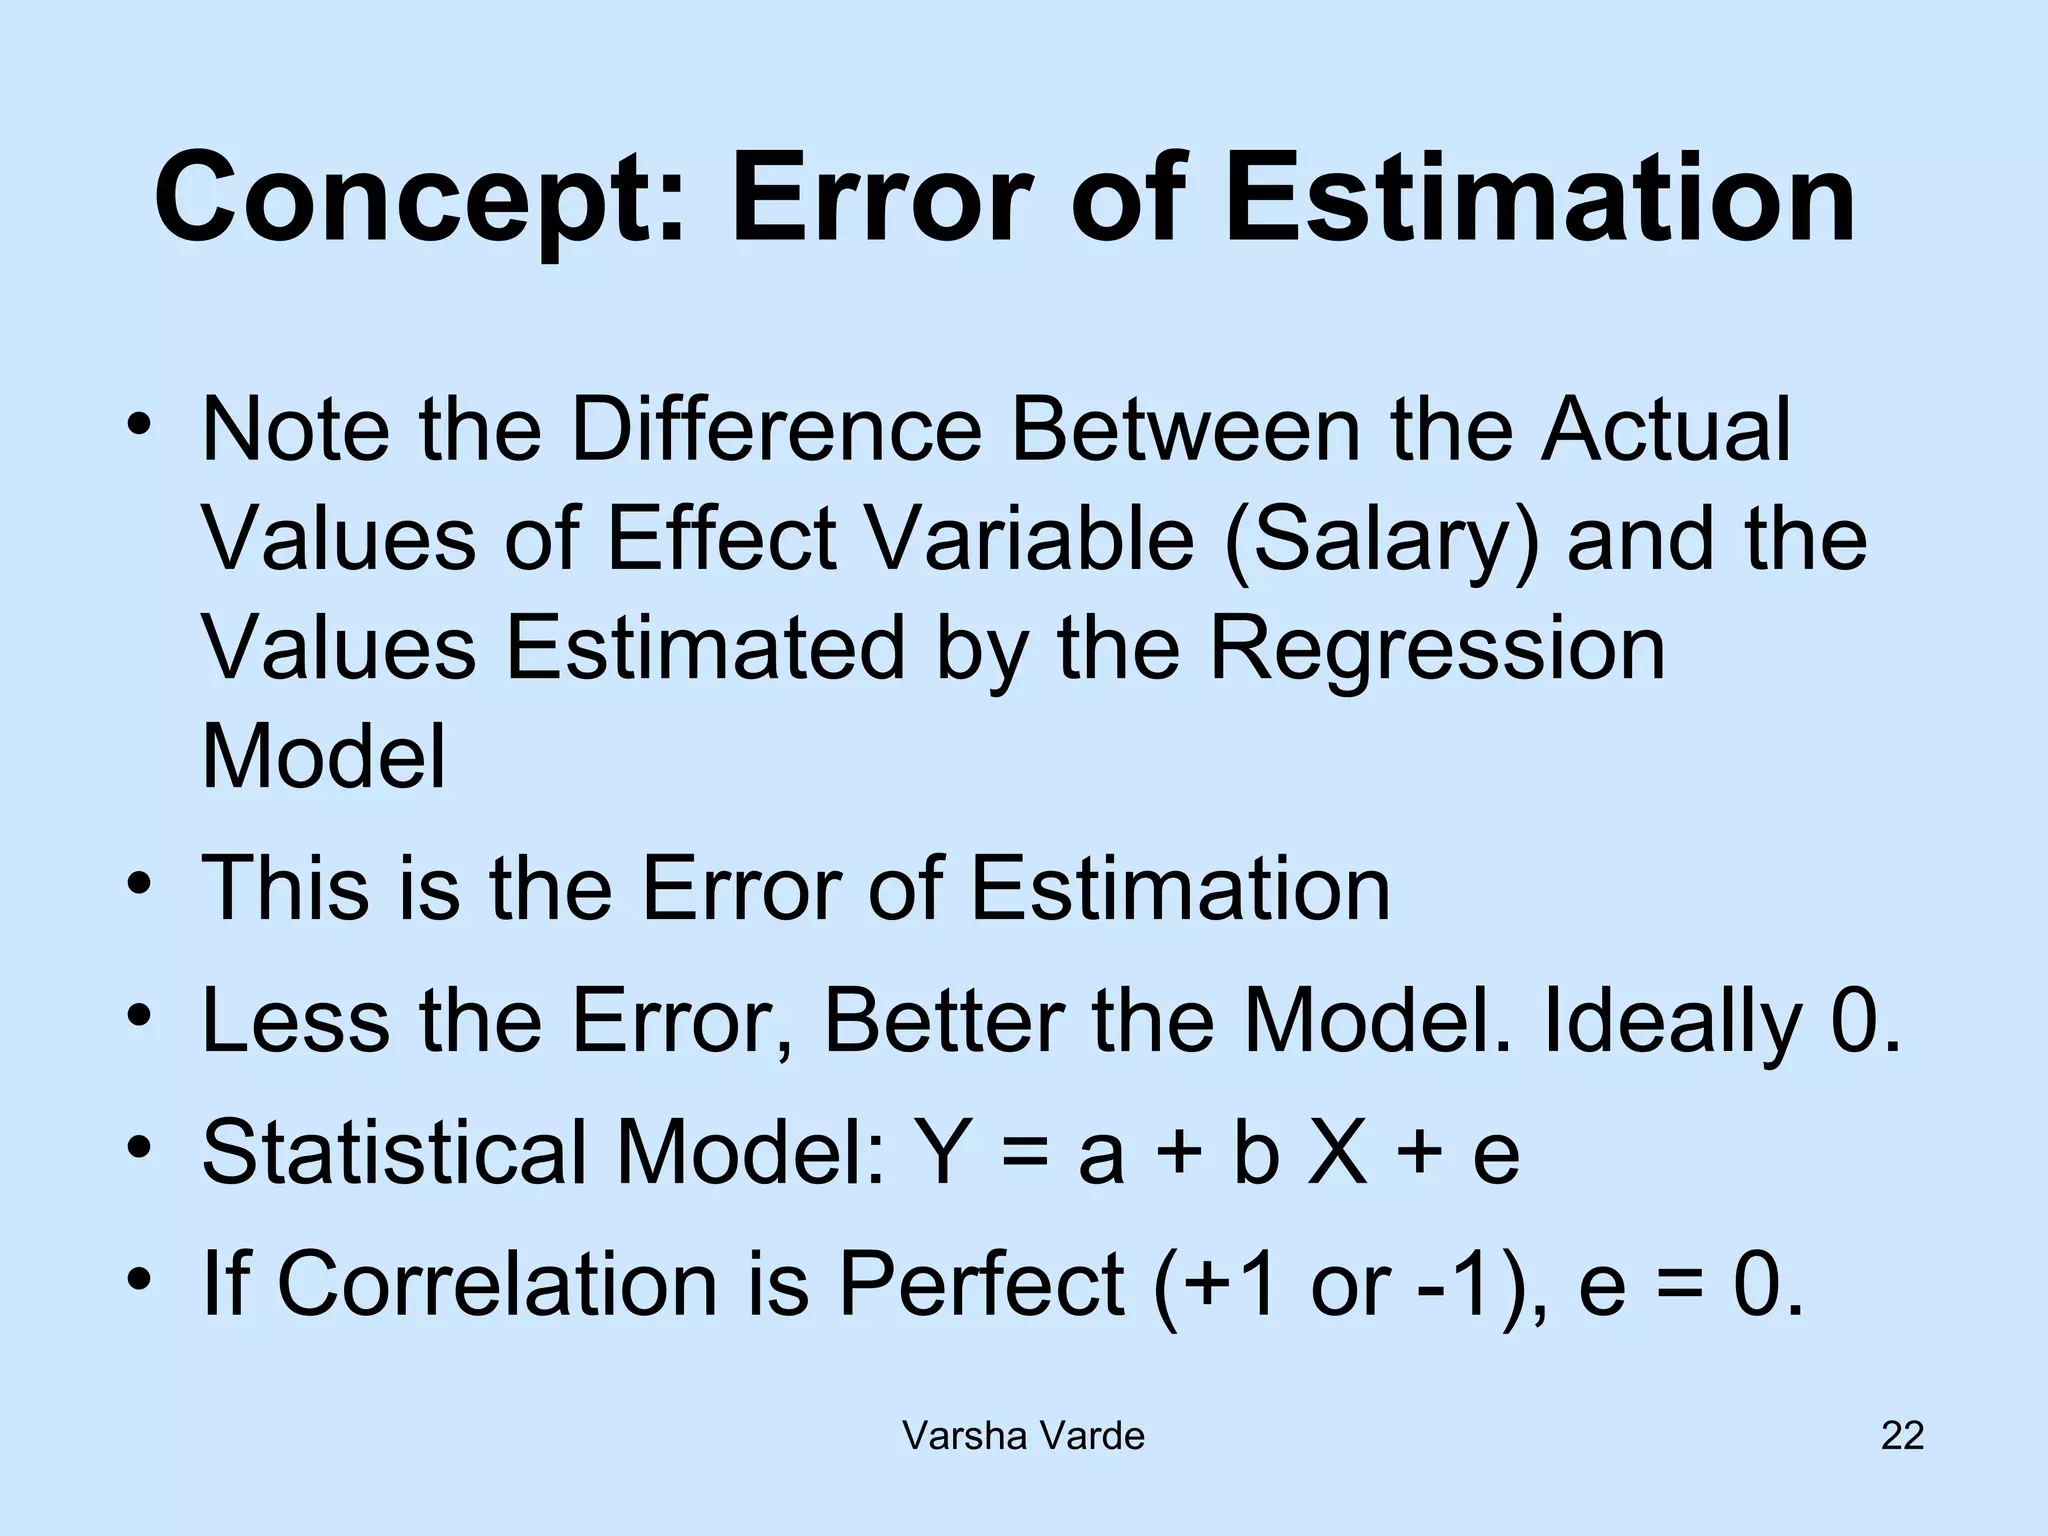
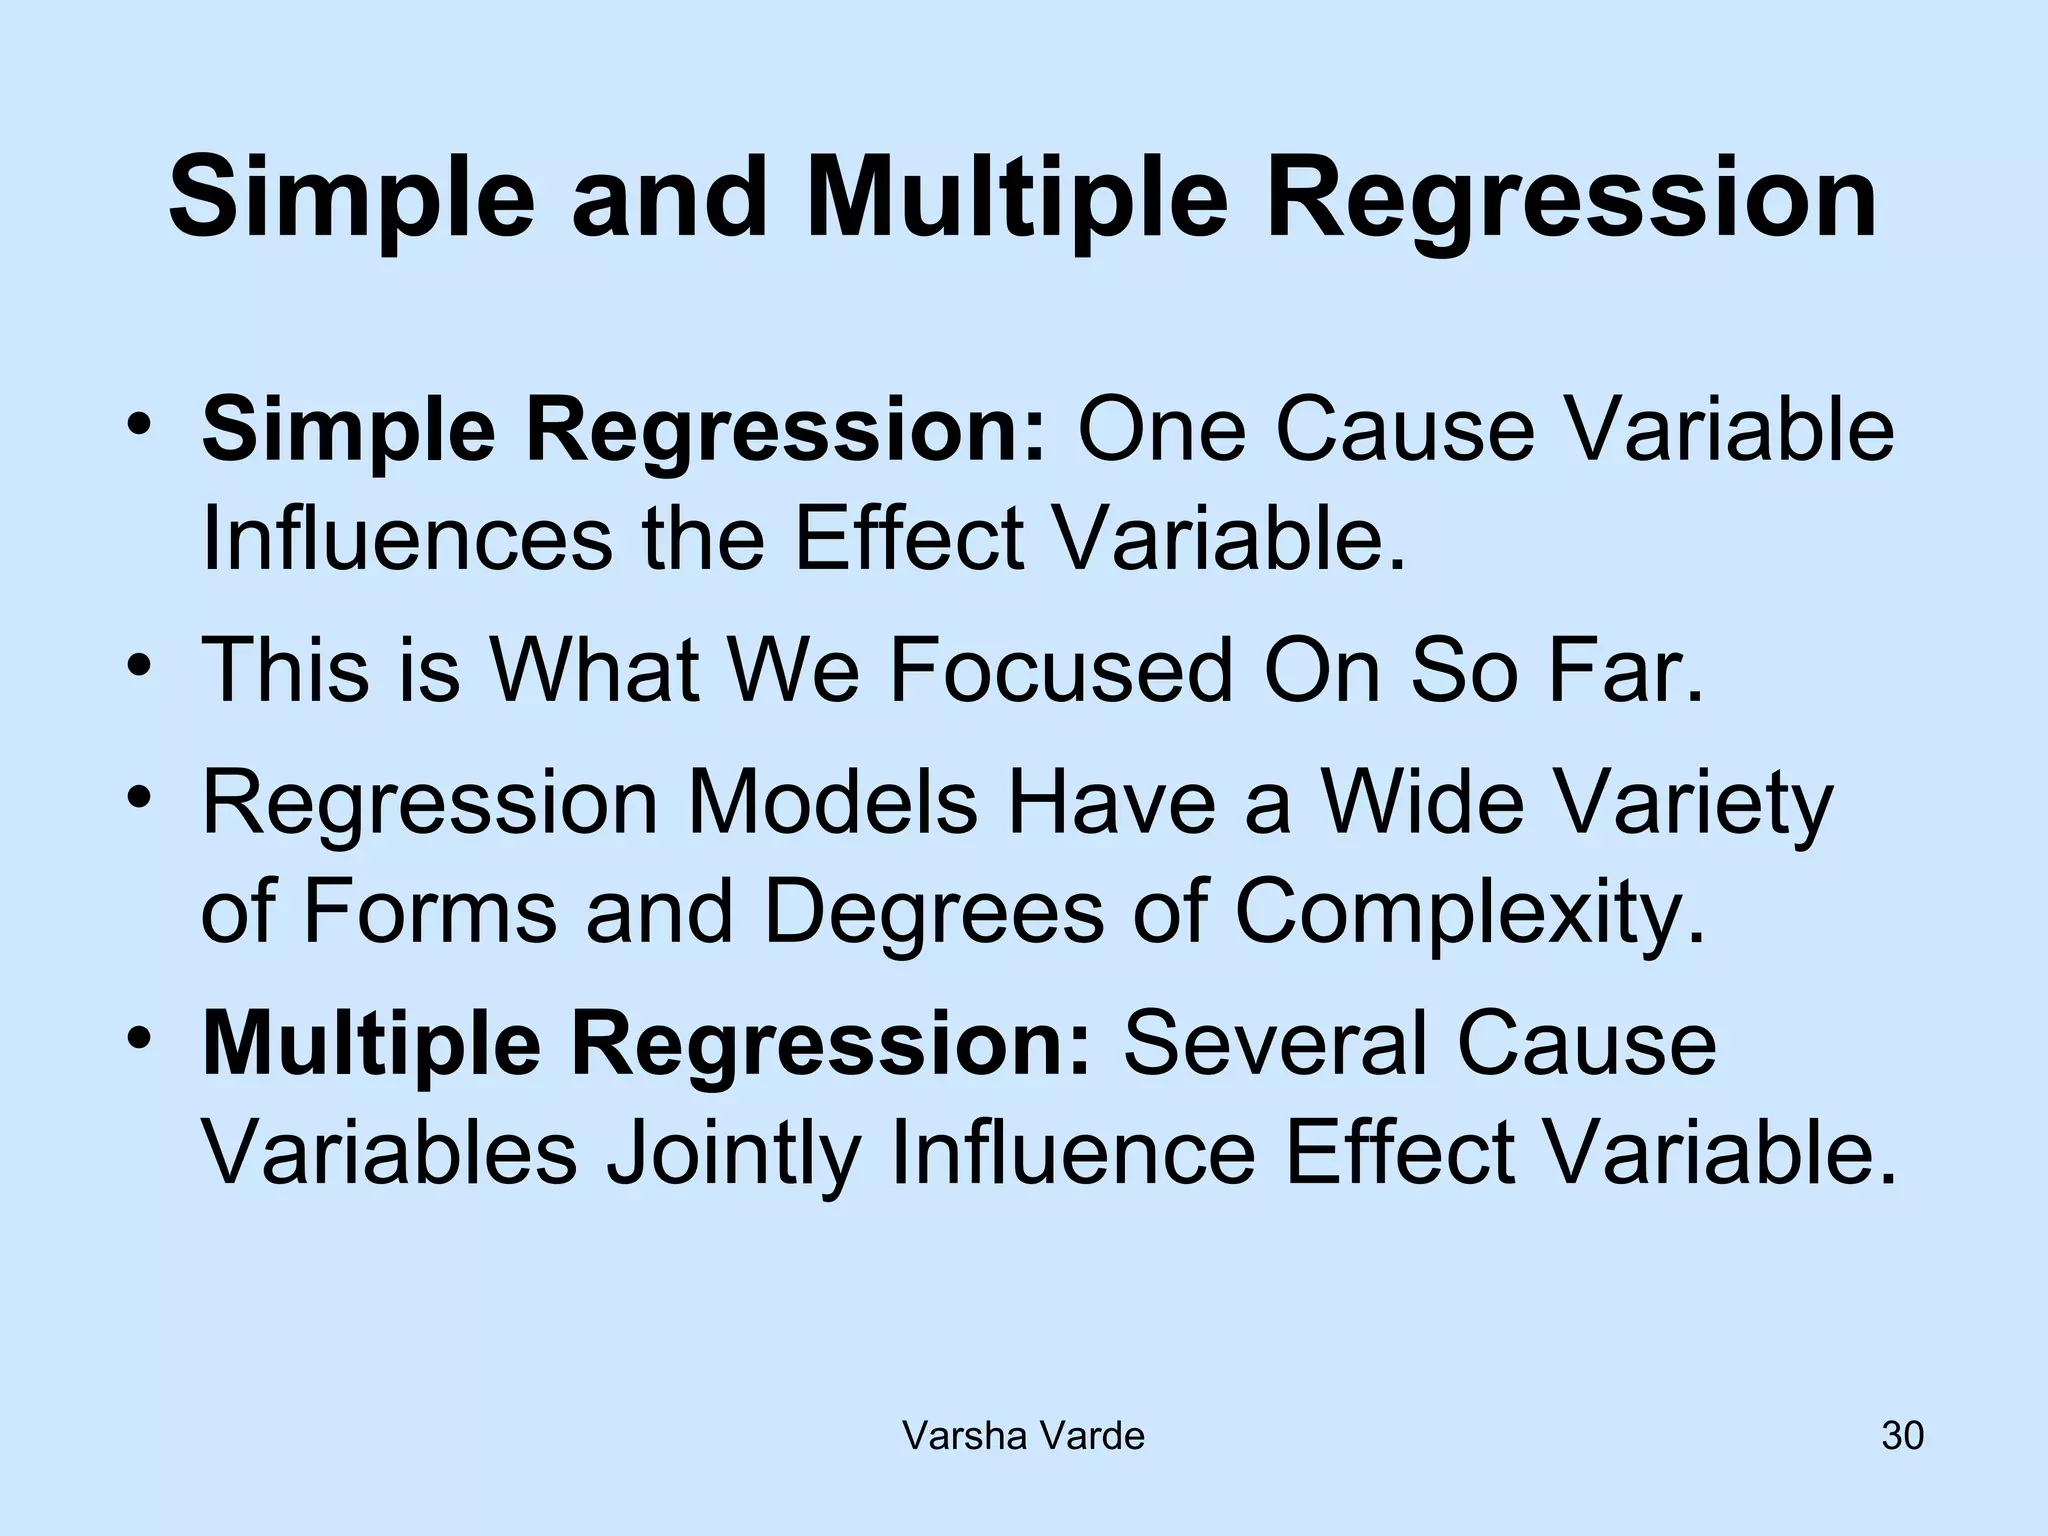
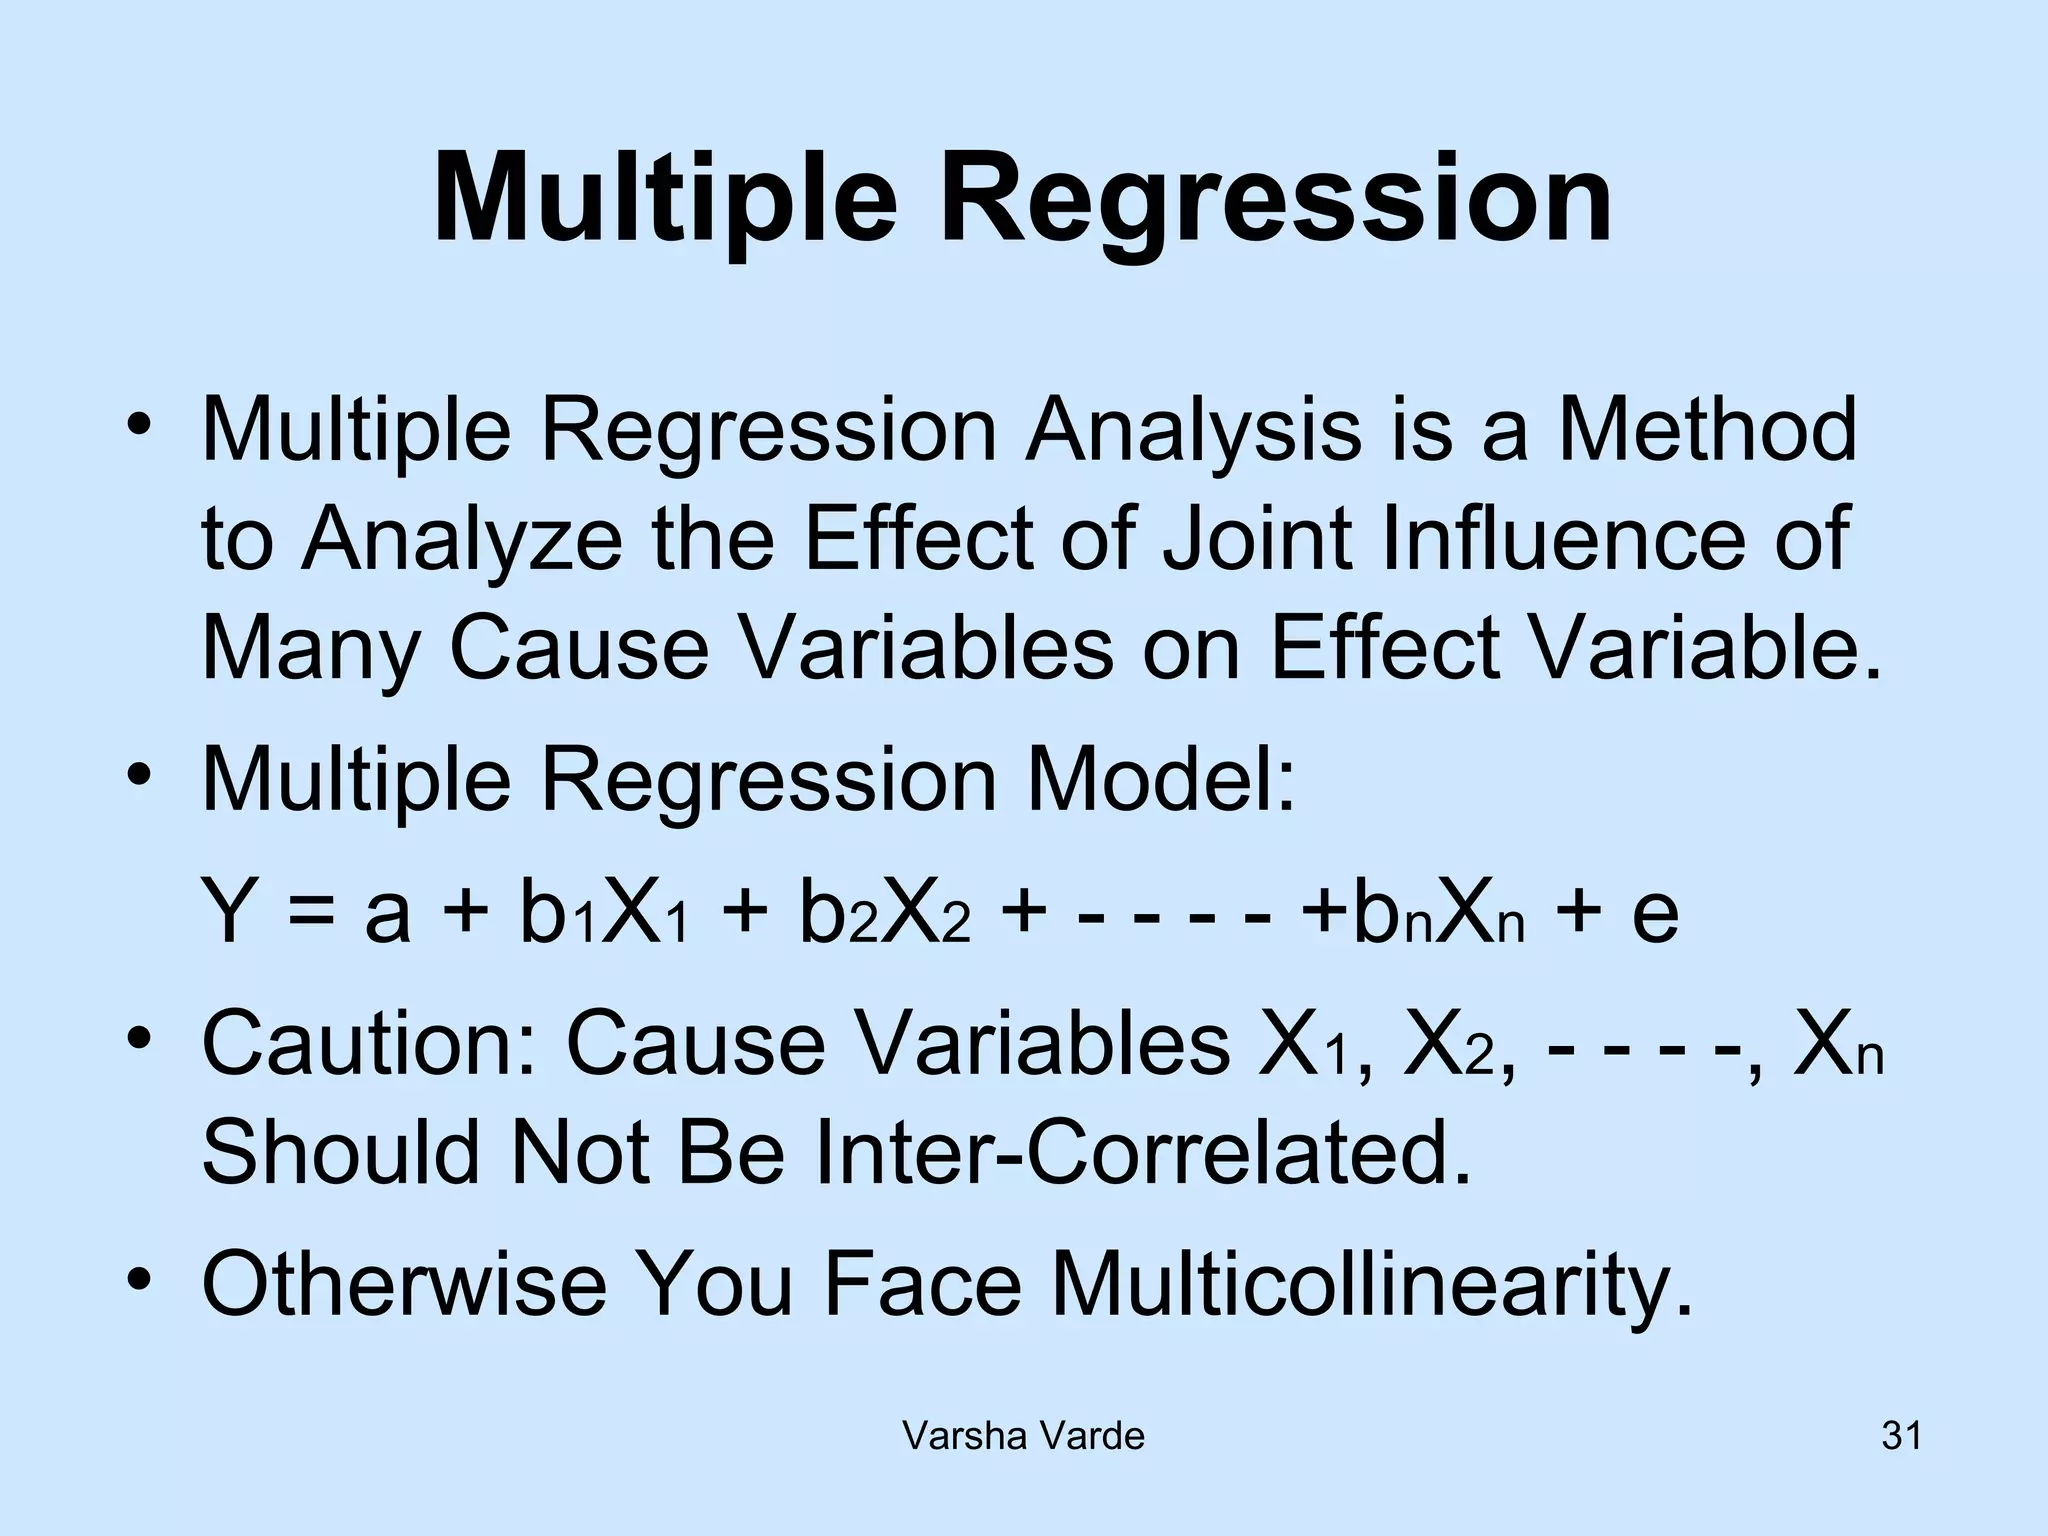
SlideShare a Scribd company logo
1 of 32
Quantitative Methods
Varsha Varde
Quantitative Methods
Models for Data Analysis & Interpretation:
Regression Analysis
Varsha Varde 3
Cause and Effect
The Present Contains Nothing
More Than The Past, and
What Is Found In The Effect
Was Already In The Cause.
- Henri Bergson
(19th
Century French Philosopher)
Varsha Varde 4
Regression Model
• A Statistical Model which Depicts the
Influence of One Cardinal Variable (The
Cause) on Another Cardinal Variable (The
Effect).
• These Models Have a Wide Variety of
Forms and Degrees of Complexity.
Varsha Varde 5
Regression
• The Step Logically Next To Correlation.
• Situation: Usually, Correlation Between
Two Variables Is Not Mere Benign
Association. But, It Is In Fact Causation.
• It Is a Cause and Effect Relationship,
Where X Influences Y.
• X is the Cause Variable.
• Y is the Effect Variable.
Varsha Varde 6
Some Examples
Cause Effect
Movie Ticket Price Multiplex Occupancy
Machine Downtime Production
Rainfall at Night Absenteeism Next Day
R&D Expenditure Gross Profit
? ?
Varsha Varde 7
Regression
• Dictionary Says: The Act of Returning or
Stepping Back to a Previous Stage.
• Query: Do Quantitative Methods Force Us
to Regress instead of Progress?
• Or, Is It Back to the Future?
• Answer: Statistics, Like Any Other Field,
Adopts Crazy Names Arising from Some
Important Historical Events.
• Soap Opera.
Varsha Varde 8
Story of Regression
• Sir Francis Galton Studied the Heights of
the Sons in Relation to the Heights of
Their Fathers.
• His Conclusion: Sons of Tall Fathers Were
Not So Tall and Sons of Short Fathers
Were Not So Short as their Fathers.
• Path Breaking Finding: Human Heights
Tend To Regress Back To Normalcy.
Varsha Varde 9
Evolution of the Term
‘Regression’
• Since Then (1880), Similar Studies on
Nature and Extent of Influence of One or
More Variables on Some Other Variable
Acquired the Name ‘Regression Analysis’.
• In Quantitative Methods, Regression
Means a ‘Cause and Effect Relationship’.
• Cause Variable = Independent Variable
• Effect Variable = Dependent Variable
Varsha Varde 10
Scatter Plot
Horizontal Axis: Reasoning Scores
Vertical Axis: Creativity Scores
Varsha Varde 11
Scatter Plot
Horizontal Axis: Cause Variable: Reasoning Scores
Vertical Axis: Effect Variable: Creativity Scores
Varsha Varde 12
Regression Curve
Horizontal Axis: Cause Variable: Reasoning Scores
Vertical Axis: Effect Variable: Creativity Scores
Varsha Varde 13
Regression Analysis
• A Quantitative Method which Tries to
Estimate the Value of a Cardinal Variable
(the Effect) by Studying Its Relationship
with Other Cardinal Variables (the Cause).
• This Relationship is Expressed by a
Custom-Designed Statistical Formula
Called Regression Equation.
Varsha Varde 14
Purpose of Regression Analysis
1. To Establish Exact Nature of Influence of
Cause Variable on Effect Variable.
2. To Determine the Quantum of Influence.
3. To Estimate an Unknown Value of Effect
Variable from Value of Cause Variable.
4. To Forecast Future Values of Effect
Variable from Info about Cause Variable
Varsha Varde 15
Patterns of Regression Curves
• Pattern: Upward Sloping Straight Line
• Mathematical Model: Y = a + bX (b > 0)
Varsha Varde 16
Estimating Regression
Parameters a & b
• Formula for Regression Coefficient b :
Mean of Products of Values – Product of the Two Means
= --------------------------------------------------------------------------
Variance of Cause Variable
• Formula for Regression Constant a :
a = Mean of Effect Variable Minus b times
Mean of Cause Variable
• Don’t Worry. This is the Job of SPSS.
Varsha Varde 17
Estimating
Correlation Coefficient
• Recall the Formula for Correlation Coeff.
• Pearson’s Correlation Coefficient
• Formula:
Mean of Products of Values – Product of the Two Means
= --------------------------------------------------------------------------
Product of the Two Standard Deviations
• Spot the Similarity and the Difference.
Varsha Varde 18
A Simple Example
Empl. No. Yrs in Co. Salary (‘000) Product
1 2 25 50
2 3 30 90
3 5 37 185
4 7 38 266
5 8 40 320
Total 25 170 911
Arith Mean 5 34
Std. Dev. 2.3 5.6
Varsha Varde 19
Regression Model
• Formula for Regression Coefficient b :
Mean of Products of Values – Product of the Two Means
= --------------------------------------------------------------------------
Variance of Cause Variable
(911 / 5) – (5 x 34) 182.2 – 170 12.2
= ----------------------- = ------------- = ----------- = 2.30
2.3 x 2.3 5.3 5.3
• Formula for Regression Constant a :
a = Mean of Effect Variable Minus b times Mean of
Cause Variable = 34 – 2.3 x 5 = 22.5
• Regression Model: Y = 22.5 + 2.3 X
Varsha Varde 20
Check Goodness of the Model
Empl. No. Yrs in Co. Salary (‘000) Estimate
1 2 25
2 3 30
3 5 37
4 7 38
5 8 40
Total 25 170
Arith Mean 5 34
Std. Dev. 2.3 5.6
Varsha Varde 21
Check Goodness of the Model
Empl. No. Yrs in Co. Salary (‘000) Estimate
1 2 25 27.1
2 3 30 29.4
3 5 37 34.0
4 7 38 38.6
5 8 40 40.9
Total 25 170 170
Arith Mean 5 34
Std. Dev. 2.3 5.6
Varsha Varde 22
Concept: Error of Estimation
• Note the Difference Between the Actual
Values of Effect Variable (Salary) and the
Values Estimated by the Regression
Model
• This is the Error of Estimation
• Less the Error, Better the Model. Ideally 0.
• Statistical Model: Y = a + b X + e
• If Correlation is Perfect (+1 or -1), e = 0.
Given below are five observations collected in a
regression study on two variables, x (independent
variable) and y (dependent variable).
x y
2 4
3 4
4 3
5 2
6 1
a. Develop the least squares estimated regression
equation.
b. Estimate value of y for x=7.Varsha Varde 23
Q5.
Varsha Varde 24
Exercise: Fit a Regression Model to
Reasoning & Creativity Scores
Apl No, RsnSc CrvSc Apl No, RsnSc CrvSc
01 15.2 11.9 11 8.1 6.8
02 9.9 13.1 12 15.2 13.0
03 7.1 8.9 13 10.9 13.9
04 17.9 17.4 14 17.2 19.1
05 5.1 6.9 15 8.2 10.1
06 10.0 8.8 16 10.8 15.9
07 7.2 14.0 17 12.0 12.1
08 17.1 15.8 18 13.1 16.0
09 15.2 9.7 19 17.9 19.2
10 9.2 12.1 20 7.1 11.9
Varsha Varde 25
Exercise
• Does Your Model Look Like What I Got?:
Creativity Scores = 5.23 + 0.65 x Reasoning Scores + e
• Test the Goodness of Your Regression
Model
• How Bad are the Errors?
Varsha Varde 26
Other Patterns of Regression Curves
• Pattern: Downward Sloping Straight Line
• Statistical Model: Y = a - bX + e (b > 0)
Varsha Varde 27
Other Patterns of Regression Curves
• Pattern: Simple Exponential
Model: Log Y = a + bX + e (b > 0)
• Pattern: Negative Exponential
Model: Log (1/Y) = a + bX + e (b > 0)
• Pattern: Upward Curvilinear
Model: Y = a + b Log X + e (b > 0)
• Pattern: Downward Curvilinear
• Pattern: Logistic or S Curve
Varsha Varde 28
Your Role as a Manager
• Grasp the Situation Thoroughly. (Qualitative)
• Identify Related Cardinal Variables. (DIY)
• Obtain Quantitative Data on Them.
• Draw Scatter Plot. Your Asstt Will Do It For You
• If It Shows a Pattern, Compute Correlation
Coefficient. (Use SPSS or YAWDIFY)
• If It Is High (+ or -), Draw a Free Hand Curve
and Identify the Pattern of Regression Curve.
• Compute Regression Parameters for the Pattern
and Fit Regression Model. (SPSS or YAWDIFY)
Varsha Varde 29
A Word of Caution
• Undertake Regression Analysis Only For
Cardinal Variables.
• Select the Variables Only If You Logically
Suspect Influence of One Over the Other.
• Carry Out Regression Analysis Only After
Completing Correlation Analysis AND
Only If The Selected Cause and Effect
Variables Are Highly Correlated.
Varsha Varde 30
Simple and Multiple Regression
• Simple Regression: One Cause Variable
Influences the Effect Variable.
• This is What We Focused On So Far.
• Regression Models Have a Wide Variety
of Forms and Degrees of Complexity.
• Multiple Regression: Several Cause
Variables Jointly Influence Effect Variable.
Varsha Varde 31
Multiple Regression
• Multiple Regression Analysis is a Method
to Analyze the Effect of Joint Influence of
Many Cause Variables on Effect Variable.
• Multiple Regression Model:
Y = a + b1X1 + b2X2 + - - - - +bnXn + e
• Caution: Cause Variables X1, X2, - - - -, Xn
Should Not Be Inter-Correlated.
• Otherwise You Face Multicollinearity.
Varsha Varde 32
Exercise: Select Cause Variables
Cause # 1
X1
Cause # 2
X2
Cause # 3
X3
Effect
Y
Machine
Downtime
Labour
Absenteeism
Power
Outage
Monthly
Production
EPS ? ? BASF
Share Price
? ? ? MRP
? ? ? Manpower
Requiremt

More Related Content

What's hot

Basics of statistical notation
Basics of statistical notationBasics of statistical notation
Basics of statistical notationmocia76
 
Histogram, Pareto Diagram, Ishikawa Diagram, and Control Chart
Histogram, Pareto Diagram, Ishikawa Diagram, and Control ChartHistogram, Pareto Diagram, Ishikawa Diagram, and Control Chart
Histogram, Pareto Diagram, Ishikawa Diagram, and Control ChartNicola Ergo
 
Data Science - Part IV - Regression Analysis & ANOVA
Data Science - Part IV - Regression Analysis & ANOVAData Science - Part IV - Regression Analysis & ANOVA
Data Science - Part IV - Regression Analysis & ANOVADerek Kane
 
CrashCourse_0622
CrashCourse_0622CrashCourse_0622
CrashCourse_0622Dexen Xi
 
Linear regression
Linear regressionLinear regression
Linear regressionSreerajVA
 
Regression with Time Series Data
Regression with Time Series DataRegression with Time Series Data
Regression with Time Series DataRizano Ahdiat R
 
What is Multiple Linear Regression and How Can it be Helpful for Business Ana...
What is Multiple Linear Regression and How Can it be Helpful for Business Ana...What is Multiple Linear Regression and How Can it be Helpful for Business Ana...
What is Multiple Linear Regression and How Can it be Helpful for Business Ana...Smarten Augmented Analytics
 
Estimating Causal Effects from Observations
Estimating Causal Effects from ObservationsEstimating Causal Effects from Observations
Estimating Causal Effects from ObservationsAntigoni-Maria Founta
 
9 basic seven tools of quality
9 basic seven tools of quality9 basic seven tools of quality
9 basic seven tools of qualitygoldenbull268
 
Simple Correlation : Karl Pearson’s Correlation co- efficient and Spearman’s ...
Simple Correlation : Karl Pearson’s Correlation co- efficient and Spearman’s ...Simple Correlation : Karl Pearson’s Correlation co- efficient and Spearman’s ...
Simple Correlation : Karl Pearson’s Correlation co- efficient and Spearman’s ...RekhaChoudhary24
 
Nonparametric methods and chi square tests (1)
Nonparametric methods and chi square tests (1)Nonparametric methods and chi square tests (1)
Nonparametric methods and chi square tests (1)Shakeel Nouman
 
Spearman’s Rank Correlation Coefficient
Spearman’s Rank Correlation CoefficientSpearman’s Rank Correlation Coefficient
Spearman’s Rank Correlation CoefficientSharlaine Ruth
 
Measure of Dispersion, Range, Mean and Standard Deviation, Correlation and Re...
Measure of Dispersion, Range, Mean and Standard Deviation, Correlation and Re...Measure of Dispersion, Range, Mean and Standard Deviation, Correlation and Re...
Measure of Dispersion, Range, Mean and Standard Deviation, Correlation and Re...Parth Chuahan
 
perfect 7QC Tools in METLIFE Template
perfect 7QC Tools in METLIFE Templateperfect 7QC Tools in METLIFE Template
perfect 7QC Tools in METLIFE Templatemegha G
 
7 qc tools training material[1]
7 qc tools training material[1]7 qc tools training material[1]
7 qc tools training material[1]gurmukh singh
 

What's hot (20)

Basics of statistical notation
Basics of statistical notationBasics of statistical notation
Basics of statistical notation
 
Histogram, Pareto Diagram, Ishikawa Diagram, and Control Chart
Histogram, Pareto Diagram, Ishikawa Diagram, and Control ChartHistogram, Pareto Diagram, Ishikawa Diagram, and Control Chart
Histogram, Pareto Diagram, Ishikawa Diagram, and Control Chart
 
Data Science - Part IV - Regression Analysis & ANOVA
Data Science - Part IV - Regression Analysis & ANOVAData Science - Part IV - Regression Analysis & ANOVA
Data Science - Part IV - Regression Analysis & ANOVA
 
Me ppt
Me pptMe ppt
Me ppt
 
CrashCourse_0622
CrashCourse_0622CrashCourse_0622
CrashCourse_0622
 
Linear regression
Linear regressionLinear regression
Linear regression
 
Regression with Time Series Data
Regression with Time Series DataRegression with Time Series Data
Regression with Time Series Data
 
What is Multiple Linear Regression and How Can it be Helpful for Business Ana...
What is Multiple Linear Regression and How Can it be Helpful for Business Ana...What is Multiple Linear Regression and How Can it be Helpful for Business Ana...
What is Multiple Linear Regression and How Can it be Helpful for Business Ana...
 
Estimating Causal Effects from Observations
Estimating Causal Effects from ObservationsEstimating Causal Effects from Observations
Estimating Causal Effects from Observations
 
9 basic seven tools of quality
9 basic seven tools of quality9 basic seven tools of quality
9 basic seven tools of quality
 
Simple Correlation : Karl Pearson’s Correlation co- efficient and Spearman’s ...
Simple Correlation : Karl Pearson’s Correlation co- efficient and Spearman’s ...Simple Correlation : Karl Pearson’s Correlation co- efficient and Spearman’s ...
Simple Correlation : Karl Pearson’s Correlation co- efficient and Spearman’s ...
 
Measure of Association
Measure of AssociationMeasure of Association
Measure of Association
 
Nonparametric methods and chi square tests (1)
Nonparametric methods and chi square tests (1)Nonparametric methods and chi square tests (1)
Nonparametric methods and chi square tests (1)
 
Measures of Dispersion
Measures of DispersionMeasures of Dispersion
Measures of Dispersion
 
Spearman’s Rank Correlation Coefficient
Spearman’s Rank Correlation CoefficientSpearman’s Rank Correlation Coefficient
Spearman’s Rank Correlation Coefficient
 
statics in research
statics in researchstatics in research
statics in research
 
Measure of Dispersion, Range, Mean and Standard Deviation, Correlation and Re...
Measure of Dispersion, Range, Mean and Standard Deviation, Correlation and Re...Measure of Dispersion, Range, Mean and Standard Deviation, Correlation and Re...
Measure of Dispersion, Range, Mean and Standard Deviation, Correlation and Re...
 
perfect 7QC Tools in METLIFE Template
perfect 7QC Tools in METLIFE Templateperfect 7QC Tools in METLIFE Template
perfect 7QC Tools in METLIFE Template
 
7 qc tools training material[1]
7 qc tools training material[1]7 qc tools training material[1]
7 qc tools training material[1]
 
7 qc tool training
7 qc tool  training7 qc tool  training
7 qc tool training
 

Similar to 13 regression analysis quant-tech-regression

Unit-III Correlation and Regression.pptx
Unit-III Correlation and Regression.pptxUnit-III Correlation and Regression.pptx
Unit-III Correlation and Regression.pptxAnusuya123
 
12 correlation analysis
12 correlation analysis12 correlation analysis
12 correlation analysisPooja Sakhla
 
Regression analysis
Regression analysisRegression analysis
Regression analysisSrikant001p
 
Simple Regression Analysis ch12.pptx
Simple Regression Analysis ch12.pptxSimple Regression Analysis ch12.pptx
Simple Regression Analysis ch12.pptxSoumyaBansal7
 
604_multiplee.ppt
604_multiplee.ppt604_multiplee.ppt
604_multiplee.pptRufesh
 
Regression Analysis.pptx
Regression Analysis.pptxRegression Analysis.pptx
Regression Analysis.pptxShivankAggatwal
 
correlation.pptx
correlation.pptxcorrelation.pptx
correlation.pptxSmHasiv
 
Regression analysis ppt
Regression analysis pptRegression analysis ppt
Regression analysis pptElkana Rorio
 
Unit 1 Correlation- BSRM.pdf
Unit 1 Correlation- BSRM.pdfUnit 1 Correlation- BSRM.pdf
Unit 1 Correlation- BSRM.pdfRavinandan A P
 
4. regression analysis1
4. regression analysis14. regression analysis1
4. regression analysis1Karan Kukreja
 
A presentation for Multiple linear regression.ppt
A presentation for Multiple linear regression.pptA presentation for Multiple linear regression.ppt
A presentation for Multiple linear regression.pptvigia41
 
Stat 1163 -correlation and regression
Stat 1163 -correlation and regressionStat 1163 -correlation and regression
Stat 1163 -correlation and regressionKhulna University
 
Mba2216 week 11 data analysis part 02
Mba2216 week 11 data analysis part 02Mba2216 week 11 data analysis part 02
Mba2216 week 11 data analysis part 02Stephen Ong
 

Similar to 13 regression analysis quant-tech-regression (20)

Lecture 4
Lecture 4Lecture 4
Lecture 4
 
Unit-III Correlation and Regression.pptx
Unit-III Correlation and Regression.pptxUnit-III Correlation and Regression.pptx
Unit-III Correlation and Regression.pptx
 
Simple Linear Regression.pptx
Simple Linear Regression.pptxSimple Linear Regression.pptx
Simple Linear Regression.pptx
 
Simple egression.pptx
Simple egression.pptxSimple egression.pptx
Simple egression.pptx
 
12 correlation analysis
12 correlation analysis12 correlation analysis
12 correlation analysis
 
Regression analysis
Regression analysisRegression analysis
Regression analysis
 
Simple Regression Analysis ch12.pptx
Simple Regression Analysis ch12.pptxSimple Regression Analysis ch12.pptx
Simple Regression Analysis ch12.pptx
 
604_multiplee.ppt
604_multiplee.ppt604_multiplee.ppt
604_multiplee.ppt
 
Regression Analysis.pptx
Regression Analysis.pptxRegression Analysis.pptx
Regression Analysis.pptx
 
correlation.pptx
correlation.pptxcorrelation.pptx
correlation.pptx
 
Regression analysis ppt
Regression analysis pptRegression analysis ppt
Regression analysis ppt
 
Corrleation and regression
Corrleation and regressionCorrleation and regression
Corrleation and regression
 
Unit 1 Correlation- BSRM.pdf
Unit 1 Correlation- BSRM.pdfUnit 1 Correlation- BSRM.pdf
Unit 1 Correlation- BSRM.pdf
 
4. regression analysis1
4. regression analysis14. regression analysis1
4. regression analysis1
 
A presentation for Multiple linear regression.ppt
A presentation for Multiple linear regression.pptA presentation for Multiple linear regression.ppt
A presentation for Multiple linear regression.ppt
 
regression
regressionregression
regression
 
Cmt learning objective 25 - regresseion
Cmt learning objective   25 - regresseionCmt learning objective   25 - regresseion
Cmt learning objective 25 - regresseion
 
Stat 1163 -correlation and regression
Stat 1163 -correlation and regressionStat 1163 -correlation and regression
Stat 1163 -correlation and regression
 
Linear regression
Linear regressionLinear regression
Linear regression
 
Mba2216 week 11 data analysis part 02
Mba2216 week 11 data analysis part 02Mba2216 week 11 data analysis part 02
Mba2216 week 11 data analysis part 02
 

More from Pooja Sakhla

Ibs mmii- sessions-9-10 - copy
Ibs mmii- sessions-9-10 - copyIbs mmii- sessions-9-10 - copy
Ibs mmii- sessions-9-10 - copyPooja Sakhla
 
Ibs mmii- sessions-7-8
Ibs mmii- sessions-7-8Ibs mmii- sessions-7-8
Ibs mmii- sessions-7-8Pooja Sakhla
 
Ibs mmii- sessions-7-8 - copy
Ibs mmii- sessions-7-8 - copyIbs mmii- sessions-7-8 - copy
Ibs mmii- sessions-7-8 - copyPooja Sakhla
 
Ibs mmii- sessions-9-10
Ibs mmii- sessions-9-10Ibs mmii- sessions-9-10
Ibs mmii- sessions-9-10Pooja Sakhla
 
Principles of business writing final
Principles of business writing finalPrinciples of business writing final
Principles of business writing finalPooja Sakhla
 
Chapter26 working capital_management
Chapter26 working capital_managementChapter26 working capital_management
Chapter26 working capital_managementPooja Sakhla
 
Dividends and _dividend_policy_powerpoint_presentation[1]
Dividends and _dividend_policy_powerpoint_presentation[1]Dividends and _dividend_policy_powerpoint_presentation[1]
Dividends and _dividend_policy_powerpoint_presentation[1]Pooja Sakhla
 
Chapter 09 dss-mis-eis-es-ai
Chapter 09 dss-mis-eis-es-aiChapter 09 dss-mis-eis-es-ai
Chapter 09 dss-mis-eis-es-aiPooja Sakhla
 
Chapter 09 dss mis eis es ai
Chapter 09   dss mis eis es aiChapter 09   dss mis eis es ai
Chapter 09 dss mis eis es aiPooja Sakhla
 
Information system pyramid
Information system pyramidInformation system pyramid
Information system pyramidPooja Sakhla
 
Domestic airlines in_india_leveraging_price
Domestic airlines in_india_leveraging_priceDomestic airlines in_india_leveraging_price
Domestic airlines in_india_leveraging_pricePooja Sakhla
 

More from Pooja Sakhla (20)

Ibs mmii- sessions-9-10 - copy
Ibs mmii- sessions-9-10 - copyIbs mmii- sessions-9-10 - copy
Ibs mmii- sessions-9-10 - copy
 
Ibs mmii- sessions-7-8
Ibs mmii- sessions-7-8Ibs mmii- sessions-7-8
Ibs mmii- sessions-7-8
 
Ibs mmii- sessions-7-8 - copy
Ibs mmii- sessions-7-8 - copyIbs mmii- sessions-7-8 - copy
Ibs mmii- sessions-7-8 - copy
 
Ibs mmii- sessions-9-10
Ibs mmii- sessions-9-10Ibs mmii- sessions-9-10
Ibs mmii- sessions-9-10
 
Bc presentation
Bc presentationBc presentation
Bc presentation
 
Report writing
Report writingReport writing
Report writing
 
Claims
ClaimsClaims
Claims
 
Memo
MemoMemo
Memo
 
Meetings
MeetingsMeetings
Meetings
 
Letter writing
Letter writingLetter writing
Letter writing
 
Principles of business writing final
Principles of business writing finalPrinciples of business writing final
Principles of business writing final
 
Chapter26 working capital_management
Chapter26 working capital_managementChapter26 working capital_management
Chapter26 working capital_management
 
Dividends and _dividend_policy_powerpoint_presentation[1]
Dividends and _dividend_policy_powerpoint_presentation[1]Dividends and _dividend_policy_powerpoint_presentation[1]
Dividends and _dividend_policy_powerpoint_presentation[1]
 
Chapter 10 sdlc
Chapter 10 sdlcChapter 10 sdlc
Chapter 10 sdlc
 
Chapter 10 sdlc
Chapter 10   sdlcChapter 10   sdlc
Chapter 10 sdlc
 
Chapter 09 dss-mis-eis-es-ai
Chapter 09 dss-mis-eis-es-aiChapter 09 dss-mis-eis-es-ai
Chapter 09 dss-mis-eis-es-ai
 
Chapter 09 dss mis eis es ai
Chapter 09   dss mis eis es aiChapter 09   dss mis eis es ai
Chapter 09 dss mis eis es ai
 
Chapter 01 intro
Chapter 01 introChapter 01 intro
Chapter 01 intro
 
Information system pyramid
Information system pyramidInformation system pyramid
Information system pyramid
 
Domestic airlines in_india_leveraging_price
Domestic airlines in_india_leveraging_priceDomestic airlines in_india_leveraging_price
Domestic airlines in_india_leveraging_price
 

Recently uploaded

Enhancing Worker Digital Experience: A Hands-on Workshop for Partners
Enhancing Worker Digital Experience: A Hands-on Workshop for PartnersEnhancing Worker Digital Experience: A Hands-on Workshop for Partners
Enhancing Worker Digital Experience: A Hands-on Workshop for PartnersThousandEyes
 
Tech-Forward - Achieving Business Readiness For Copilot in Microsoft 365
Tech-Forward - Achieving Business Readiness For Copilot in Microsoft 365Tech-Forward - Achieving Business Readiness For Copilot in Microsoft 365
Tech-Forward - Achieving Business Readiness For Copilot in Microsoft 3652toLead Limited
 
Kotlin Multiplatform & Compose Multiplatform - Starter kit for pragmatics
Kotlin Multiplatform & Compose Multiplatform - Starter kit for pragmaticsKotlin Multiplatform & Compose Multiplatform - Starter kit for pragmatics
Kotlin Multiplatform & Compose Multiplatform - Starter kit for pragmaticscarlostorres15106
 
08448380779 Call Girls In Civil Lines Women Seeking Men
08448380779 Call Girls In Civil Lines Women Seeking Men08448380779 Call Girls In Civil Lines Women Seeking Men
08448380779 Call Girls In Civil Lines Women Seeking MenDelhi Call girls
 
Azure Monitor & Application Insight to monitor Infrastructure & Application
Azure Monitor & Application Insight to monitor Infrastructure & ApplicationAzure Monitor & Application Insight to monitor Infrastructure & Application
Azure Monitor & Application Insight to monitor Infrastructure & ApplicationAndikSusilo4
 
How to convert PDF to text with Nanonets
How to convert PDF to text with NanonetsHow to convert PDF to text with Nanonets
How to convert PDF to text with Nanonetsnaman860154
 
Benefits Of Flutter Compared To Other Frameworks
Benefits Of Flutter Compared To Other FrameworksBenefits Of Flutter Compared To Other Frameworks
Benefits Of Flutter Compared To Other FrameworksSoftradix Technologies
 
Human Factors of XR: Using Human Factors to Design XR Systems
Human Factors of XR: Using Human Factors to Design XR SystemsHuman Factors of XR: Using Human Factors to Design XR Systems
Human Factors of XR: Using Human Factors to Design XR SystemsMark Billinghurst
 
FULL ENJOY 🔝 8264348440 🔝 Call Girls in Diplomatic Enclave | Delhi
FULL ENJOY 🔝 8264348440 🔝 Call Girls in Diplomatic Enclave | DelhiFULL ENJOY 🔝 8264348440 🔝 Call Girls in Diplomatic Enclave | Delhi
FULL ENJOY 🔝 8264348440 🔝 Call Girls in Diplomatic Enclave | Delhisoniya singh
 
Beyond Boundaries: Leveraging No-Code Solutions for Industry Innovation
Beyond Boundaries: Leveraging No-Code Solutions for Industry InnovationBeyond Boundaries: Leveraging No-Code Solutions for Industry Innovation
Beyond Boundaries: Leveraging No-Code Solutions for Industry InnovationSafe Software
 
08448380779 Call Girls In Friends Colony Women Seeking Men
08448380779 Call Girls In Friends Colony Women Seeking Men08448380779 Call Girls In Friends Colony Women Seeking Men
08448380779 Call Girls In Friends Colony Women Seeking MenDelhi Call girls
 
Pigging Solutions Piggable Sweeping Elbows
Pigging Solutions Piggable Sweeping ElbowsPigging Solutions Piggable Sweeping Elbows
Pigging Solutions Piggable Sweeping ElbowsPigging Solutions
 
08448380779 Call Girls In Diplomatic Enclave Women Seeking Men
08448380779 Call Girls In Diplomatic Enclave Women Seeking Men08448380779 Call Girls In Diplomatic Enclave Women Seeking Men
08448380779 Call Girls In Diplomatic Enclave Women Seeking MenDelhi Call girls
 
My Hashitalk Indonesia April 2024 Presentation
My Hashitalk Indonesia April 2024 PresentationMy Hashitalk Indonesia April 2024 Presentation
My Hashitalk Indonesia April 2024 PresentationRidwan Fadjar
 
Understanding the Laravel MVC Architecture
Understanding the Laravel MVC ArchitectureUnderstanding the Laravel MVC Architecture
Understanding the Laravel MVC ArchitecturePixlogix Infotech
 
Presentation on how to chat with PDF using ChatGPT code interpreter
Presentation on how to chat with PDF using ChatGPT code interpreterPresentation on how to chat with PDF using ChatGPT code interpreter
Presentation on how to chat with PDF using ChatGPT code interpreternaman860154
 
Breaking the Kubernetes Kill Chain: Host Path Mount
Breaking the Kubernetes Kill Chain: Host Path MountBreaking the Kubernetes Kill Chain: Host Path Mount
Breaking the Kubernetes Kill Chain: Host Path MountPuma Security, LLC
 
#StandardsGoals for 2024: What’s new for BISAC - Tech Forum 2024
#StandardsGoals for 2024: What’s new for BISAC - Tech Forum 2024#StandardsGoals for 2024: What’s new for BISAC - Tech Forum 2024
#StandardsGoals for 2024: What’s new for BISAC - Tech Forum 2024BookNet Canada
 

Recently uploaded (20)

Enhancing Worker Digital Experience: A Hands-on Workshop for Partners
Enhancing Worker Digital Experience: A Hands-on Workshop for PartnersEnhancing Worker Digital Experience: A Hands-on Workshop for Partners
Enhancing Worker Digital Experience: A Hands-on Workshop for Partners
 
Tech-Forward - Achieving Business Readiness For Copilot in Microsoft 365
Tech-Forward - Achieving Business Readiness For Copilot in Microsoft 365Tech-Forward - Achieving Business Readiness For Copilot in Microsoft 365
Tech-Forward - Achieving Business Readiness For Copilot in Microsoft 365
 
Kotlin Multiplatform & Compose Multiplatform - Starter kit for pragmatics
Kotlin Multiplatform & Compose Multiplatform - Starter kit for pragmaticsKotlin Multiplatform & Compose Multiplatform - Starter kit for pragmatics
Kotlin Multiplatform & Compose Multiplatform - Starter kit for pragmatics
 
08448380779 Call Girls In Civil Lines Women Seeking Men
08448380779 Call Girls In Civil Lines Women Seeking Men08448380779 Call Girls In Civil Lines Women Seeking Men
08448380779 Call Girls In Civil Lines Women Seeking Men
 
E-Vehicle_Hacking_by_Parul Sharma_null_owasp.pptx
E-Vehicle_Hacking_by_Parul Sharma_null_owasp.pptxE-Vehicle_Hacking_by_Parul Sharma_null_owasp.pptx
E-Vehicle_Hacking_by_Parul Sharma_null_owasp.pptx
 
Azure Monitor & Application Insight to monitor Infrastructure & Application
Azure Monitor & Application Insight to monitor Infrastructure & ApplicationAzure Monitor & Application Insight to monitor Infrastructure & Application
Azure Monitor & Application Insight to monitor Infrastructure & Application
 
How to convert PDF to text with Nanonets
How to convert PDF to text with NanonetsHow to convert PDF to text with Nanonets
How to convert PDF to text with Nanonets
 
Benefits Of Flutter Compared To Other Frameworks
Benefits Of Flutter Compared To Other FrameworksBenefits Of Flutter Compared To Other Frameworks
Benefits Of Flutter Compared To Other Frameworks
 
Human Factors of XR: Using Human Factors to Design XR Systems
Human Factors of XR: Using Human Factors to Design XR SystemsHuman Factors of XR: Using Human Factors to Design XR Systems
Human Factors of XR: Using Human Factors to Design XR Systems
 
Vulnerability_Management_GRC_by Sohang Sengupta.pptx
Vulnerability_Management_GRC_by Sohang Sengupta.pptxVulnerability_Management_GRC_by Sohang Sengupta.pptx
Vulnerability_Management_GRC_by Sohang Sengupta.pptx
 
FULL ENJOY 🔝 8264348440 🔝 Call Girls in Diplomatic Enclave | Delhi
FULL ENJOY 🔝 8264348440 🔝 Call Girls in Diplomatic Enclave | DelhiFULL ENJOY 🔝 8264348440 🔝 Call Girls in Diplomatic Enclave | Delhi
FULL ENJOY 🔝 8264348440 🔝 Call Girls in Diplomatic Enclave | Delhi
 
Beyond Boundaries: Leveraging No-Code Solutions for Industry Innovation
Beyond Boundaries: Leveraging No-Code Solutions for Industry InnovationBeyond Boundaries: Leveraging No-Code Solutions for Industry Innovation
Beyond Boundaries: Leveraging No-Code Solutions for Industry Innovation
 
08448380779 Call Girls In Friends Colony Women Seeking Men
08448380779 Call Girls In Friends Colony Women Seeking Men08448380779 Call Girls In Friends Colony Women Seeking Men
08448380779 Call Girls In Friends Colony Women Seeking Men
 
Pigging Solutions Piggable Sweeping Elbows
Pigging Solutions Piggable Sweeping ElbowsPigging Solutions Piggable Sweeping Elbows
Pigging Solutions Piggable Sweeping Elbows
 
08448380779 Call Girls In Diplomatic Enclave Women Seeking Men
08448380779 Call Girls In Diplomatic Enclave Women Seeking Men08448380779 Call Girls In Diplomatic Enclave Women Seeking Men
08448380779 Call Girls In Diplomatic Enclave Women Seeking Men
 
My Hashitalk Indonesia April 2024 Presentation
My Hashitalk Indonesia April 2024 PresentationMy Hashitalk Indonesia April 2024 Presentation
My Hashitalk Indonesia April 2024 Presentation
 
Understanding the Laravel MVC Architecture
Understanding the Laravel MVC ArchitectureUnderstanding the Laravel MVC Architecture
Understanding the Laravel MVC Architecture
 
Presentation on how to chat with PDF using ChatGPT code interpreter
Presentation on how to chat with PDF using ChatGPT code interpreterPresentation on how to chat with PDF using ChatGPT code interpreter
Presentation on how to chat with PDF using ChatGPT code interpreter
 
Breaking the Kubernetes Kill Chain: Host Path Mount
Breaking the Kubernetes Kill Chain: Host Path MountBreaking the Kubernetes Kill Chain: Host Path Mount
Breaking the Kubernetes Kill Chain: Host Path Mount
 
#StandardsGoals for 2024: What’s new for BISAC - Tech Forum 2024
#StandardsGoals for 2024: What’s new for BISAC - Tech Forum 2024#StandardsGoals for 2024: What’s new for BISAC - Tech Forum 2024
#StandardsGoals for 2024: What’s new for BISAC - Tech Forum 2024
 

13 regression analysis quant-tech-regression

  • 2. Quantitative Methods Models for Data Analysis & Interpretation: Regression Analysis
  • 3. Varsha Varde 3 Cause and Effect The Present Contains Nothing More Than The Past, and What Is Found In The Effect Was Already In The Cause. - Henri Bergson (19th Century French Philosopher)
  • 4. Varsha Varde 4 Regression Model • A Statistical Model which Depicts the Influence of One Cardinal Variable (The Cause) on Another Cardinal Variable (The Effect). • These Models Have a Wide Variety of Forms and Degrees of Complexity.
  • 5. Varsha Varde 5 Regression • The Step Logically Next To Correlation. • Situation: Usually, Correlation Between Two Variables Is Not Mere Benign Association. But, It Is In Fact Causation. • It Is a Cause and Effect Relationship, Where X Influences Y. • X is the Cause Variable. • Y is the Effect Variable.
  • 6. Varsha Varde 6 Some Examples Cause Effect Movie Ticket Price Multiplex Occupancy Machine Downtime Production Rainfall at Night Absenteeism Next Day R&D Expenditure Gross Profit ? ?
  • 7. Varsha Varde 7 Regression • Dictionary Says: The Act of Returning or Stepping Back to a Previous Stage. • Query: Do Quantitative Methods Force Us to Regress instead of Progress? • Or, Is It Back to the Future? • Answer: Statistics, Like Any Other Field, Adopts Crazy Names Arising from Some Important Historical Events. • Soap Opera.
  • 8. Varsha Varde 8 Story of Regression • Sir Francis Galton Studied the Heights of the Sons in Relation to the Heights of Their Fathers. • His Conclusion: Sons of Tall Fathers Were Not So Tall and Sons of Short Fathers Were Not So Short as their Fathers. • Path Breaking Finding: Human Heights Tend To Regress Back To Normalcy.
  • 9. Varsha Varde 9 Evolution of the Term ‘Regression’ • Since Then (1880), Similar Studies on Nature and Extent of Influence of One or More Variables on Some Other Variable Acquired the Name ‘Regression Analysis’. • In Quantitative Methods, Regression Means a ‘Cause and Effect Relationship’. • Cause Variable = Independent Variable • Effect Variable = Dependent Variable
  • 10. Varsha Varde 10 Scatter Plot Horizontal Axis: Reasoning Scores Vertical Axis: Creativity Scores
  • 11. Varsha Varde 11 Scatter Plot Horizontal Axis: Cause Variable: Reasoning Scores Vertical Axis: Effect Variable: Creativity Scores
  • 12. Varsha Varde 12 Regression Curve Horizontal Axis: Cause Variable: Reasoning Scores Vertical Axis: Effect Variable: Creativity Scores
  • 13. Varsha Varde 13 Regression Analysis • A Quantitative Method which Tries to Estimate the Value of a Cardinal Variable (the Effect) by Studying Its Relationship with Other Cardinal Variables (the Cause). • This Relationship is Expressed by a Custom-Designed Statistical Formula Called Regression Equation.
  • 14. Varsha Varde 14 Purpose of Regression Analysis 1. To Establish Exact Nature of Influence of Cause Variable on Effect Variable. 2. To Determine the Quantum of Influence. 3. To Estimate an Unknown Value of Effect Variable from Value of Cause Variable. 4. To Forecast Future Values of Effect Variable from Info about Cause Variable
  • 15. Varsha Varde 15 Patterns of Regression Curves • Pattern: Upward Sloping Straight Line • Mathematical Model: Y = a + bX (b > 0)
  • 16. Varsha Varde 16 Estimating Regression Parameters a & b • Formula for Regression Coefficient b : Mean of Products of Values – Product of the Two Means = -------------------------------------------------------------------------- Variance of Cause Variable • Formula for Regression Constant a : a = Mean of Effect Variable Minus b times Mean of Cause Variable • Don’t Worry. This is the Job of SPSS.
  • 17. Varsha Varde 17 Estimating Correlation Coefficient • Recall the Formula for Correlation Coeff. • Pearson’s Correlation Coefficient • Formula: Mean of Products of Values – Product of the Two Means = -------------------------------------------------------------------------- Product of the Two Standard Deviations • Spot the Similarity and the Difference.
  • 18. Varsha Varde 18 A Simple Example Empl. No. Yrs in Co. Salary (‘000) Product 1 2 25 50 2 3 30 90 3 5 37 185 4 7 38 266 5 8 40 320 Total 25 170 911 Arith Mean 5 34 Std. Dev. 2.3 5.6
  • 19. Varsha Varde 19 Regression Model • Formula for Regression Coefficient b : Mean of Products of Values – Product of the Two Means = -------------------------------------------------------------------------- Variance of Cause Variable (911 / 5) – (5 x 34) 182.2 – 170 12.2 = ----------------------- = ------------- = ----------- = 2.30 2.3 x 2.3 5.3 5.3 • Formula for Regression Constant a : a = Mean of Effect Variable Minus b times Mean of Cause Variable = 34 – 2.3 x 5 = 22.5 • Regression Model: Y = 22.5 + 2.3 X
  • 20. Varsha Varde 20 Check Goodness of the Model Empl. No. Yrs in Co. Salary (‘000) Estimate 1 2 25 2 3 30 3 5 37 4 7 38 5 8 40 Total 25 170 Arith Mean 5 34 Std. Dev. 2.3 5.6
  • 21. Varsha Varde 21 Check Goodness of the Model Empl. No. Yrs in Co. Salary (‘000) Estimate 1 2 25 27.1 2 3 30 29.4 3 5 37 34.0 4 7 38 38.6 5 8 40 40.9 Total 25 170 170 Arith Mean 5 34 Std. Dev. 2.3 5.6
  • 22. Varsha Varde 22 Concept: Error of Estimation • Note the Difference Between the Actual Values of Effect Variable (Salary) and the Values Estimated by the Regression Model • This is the Error of Estimation • Less the Error, Better the Model. Ideally 0. • Statistical Model: Y = a + b X + e • If Correlation is Perfect (+1 or -1), e = 0.
  • 23. Given below are five observations collected in a regression study on two variables, x (independent variable) and y (dependent variable). x y 2 4 3 4 4 3 5 2 6 1 a. Develop the least squares estimated regression equation. b. Estimate value of y for x=7.Varsha Varde 23 Q5.
  • 24. Varsha Varde 24 Exercise: Fit a Regression Model to Reasoning & Creativity Scores Apl No, RsnSc CrvSc Apl No, RsnSc CrvSc 01 15.2 11.9 11 8.1 6.8 02 9.9 13.1 12 15.2 13.0 03 7.1 8.9 13 10.9 13.9 04 17.9 17.4 14 17.2 19.1 05 5.1 6.9 15 8.2 10.1 06 10.0 8.8 16 10.8 15.9 07 7.2 14.0 17 12.0 12.1 08 17.1 15.8 18 13.1 16.0 09 15.2 9.7 19 17.9 19.2 10 9.2 12.1 20 7.1 11.9
  • 25. Varsha Varde 25 Exercise • Does Your Model Look Like What I Got?: Creativity Scores = 5.23 + 0.65 x Reasoning Scores + e • Test the Goodness of Your Regression Model • How Bad are the Errors?
  • 26. Varsha Varde 26 Other Patterns of Regression Curves • Pattern: Downward Sloping Straight Line • Statistical Model: Y = a - bX + e (b > 0)
  • 27. Varsha Varde 27 Other Patterns of Regression Curves • Pattern: Simple Exponential Model: Log Y = a + bX + e (b > 0) • Pattern: Negative Exponential Model: Log (1/Y) = a + bX + e (b > 0) • Pattern: Upward Curvilinear Model: Y = a + b Log X + e (b > 0) • Pattern: Downward Curvilinear • Pattern: Logistic or S Curve
  • 28. Varsha Varde 28 Your Role as a Manager • Grasp the Situation Thoroughly. (Qualitative) • Identify Related Cardinal Variables. (DIY) • Obtain Quantitative Data on Them. • Draw Scatter Plot. Your Asstt Will Do It For You • If It Shows a Pattern, Compute Correlation Coefficient. (Use SPSS or YAWDIFY) • If It Is High (+ or -), Draw a Free Hand Curve and Identify the Pattern of Regression Curve. • Compute Regression Parameters for the Pattern and Fit Regression Model. (SPSS or YAWDIFY)
  • 29. Varsha Varde 29 A Word of Caution • Undertake Regression Analysis Only For Cardinal Variables. • Select the Variables Only If You Logically Suspect Influence of One Over the Other. • Carry Out Regression Analysis Only After Completing Correlation Analysis AND Only If The Selected Cause and Effect Variables Are Highly Correlated.
  • 30. Varsha Varde 30 Simple and Multiple Regression • Simple Regression: One Cause Variable Influences the Effect Variable. • This is What We Focused On So Far. • Regression Models Have a Wide Variety of Forms and Degrees of Complexity. • Multiple Regression: Several Cause Variables Jointly Influence Effect Variable.
  • 31. Varsha Varde 31 Multiple Regression • Multiple Regression Analysis is a Method to Analyze the Effect of Joint Influence of Many Cause Variables on Effect Variable. • Multiple Regression Model: Y = a + b1X1 + b2X2 + - - - - +bnXn + e • Caution: Cause Variables X1, X2, - - - -, Xn Should Not Be Inter-Correlated. • Otherwise You Face Multicollinearity.
  • 32. Varsha Varde 32 Exercise: Select Cause Variables Cause # 1 X1 Cause # 2 X2 Cause # 3 X3 Effect Y Machine Downtime Labour Absenteeism Power Outage Monthly Production EPS ? ? BASF Share Price ? ? ? MRP ? ? ? Manpower Requiremt