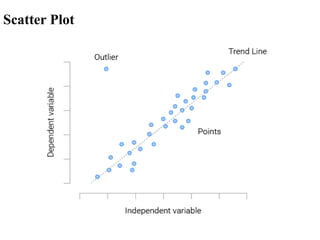
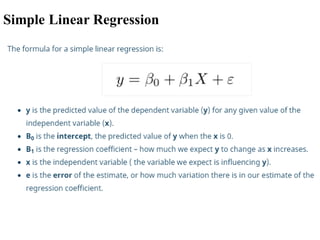
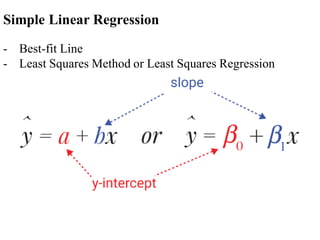
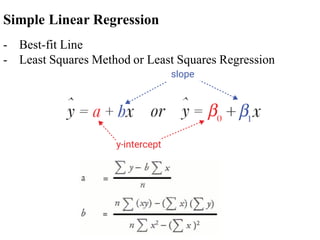
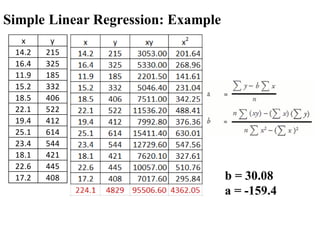
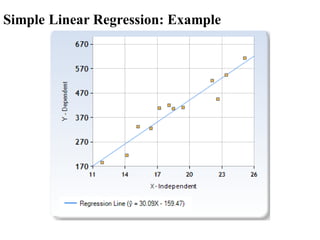
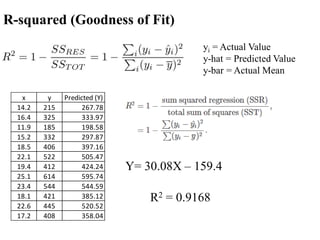
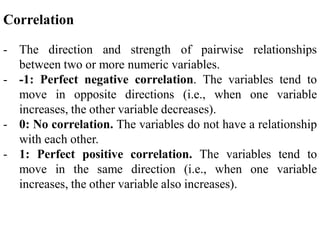
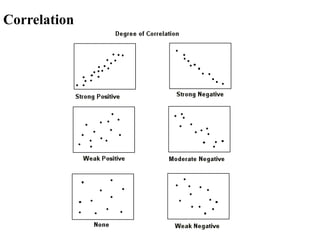
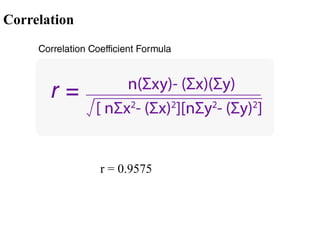
Introduction to Data Science
Dr. Irfan Yousuf
Department of Computer Science (New Campus)
UET, Lahore
(Lecture # 5; September 21, 2022)
Outline
•Linear Regression Analysis
Relations Between Variables
•Functional Relation
•Statistical Relation
Functional Relation
•A functional relation between two variables is a perfect
relation where the value of the dependent variable is
uniquely determined by the value of the independent
variable.
•It is expressed by a mathematical formula.
Functional Relation
Statistical Relation
•A statistical relation between two variables is a relation
where the value of the dependent variable is NOT
uniquely determined when the level of the independent
variable is specified.
•If the values of a variable Y increase or decrease when the
values of a variable X change, there is a statistical
relationship between Variable Y and Variable X.
•It is not an exact relation.
• Examples:
• The relation between age and income
• The relation between income and expenditures
Statistical Relation
Scatter Plot
•A scatter plot (aka scatter chart, scatter graph) uses dots to
represent values for two different numeric variables.
•The position of each dot on the horizontal and vertical axis
indicates values for an individual data point.
•Scatter plots are used to observe relationships between
variables.
Scatter Plot
Regression Analysis
•Regression analysis provides a method of estimating an
average relation (often linear) between two or more variables.
•Regressor: The variable that forms the basis of estimation or
prediction (aka predictor variable or independent variable).
•Regressand: The variable whose value depend on the
independent variable is called a regressand (aka response
variable, predictand variable or dependent variable).
Regression Models
•Regression models describe the relationship between
variables by fitting a line to the observed data.
•Linear regression models use a straight line, while logistic
and nonlinear regression models use a curved line.
• Regression allows you to estimate how a dependent variable
changes as the independent variable(s) change.
Simple Linear Regression
- Best-fit Line
- Least Squares Method or Least Squares Regression
Simple Linear Regression
- Best-fit Line
- Least Squares Method or Least Squares Regression
Simple Linear Regression: Example
x y
14.2 215
16.4 325
11.9 185
15.2 332
18.5 406
22.1 522
19.4 412
25.1 614
23.4 544
18.1 421
22.6 445
17.2 408 b = 30.08
a = -159.4
Simple Linear Regression: Example
Residuals
- The residuals are the differences between the observed and
predicted values.
- It measures the distance from the regression line (predicted
value) and the actual observed value. In other words, it
helps us to measure error, or how well our regression line
“fits” our data.
Outliers
R-squared (Goodness of Fit)
- After fitting a linear regression model, you need to
determine how well the model fits the data.
- R-squared is a goodness-of-fit measure for linear
regression models.
- This statistic indicates the percentage of the variance in
the dependent variable that the independent variables
explain collectively (or that is predictable from the
independent variable).
- R-squared measures the strength of the relationship
between your model and the dependent variable on a
convenient 0 – 100% scale.
- It is also called Coefficient of Determination.
R-squared (Goodness of Fit)
x y Predicted (Y)
14.2 215 267.78
16.4 325 333.97
11.9 185 198.58
15.2 332 297.87
18.5 406 397.16
22.1 522 505.47
19.4 412 424.24
25.1 614 595.74
23.4 544 544.59
18.1 421 385.12
22.6 445 520.52
17.2 408 358.04
Y= 30.08X – 159.4
R2 = 0.9168
yi = Actual Value
y-hat = Predicted Value
y-bar = Actual Mean
Correlation
- The direction and strength of pairwise relationships
between two or more numeric variables.
- -1: Perfect negative correlation. The variables tend to
move in opposite directions (i.e., when one variable
increases, the other variable decreases).
- 0: No correlation. The variables do not have a relationship
with each other.
- 1: Perfect positive correlation. The variables tend to
move in the same direction (i.e., when one variable
increases, the other variable also increases).
Correlation
Correlation
r = 0.9575
How to Interpret Correlation?
- Strength: The greater the absolute value of the correlation
coefficient, the stronger the relationship.
- Direction: The sign of the correlation coefficient
represents the direction of the relationship.
How to Interpret Correlation?
- The correlation, denoted by r, measures the amount of
linear association between two variables.
- r is always between -1 and 1 inclusive.
- The R-squared value, denoted by R2, is the square of the
correlation. It measures the proportion of variation in
the dependent variable that can be attributed to the
independent variable.
- The R-squared value R2 is always between 0 and 1
inclusive.
Correlation vs. Regression
- Correlation is a statistical measure that quantifies the
direction and strength of the relationship between two
numeric variables.
- Regression is a statistical technique that predicts the value
of the dependent variable Y based on the known value of
the independent variable X through an equation.
Drawbacks of Linear Regression
- Linear regression only looks at linear relationships between
dependent and independent variables.
- Linear regression looks at a relationship between the mean
of the dependent variable and the independent variables.
- Linear regression is sensitive to outliers
Summary
•Regression Analysis

IDS.pdf

  • 1.
    Introduction to DataScience Dr. Irfan Yousuf Department of Computer Science (New Campus) UET, Lahore (Lecture # 5; September 21, 2022)
  • 2.
  • 3.
    Relations Between Variables •FunctionalRelation •Statistical Relation
  • 4.
    Functional Relation •A functionalrelation between two variables is a perfect relation where the value of the dependent variable is uniquely determined by the value of the independent variable. •It is expressed by a mathematical formula.
  • 5.
  • 6.
    Statistical Relation •A statisticalrelation between two variables is a relation where the value of the dependent variable is NOT uniquely determined when the level of the independent variable is specified. •If the values of a variable Y increase or decrease when the values of a variable X change, there is a statistical relationship between Variable Y and Variable X. •It is not an exact relation. • Examples: • The relation between age and income • The relation between income and expenditures
  • 7.
  • 8.
    Scatter Plot •A scatterplot (aka scatter chart, scatter graph) uses dots to represent values for two different numeric variables. •The position of each dot on the horizontal and vertical axis indicates values for an individual data point. •Scatter plots are used to observe relationships between variables.
  • 9.
  • 10.
    Regression Analysis •Regression analysisprovides a method of estimating an average relation (often linear) between two or more variables. •Regressor: The variable that forms the basis of estimation or prediction (aka predictor variable or independent variable). •Regressand: The variable whose value depend on the independent variable is called a regressand (aka response variable, predictand variable or dependent variable).
  • 11.
    Regression Models •Regression modelsdescribe the relationship between variables by fitting a line to the observed data. •Linear regression models use a straight line, while logistic and nonlinear regression models use a curved line. • Regression allows you to estimate how a dependent variable changes as the independent variable(s) change.
  • 12.
  • 13.
    Simple Linear Regression -Best-fit Line - Least Squares Method or Least Squares Regression
  • 14.
    Simple Linear Regression -Best-fit Line - Least Squares Method or Least Squares Regression
  • 15.
    Simple Linear Regression:Example x y 14.2 215 16.4 325 11.9 185 15.2 332 18.5 406 22.1 522 19.4 412 25.1 614 23.4 544 18.1 421 22.6 445 17.2 408 b = 30.08 a = -159.4
  • 16.
  • 17.
    Residuals - The residualsare the differences between the observed and predicted values. - It measures the distance from the regression line (predicted value) and the actual observed value. In other words, it helps us to measure error, or how well our regression line “fits” our data.
  • 18.
  • 19.
    R-squared (Goodness ofFit) - After fitting a linear regression model, you need to determine how well the model fits the data. - R-squared is a goodness-of-fit measure for linear regression models. - This statistic indicates the percentage of the variance in the dependent variable that the independent variables explain collectively (or that is predictable from the independent variable). - R-squared measures the strength of the relationship between your model and the dependent variable on a convenient 0 – 100% scale. - It is also called Coefficient of Determination.
  • 20.
    R-squared (Goodness ofFit) x y Predicted (Y) 14.2 215 267.78 16.4 325 333.97 11.9 185 198.58 15.2 332 297.87 18.5 406 397.16 22.1 522 505.47 19.4 412 424.24 25.1 614 595.74 23.4 544 544.59 18.1 421 385.12 22.6 445 520.52 17.2 408 358.04 Y= 30.08X – 159.4 R2 = 0.9168 yi = Actual Value y-hat = Predicted Value y-bar = Actual Mean
  • 21.
    Correlation - The directionand strength of pairwise relationships between two or more numeric variables. - -1: Perfect negative correlation. The variables tend to move in opposite directions (i.e., when one variable increases, the other variable decreases). - 0: No correlation. The variables do not have a relationship with each other. - 1: Perfect positive correlation. The variables tend to move in the same direction (i.e., when one variable increases, the other variable also increases).
  • 22.
  • 23.
  • 24.
    How to InterpretCorrelation? - Strength: The greater the absolute value of the correlation coefficient, the stronger the relationship. - Direction: The sign of the correlation coefficient represents the direction of the relationship.
  • 25.
    How to InterpretCorrelation? - The correlation, denoted by r, measures the amount of linear association between two variables. - r is always between -1 and 1 inclusive. - The R-squared value, denoted by R2, is the square of the correlation. It measures the proportion of variation in the dependent variable that can be attributed to the independent variable. - The R-squared value R2 is always between 0 and 1 inclusive.
  • 26.
    Correlation vs. Regression -Correlation is a statistical measure that quantifies the direction and strength of the relationship between two numeric variables. - Regression is a statistical technique that predicts the value of the dependent variable Y based on the known value of the independent variable X through an equation.
  • 27.
    Drawbacks of LinearRegression - Linear regression only looks at linear relationships between dependent and independent variables. - Linear regression looks at a relationship between the mean of the dependent variable and the independent variables. - Linear regression is sensitive to outliers
  • 28.