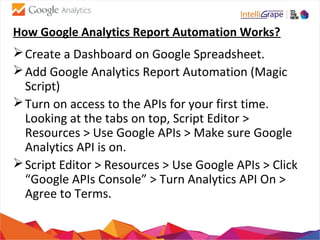
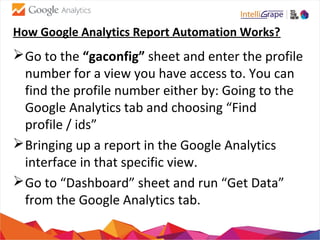
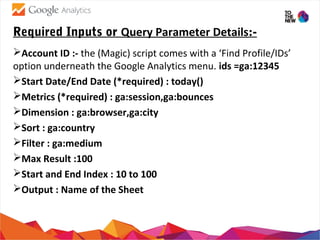
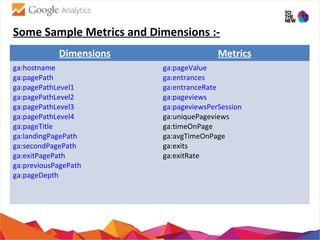
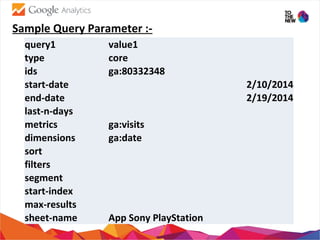
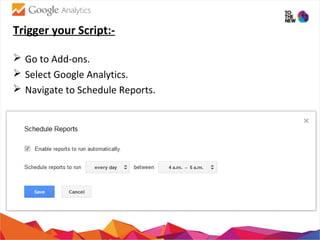
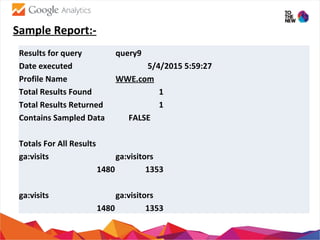
Google Analytics Report Automation (Magic) is an integration that reduces the work required to put Google Analytics data into any Apps Script supported product, such as Google Docs, Sites, or Spreadsheets.
HOW TO USE GOOGLE ANALYTICS BEHAVIOR TO OPTIMIZE YOUR CONTENTJoseph Rivera
Do you want to know what content or ad campaign performs best on your website? Do you want to know the reaction of your visitors?
Knowing the manner in which your visitors move through your website and the way they interact with your content lets you optimize your website performance and conversions. Having said this, it is necessary to know Google Analytics Behavior Application. Its report helps you evaluate the performance of your content and the actions visitors take on your website. To be more specific, it informs you what pages people visit and what actions they take while visiting.
This application has ten sections. Each section has its unique features but are connected and interrelated with those of others. This tutorial helps you understand the function of this application, and how can this be so functional and material to your business.
To sum it all, this application can help you gain an insight with regard to your top pages and top event interactions. It helps you improve your conversion rates.
Google analytic best website performance checker tool, get complete guide information on website with Google analytics tool for better results and for complete check on information.
Google Analytics plays an important role in making important business decisions. 'Introduction to Google Analytics' sheds light on basics of Analytics and it's setup.
A basic overview of Google Analytics. The slide talks about how google analytics can help track key information such as visits, unique visitors, pageviews, traffic sources for your website.
It also talks about important features of google analytics such as goals & a brief about account, property & profile views.
Lunch and learn presentation given to the Social Media Association of Michigan on March 15, 2017 at TechTown Detroit. Basics of Google Analytics, as well as other data available in Google Search Console and Google Data Studio.
Google analytics behavior report - LetsDigital With Mahesh GangurdeMahesh Gangurde
Learn Google Analytics Behavior Report. This Reports Let You Assess the performance of your content and the action visitors take on your website. for more details visit http://www.letsdigital.co.in
The basics (and best bits) of Google Analytics - 2017 Edition Adam Vincenzini
This top line mini-guide provides readers with a jargon-free summary of Google Analytics in 2017 and how to get started with it as a tool. It is recommended for newbies and beginners.
To know more about web analytics and internet marketing log on to:
http://www.iexpertsforum.com/smf/index.php
Web analytics is the measurement, collection, analysis and reporting of internet data for purposes of understanding and optimizing web usage.
To assess the performance and to improve your website , it is imperative that you understand the key performance indicators of your site like the traffic, hits, and many more concepts.
Web analytics help you in having a thorough analysis, of how your site is performing which helps you to optimize your site to suit your needs as well as your customer's and clients.
I delivered this presentation to MSc Digital Marketing class of "The UCD Michael Smurfit Graduate Business School - University College Dublin" in February 2015.
The presentation covers some basics and fundamental information about Google Analytics.
Is your company starting to implement online marketing strategies such as SEO, PPC or social media? If this is the case, are you tracking your efforts through a web analytics platform like Google Analytics? If not, you may be wasting your time as you have no idea which strategies are driving traffic and converting visitors to leads or sales. If you are utilizing Google Analytics, what metrics are you looking at to determine campaign effectiveness? This presentation will provide info on the following: Google Analytics setup, advanced reporting features and reports offered by Google's free analytics platform. Learn how to measure your efforts, and better understand what success looks like.
This is EXTREMELY DATED. I performed this prior to 2010 and much of the data is no longer valid. Please contact me to receive a FREE Google Analytics Audit.
NOTE: Concentrates on data collection and value definition ... not feature sets. This PPT combines analysis provided from Google Analytics and WebTrends Analytics for the same data.
A tutorial on Google Analytics 2017 melvinreceno the magnificentMelvin Receno
This tutorial show how using Google Analytics on a Weebly page benefits companies small and large alike in analyzing how engaged their customers are with their website. It explains briefly the ABC cycle basics going deeper into each report category and finally discussing the most common report viewed as the audience overview.
Learn more about Google Analytics, how to create a google analytics account, how to read google analytics metrics, how to navigate the google analytics console. Reference is the Google Analytics Demo Account. Google Analytics is a free analytical tool for measuring the performance of a website, blog, mobile app, or an e-commerce site.
an overview of data analytics techniques and technologies that is necessary for any digital marketer. for more information about digital marketing please contact: mnabizadeh@aut.ac.ir
This presentation covers methods to set up Google Analytics on your website. It also includes basic terminologies / jargons / concepts that are used throughout Google Analytics
Google Analytics (GA) is a Web Analytic tool, that helps a user analyze the traffic to their website site. It is free, requires no installation and easy to setup. This presentation illustrates how to setup an account, understand how GA works, the dashboard, Key Performance Index (KPI), and Balance Score Card (BSC).
Download "A brief introduction to the technical implementation of Google Analytics". Thanks for your interest in this presentation. I tried to enable the download for the presentation several times, but it just doesn't seem to work.
As an alternative, you can now download the Google Analytics presentation at http://www.queromediashare.com/presentation/Google%20Analytics.ppt
Have fun with it!
What Is Google Analytics Audience Report - Mahesh GangurdeMahesh Gangurde
Are you looking for leads? What about newsletter signups? Do you have a site that sells ad space by the page view? Whatever keeps the lights on is what you want to track. If you’re just starting, keep it simple and focus on a single goal. Use Google Analytics With Mahesh Gangude
This deck is for a SEO website audit and strategic plan to improve your organic search engine results pages and visitors to your website. This program is offered by Anthony Ragland, an SEO Consultant in Atlanta, Georgia for over 15 years.
This "real" example of a SEO / Search Engine Optimization Report identifies website topics of interest for high ranking results in the SERPS: ie - SITE Title, meta information(mainly description), PR, crawled date, indexed pages, amount of back links, 301 re-directs or not, use of analytic programs, Alexa, diggs, etc. Again - this analysis points out areas of interest when it comes to your WEBSITE search engine optimization Effectiveness.
A Website Analysis SEO Report. Full view of private details outlining 40 search engine ranking factors. Google SEO tips offered for the first time from SEO Expert, Randi Thornton. Website report is now open to the public.
AuroIN creates "Website analysis report" which consists deep analysis on the On-site, On-page, Off-page factors, proposed list of keywords, proposed changes, proposed plan of action, SEO pricing and features.
I had a short seminar/class about Cohort analysis on Google Analytics, was able to share my knowledge about it with a couple of intellectual colleagues.
Google Analytics can help you understand what content is getting traction: what gets viewed, what sends traffic and what converts to action.. Dana Chinn, web analytics lecturer at Annanberg USC and Sally Falkow, President of PRESSfeed, the social online newsroom, cover the top10 Google Analytics reports.
SEO Service Corp (SSC) provides free preliminary SEO audit reports of websites upon request. The report is worth $799 in the market. Here is a sample audit report for reference. Visit our website to request a free audit report of your website and identify opportunities for enhancing your visibility.
Google Analytics 101 provides an introductory lesson on features of Google Analytics including Audience, Behavior, Conversion and A/B Testing. If you are considering a website redesign, you should review this to get familiar with how to integrate analytics. Check out http://insivia.com to learn more.
Looking for Digital Marketing services? Look no where coz we are here to help you with all your requirements. iBraine is a one stop shop for all online services like Search Engine Optimization, Pay Per Click, Social Media Optimization, Google Analytics, Affiliate Marketing, Website Designing and Development, Online Reputation Management etc.
Google Analytics with an Intro to Google Tag Manager for Austin WordPress MeetupRich Plakas
Google Analytics with an Intro to Google Tag Manager for Austin WordPress Meetup.
This was an intermediate session where we took a deeper look into Google Analytics. We also introduced Google Tag Manager as a better way to run tracking code on a website.
Gain knowledge of digital marketing courses from one of the top-notch digital marketing training institutes in Mumbai, The Brand Saloon. 100% assured placements.
Web Analytics is a technique that you can employ to collect, measure, report, and analyze your website data.
One of the widely used Web Analytics is Google Analytics.
Google Analytics takes minutes to learn but years to master.
Objectives of today’s study to get started with Google Analytics:
> Creating a Google Analytics Account
> Placing Google Analytics on one’s Website
> Obtaining Clean Data on one’s Website
> Setting goals for one’s Website
> Analyzing Content Performance
> Tracking SEO Results in Google Analytics
> Tracking Social Media Activity on one’s Website
> Creating Custom Dashboard for the Business
> What else can you do with Google Analytics?
This presentation provides initial look into Google Analytics. I hope beginner SEO or PPC guys will find it useful.
Google Analytics is amazing Web Analytics tool. Whether you do SEO or PPC it helps you track visitor behavior on website and measure success of your online campaign.
Hey everyone! Have you ever wondered which analytics tool is the best?
Check out this comprehensive comparison of Hotjar vs Google Analytics from @webmaxy.
Check out this comprehensive comparison between #Hotjar and #GoogleAnalytics. It can help you make an informed decision about which tool to use for your website.
And don't forget to give @webmaxy a try too for a great analytics solution!
https://www.webmaxy.co/analyzer/hotjar-vs-google-analytics/
And get the free trial version today:
https://calendly.com/webmaxy/30min
#webmaxy #hotjar #googleanalytics #analytics #hotjarvsgoogleanalytics #googleanalyticsvshotjar #googleanalyticsalternatives #hotjaralternative #googlepageinsights #googleanalyticsforwebsite #googleanalyticsreport #googlewebanalytics #googleanalyticspricing #hotjarpricing #googleanalyticsheatmap #hotjarheatmap #googlesiteanalytics #googleanalyticstools #googleanalyticssignup #websiteanalytics #googleanalyticsfree #googleanalyticswebsitetraffic #googleanalyticsfeatures #hotjartracking #hotjarintegration #hotjaranalytics #googleanalyticsintegration #hotjarfeedback #hotjarandgoogleanalytics #hotjarintegrationwithgoogleanalytics
Google Analytics Website Optimizer Slidesharetmg_ltd
How to use web optimiser to test multiple designs and identify which is the best performing. The use of analytics and testing is a vital part of any web strategy and takes the guess work out of identifying design that will work for you.
Web Analytics and Wordpress - Wordcamp Chicago 2011fendmark
Presentation from 7/30 at the 2011 Wordcamp Chicago Conference
Web Analytics is a critical tool for discovering opportunities for growth and determining the success of your WordPress blog/website
This session will explore:
*Why you should use Web Analytics.
*What you should be measuring, what is important, what is not
*Using leading web analytics solutions with WordPress (free, open source and enterprise solutions)
*WordPress plugins for getting the most out of analytics as well as streamlining installation and setup on your site
Similar to Google Analytics Report Automation (Magic) (20)
Appium and Selendroid
Desired Capabilities
UI Automator and Challenges faced in finding elements
Wait & Handling Keyboard
Touch Actions and Wait Actions
Android Key Events
Android and iOS Scenarios
Overall Flow using an e-Commerce app
Alternative Solution of Appium
Pros and Cons of Appium
Google Analytics Report Automation (Magic Script)Keshav Kashyap
Google Analytics Report Automation (Magic) is an integration that reduces the work required to put Google Analytics data into any Apps Script supported product, such as Google Docs, Sites, or Spreadsheets.
Google Analytics Report Automation (Magic Script)Keshav Kashyap
Google Analytics Report Automation (Magic) is an integration that reduces the work required to put Google Analytics data into any Apps Script supported product, such as Google Docs, Sites, or Spreadsheets.
Threats to mobile devices are more prevalent and increasing in scope and complexity. Users of mobile devices desire to take full advantage of the features
available on those devices, but many of the features provide convenience and capability but sacrifice security. This best practices guide outlines steps the users can take to better protect personal devices and information.
Encryption in Microsoft 365 - ExpertsLive Netherlands 2024Albert Hoitingh
In this session I delve into the encryption technology used in Microsoft 365 and Microsoft Purview. Including the concepts of Customer Key and Double Key Encryption.
Unlock the Future of Search with MongoDB Atlas_ Vector Search Unleashed.pdfMalak Abu Hammad
Discover how MongoDB Atlas and vector search technology can revolutionize your application's search capabilities. This comprehensive presentation covers:
* What is Vector Search?
* Importance and benefits of vector search
* Practical use cases across various industries
* Step-by-step implementation guide
* Live demos with code snippets
* Enhancing LLM capabilities with vector search
* Best practices and optimization strategies
Perfect for developers, AI enthusiasts, and tech leaders. Learn how to leverage MongoDB Atlas to deliver highly relevant, context-aware search results, transforming your data retrieval process. Stay ahead in tech innovation and maximize the potential of your applications.
#MongoDB #VectorSearch #AI #SemanticSearch #TechInnovation #DataScience #LLM #MachineLearning #SearchTechnology
Generative AI Deep Dive: Advancing from Proof of Concept to ProductionAggregage
Join Maher Hanafi, VP of Engineering at Betterworks, in this new session where he'll share a practical framework to transform Gen AI prototypes into impactful products! He'll delve into the complexities of data collection and management, model selection and optimization, and ensuring security, scalability, and responsible use.
How to Get CNIC Information System with Paksim Ga.pptxdanishmna97
Pakdata Cf is a groundbreaking system designed to streamline and facilitate access to CNIC information. This innovative platform leverages advanced technology to provide users with efficient and secure access to their CNIC details.
Essentials of Automations: The Art of Triggers and Actions in FMESafe Software
In this second installment of our Essentials of Automations webinar series, we’ll explore the landscape of triggers and actions, guiding you through the nuances of authoring and adapting workspaces for seamless automations. Gain an understanding of the full spectrum of triggers and actions available in FME, empowering you to enhance your workspaces for efficient automation.
We’ll kick things off by showcasing the most commonly used event-based triggers, introducing you to various automation workflows like manual triggers, schedules, directory watchers, and more. Plus, see how these elements play out in real scenarios.
Whether you’re tweaking your current setup or building from the ground up, this session will arm you with the tools and insights needed to transform your FME usage into a powerhouse of productivity. Join us to discover effective strategies that simplify complex processes, enhancing your productivity and transforming your data management practices with FME. Let’s turn complexity into clarity and make your workspaces work wonders!
GraphSummit Singapore | The Art of the Possible with Graph - Q2 2024Neo4j
Neha Bajwa, Vice President of Product Marketing, Neo4j
Join us as we explore breakthrough innovations enabled by interconnected data and AI. Discover firsthand how organizations use relationships in data to uncover contextual insights and solve our most pressing challenges – from optimizing supply chains, detecting fraud, and improving customer experiences to accelerating drug discoveries.
DevOps and Testing slides at DASA ConnectKari Kakkonen
My and Rik Marselis slides at 30.5.2024 DASA Connect conference. We discuss about what is testing, then what is agile testing and finally what is Testing in DevOps. Finally we had lovely workshop with the participants trying to find out different ways to think about quality and testing in different parts of the DevOps infinity loop.
Dr. Sean Tan, Head of Data Science, Changi Airport Group
Discover how Changi Airport Group (CAG) leverages graph technologies and generative AI to revolutionize their search capabilities. This session delves into the unique search needs of CAG’s diverse passengers and customers, showcasing how graph data structures enhance the accuracy and relevance of AI-generated search results, mitigating the risk of “hallucinations” and improving the overall customer journey.
GDG Cloud Southlake #33: Boule & Rebala: Effective AppSec in SDLC using Deplo...James Anderson
Effective Application Security in Software Delivery lifecycle using Deployment Firewall and DBOM
The modern software delivery process (or the CI/CD process) includes many tools, distributed teams, open-source code, and cloud platforms. Constant focus on speed to release software to market, along with the traditional slow and manual security checks has caused gaps in continuous security as an important piece in the software supply chain. Today organizations feel more susceptible to external and internal cyber threats due to the vast attack surface in their applications supply chain and the lack of end-to-end governance and risk management.
The software team must secure its software delivery process to avoid vulnerability and security breaches. This needs to be achieved with existing tool chains and without extensive rework of the delivery processes. This talk will present strategies and techniques for providing visibility into the true risk of the existing vulnerabilities, preventing the introduction of security issues in the software, resolving vulnerabilities in production environments quickly, and capturing the deployment bill of materials (DBOM).
Speakers:
Bob Boule
Robert Boule is a technology enthusiast with PASSION for technology and making things work along with a knack for helping others understand how things work. He comes with around 20 years of solution engineering experience in application security, software continuous delivery, and SaaS platforms. He is known for his dynamic presentations in CI/CD and application security integrated in software delivery lifecycle.
Gopinath Rebala
Gopinath Rebala is the CTO of OpsMx, where he has overall responsibility for the machine learning and data processing architectures for Secure Software Delivery. Gopi also has a strong connection with our customers, leading design and architecture for strategic implementations. Gopi is a frequent speaker and well-known leader in continuous delivery and integrating security into software delivery.
In his public lecture, Christian Timmerer provides insights into the fascinating history of video streaming, starting from its humble beginnings before YouTube to the groundbreaking technologies that now dominate platforms like Netflix and ORF ON. Timmerer also presents provocative contributions of his own that have significantly influenced the industry. He concludes by looking at future challenges and invites the audience to join in a discussion.
20 Comprehensive Checklist of Designing and Developing a WebsitePixlogix Infotech
Dive into the world of Website Designing and Developing with Pixlogix! Looking to create a stunning online presence? Look no further! Our comprehensive checklist covers everything you need to know to craft a website that stands out. From user-friendly design to seamless functionality, we've got you covered. Don't miss out on this invaluable resource! Check out our checklist now at Pixlogix and start your journey towards a captivating online presence today.
Pushing the limits of ePRTC: 100ns holdover for 100 daysAdtran
At WSTS 2024, Alon Stern explored the topic of parametric holdover and explained how recent research findings can be implemented in real-world PNT networks to achieve 100 nanoseconds of accuracy for up to 100 days.
Removing Uninteresting Bytes in Software FuzzingAftab Hussain
Imagine a world where software fuzzing, the process of mutating bytes in test seeds to uncover hidden and erroneous program behaviors, becomes faster and more effective. A lot depends on the initial seeds, which can significantly dictate the trajectory of a fuzzing campaign, particularly in terms of how long it takes to uncover interesting behaviour in your code. We introduce DIAR, a technique designed to speedup fuzzing campaigns by pinpointing and eliminating those uninteresting bytes in the seeds. Picture this: instead of wasting valuable resources on meaningless mutations in large, bloated seeds, DIAR removes the unnecessary bytes, streamlining the entire process.
In this work, we equipped AFL, a popular fuzzer, with DIAR and examined two critical Linux libraries -- Libxml's xmllint, a tool for parsing xml documents, and Binutil's readelf, an essential debugging and security analysis command-line tool used to display detailed information about ELF (Executable and Linkable Format). Our preliminary results show that AFL+DIAR does not only discover new paths more quickly but also achieves higher coverage overall. This work thus showcases how starting with lean and optimized seeds can lead to faster, more comprehensive fuzzing campaigns -- and DIAR helps you find such seeds.
- These are slides of the talk given at IEEE International Conference on Software Testing Verification and Validation Workshop, ICSTW 2022.
2. Agenda:-
What is Google Analytics?
Why Google Analytics?
How to use GA in Application
Key Features of GA
Advantages and Disadvantages
How to setup
Metrics and Dimensions
Automation of GA
Sample Report & Demo
3. What is Google Analytics?
Free Service Offered by Google for Website
Statistics.
Daily, monthly, yearly tracking of web visits
Graphed over time
Which pages they go to, how long they stay
Bounce rate
Entrance pages
How they got there
Search engines and Search terms used
Location, operating system, monitor resolution
4. How it works ?
Sign up for Google Analytics
https://www.google.com/analytics/
They return code to you
You paste the code just below the </body> tag
Put it on EVERY page
Edit>Find and Replace is easiest option
Put it in your template pages, so it will be
automatically on every page
Go to the Analytics dashboard page to see daily
metrics
5. What it does?
Daily, monthly, yearly tracking of web visits
Graphed over time
Which pages they go to, how long they stay
Bounce rate
Entrance pages
How they got there
Search engines and Search terms used
Location, operating system, monitor resolution
6. Key Features of Google Analytics:-
It helps in Website Trafficking.
Where the visitors came from?
How they are navigating through site?
Conversion
Downloads
Page Views
Registration
E-Commerce
Ad-Words Performance
7. Advantages :-
Free
Sufficiant possibilities for most companies
Easy to implement
Easy to use
Easy to understand
8. Dis-advantages :-
URL and title based
No data history
Privacy ?
JavaScript and cookies
Only visitors, no crawlers or bots
9. What is Google Analytics Report Automation?
Google Analytics Report Automation (Magic) is
an integration that reduces the work required to
put Google Analytics data into any Apps Script
supported product, such as Google Docs, Sites,
or Spreadsheets.
10. How Google Analytics Report Automation Works?
Create a Dashboard on Google Spreadsheet.
Add Google Analytics Report Automation (Magic
Script)
Turn on access to the APIs for your first time.
Looking at the tabs on top, Script Editor >
Resources > Use Google APIs > Make sure Google
Analytics API is on.
Script Editor > Resources > Use Google APIs > Click
“Google APIs Console” > Turn Analytics API On >
Agree to Terms.
11. How Google Analytics Report Automation Works?
Go to the “gaconfig” sheet and enter the profile
number for a view you have access to. You can
find the profile number either by: Going to the
Google Analytics tab and choosing “Find
profile / ids”
Bringing up a report in the Google Analytics
interface in that specific view.
Go to “Dashboard” sheet and run “Get Data”
from the Google Analytics tab.
12. Required Inputs or Query Parameter Details:-
Account ID :- the (Magic) script comes with a ‘Find Profile/IDs’
option underneath the Google Analytics menu. ids =ga:12345
Start Date/End Date (*required) : today()
Metrics (*required) : ga:session,ga:bounces
Dimension : ga:browser,ga:city
Sort : ga:country
Filter : ga:medium
Max Result :100
Start and End Index : 10 to 100
Output : Name of the Sheet
14. Sample Query Parameter :-
query1 value1
type core
ids ga:80332348
start-date 2/10/2014
end-date 2/19/2014
last-n-days
metrics ga:visits
dimensions ga:date
sort
filters
segment
start-index
max-results
sheet-name App Sony PlayStation
15. Trigger your Script:-
Go to Add-ons.
Select Google Analytics.
Navigate to Schedule Reports.
16. Sample Report:-
Results for query query9
Date executed 5/4/2015 5:59:27
Profile Name WWE.com
Total Results Found 1
Total Results Returned 1
Contains Sampled Data FALSE
Totals For All Results
ga:visits ga:visitors
1480 1353
ga:visits ga:visitors
1480 1353