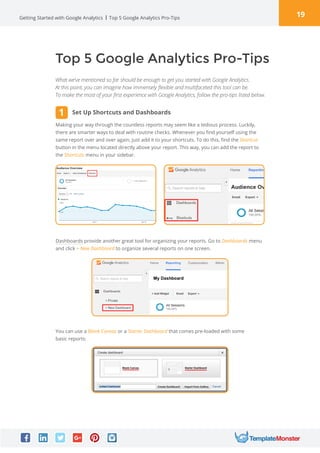
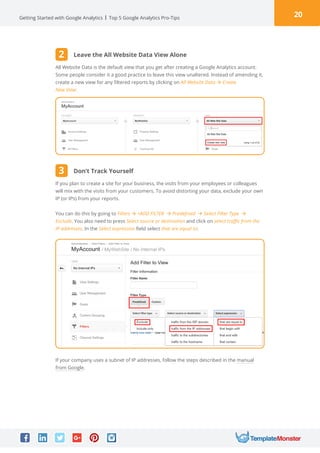
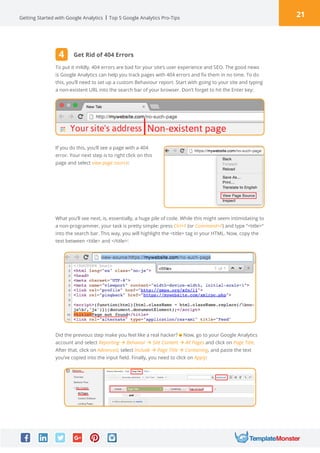
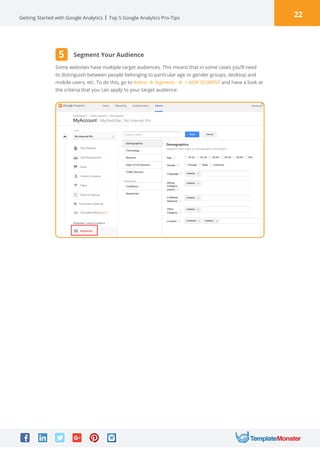
Download to read offline


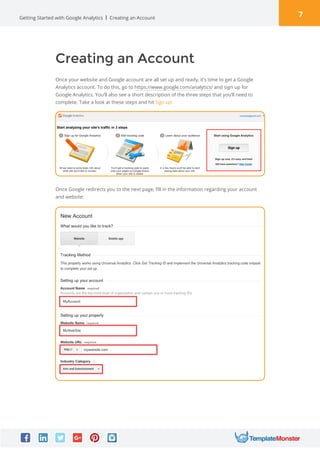
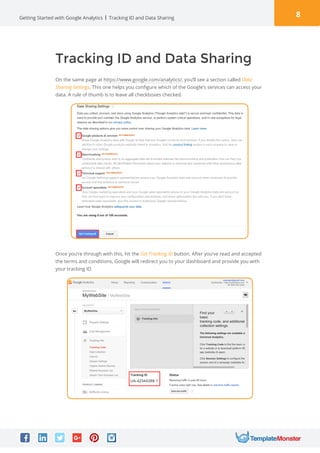
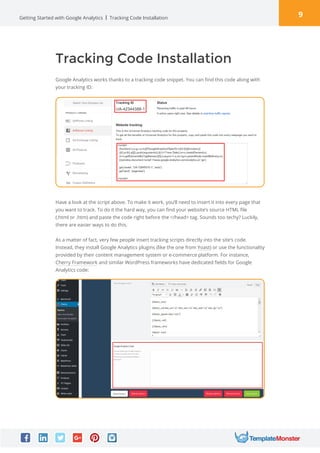
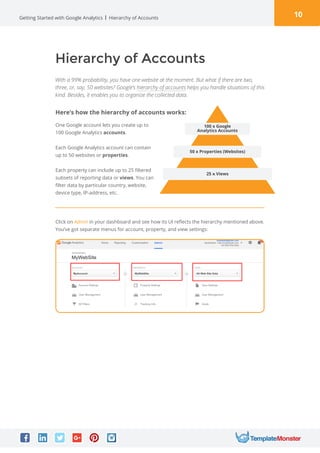


Google Analytics is a free tool from Google that provides analytics and insights about visitors to websites. It tracks information like number of visitors, how long they spend on pages, where they come from, and more. To use it, you create a Google Analytics account and insert the tracking code on your website pages. This allows you to see metrics about users and optimize your site. The document provides instructions for setting up accounts, tracking codes, views, goals, and other Google Analytics features to begin analyzing website traffic.


