SlideShare a Scribd company logo
1 of 65
Presented by:  Nicole Gattuso, Fred Jackson, Travis Lovett, Jason Osborn  Global cities and ecologyNew York, Los Angeles, Chicago
Chicago New York Los Angeles Source: US Census Bureau http://www.census.gov/geo/www/maps/2010_census_nighttime_map/nighttime_map_2010.html
New York
Los Angeles
Chicago
World Population 1750-2050 Source: World Bank http://www.worldbank.org/depweb/beyond/beyondco/beg_03.pdf
Energy Consumption (Kwh/capita) Source: World Bank Electric Power Consumption http://www.worldbank.org/depweb/beyond/beyondco/beg_03.pdf
Oil Consumption(Barrels/Day) Source:  Index Mundi, World Oil Consumption; http://www.indexmundi.com/energy.aspx
Air Quality within Urban Environments Without air we would not be able to survive Photo: New York (from Ecoficial, 2010) http://www.ecoficial.com/epa-proposes-stronger-air-quality-standards-for-sulfur-dioxide-589/
Air Pollution Carbon Dioxide/Monoxide Sulfur Oxides/Diesel Fuel Nitrogen Oxides This graph provides evidence that atmospheric CO2 has increased since the Industrial Revolution. (Source: NOAA; http://climate.nasa.gov/evidence/)
Nature can no longer manage air pollution without our help. Pollution and Global Cities
According to the American Lung Association: ,[object Object]
Low income families
People with existing lung problems
ChildrenWho is the most threatened?
[object Object]
Sore Throats
Coughing
Lung Damage
Cancer
Premature DeathsWhat are the health effects? http://hubpages.com/hub/air
NYC, LA, and Chicago Comparison Air Now  http://www.airnow.gov/index.cfm?action=airnow.local_city&zipcode=10026&submit=Go
[object Object],Los Angeles Air
[object Object]
Generates around $5.1 billions in annual state and local taxes
Generates $21.5 billion taxes nationwide
Value of global trade is estimated to be $250 billion per year.The Port of Los Angeles Air Monitoring Stations in Port http://www.portoflosangeles.org/
44%  of all imports to the USA 90% of all trade from East Asia
New York’s Air The 2011 State of the Air ranked, New York’s air pollution amongst the worst in the county. (American Lung Association, 2011) ,[object Object]
460,000 Adults and 160,000 Children with Asthma(http://www.stateoftheair.org/2011/city-rankings/most-polluted-cities.html)
[object Object]
Queens
Brooklyn’s Sunset Park
WilliamsburgNew York’s Air Photo: Bronx with Manhattan in Background By Witzen
In April, 2011, New York Times noted troubling levels of diesel pollution in Little Village, Lincoln Park, Ukrainian Village, Wicker Park, Pilsen, and other areas. Chicago’s Air
The Clean Air Task Force (a public health advocacy group) estimates in the Chicago Metro Area particulates from diesel emissions cause: ,[object Object]
1,125 heart attacks
28,201 asthma attacks each year.Chicago’s Air
Clean Air Act – Created in 1970 In 1990 after the Act was in place for 20 years, it is estimated that it prevented more than 200,000 premature deaths and almost 700,000 cases of chronic bronchitis were avoided. ( United States, EPA, 2010) Decades of Progress
In 2009, the state of New York adopted additional clean air policies more stringent than the Clean Air Act. New York Initiatives
Clean Trucks Program- ,[object Object]
Will reduce diesel emissions by 80% (City of Los Angeles, 2011) Los Angeles Initiatives
Alternative Fuel Vehicles By 2012-2013, L.A. plans to covert 85% of all fleet to be powered by alternative fuel. Los Angeles Initiatives L.A.’s last diesel bus One of L.A.’s compressed natural gas buses
The Port’s “Triple Bottom Line Approach” Clean Air Action Plan (CAAP) The plan is set to reduce: ,[object Object]
Nitrogen oxides by 45%
Sulfur oxides by 52%L.A. Initiatives
SPRAWLNew York City, Los Angeles, Chicago       OBJECTIVES:      What is sprawl      Issues created from sprawl      Combating sprawl      Conclusion
SPRAWL Became possible in 1814 in NYC Spreading outwards of a city Specifically, it is considered the rapid expansion of a metropolitan area Leads to suburbanization Creates small communities on the outskirts of the central city Environmental Problems Over consumption of resources
Issues created from Sprawl Increase  reliance on automobiles results in Health hazards  such as:                  Air Pollution Motor vehicle crashes Pedestrian injuries and fatalities
Issues created from Sprawl cont.	 EFFECTS OF LAND USE Newhall Ranch: Largest housing development ever approved in Los Angeles—for 70,000 people “While the population of the seven-county Chicago metro area experienced a growth rate of 63 percent between 1950 and 2006, that rate jumps to 261 percent by removing the city of Chicago from the equation” (Zekas, 2010) Clearing of a forest for development impacts water quantity and quality
Issues created from Sprawl cont. ,[object Object],[object Object]
Combating Sprawl	 “Chicago must immediately make green infrastructure a priority” (Lyderson, 2010)  The solutions for sprawl rest upon the same actors—individuals, businesses and governing policies—that create sprawl  Smart growth encourages more mixed-use and compact development, investments in infill development projects in inner cities
Combating Sprawl cont. Smart Growth in NYC- Supporting the purchase of farmland development rights and other farming preservation efforts
Combating Sprawl cont. Smart Growth in LA- agreement making area westward of the Newhall Ranch off-limits for development
Combating Sprawl cont. Smart Growth in Chicago- plans to redevelop the historic freight and commuter rail assets in southern Chicago
Combating Sprawl Conclusion	 Sprawl is an ever compounding problem in NYC, Los Angeles, and Chicago. It strains vital city resources and creates health hazards Through smart growth efforts sprawl can be limited.
Transportation Congestion Pricing Source:  http://sustainableflatbush.org/2008/03/27/congestion-pricing-countdown/
Why Support Congestion Pricing
Public Good versus Common Good Public Good Common Resource Photo: New Delhi, AP Photo, Manish Swarup
Market Failure Public Good No User Fee Free Riders Common Good No User Fee Excessive Use Vs. http://tutor2u.net/economics/content/topics/transport/transport_congestion.htm
Negative Externalities Digital Vision/Getty.
Market Solution Public Good No User Fee Free Riders Common Good User Fee More Efficient Use Vs. Photo: New Delhi, AP Photo, Manish Swarup
Lessons Learned by FHWA London, Singapore, and Stockholm Faster Traffic More  Transit Less Congestion
Lessons Learned by FHWA London, Singapore, and Stockholm Greater Economic Returns Cleaner Air Less Oil
Do these apply to NY, LA, and Chicago? Source:  Texas Transportation Institute, 2010

More Related Content

What's hot

Sustainable urban transport and urban development can save lives - Claudia Ad...
Sustainable urban transport and urban development can save lives - Claudia Ad...Sustainable urban transport and urban development can save lives - Claudia Ad...
Sustainable urban transport and urban development can save lives - Claudia Ad...WRI Ross Center for Sustainable Cities
 
Technology is Transforming Mobility Everywhere - Robin Chase - Zipcar, Buzzca...
Technology is Transforming Mobility Everywhere - Robin Chase - Zipcar, Buzzca...Technology is Transforming Mobility Everywhere - Robin Chase - Zipcar, Buzzca...
Technology is Transforming Mobility Everywhere - Robin Chase - Zipcar, Buzzca...WRI Ross Center for Sustainable Cities
 
Power Point For Comp
Power Point For CompPower Point For Comp
Power Point For Compaleemarie1106
 
Romel Pasqual, Deputy Mayor, City of LA at Opportunity Green 2009
Romel Pasqual, Deputy Mayor, City of LA at Opportunity Green 2009Romel Pasqual, Deputy Mayor, City of LA at Opportunity Green 2009
Romel Pasqual, Deputy Mayor, City of LA at Opportunity Green 2009Michael Flynn
 
EIP Water Action Group City Blueprints September 2013
EIP Water Action Group City Blueprints September 2013EIP Water Action Group City Blueprints September 2013
EIP Water Action Group City Blueprints September 2013EIP Water
 
Transportation and the Earth
Transportation and the EarthTransportation and the Earth
Transportation and the Earthaleemarie1106
 
Power Point For Comp
Power Point For CompPower Point For Comp
Power Point For Compxorachieeee
 
Solar powered transportation for a city in Costa Rica
Solar powered transportation for a city in Costa RicaSolar powered transportation for a city in Costa Rica
Solar powered transportation for a city in Costa Ricajane segleau
 
Equinox: Why Does Land Use Matter?
Equinox: Why Does Land Use Matter?Equinox: Why Does Land Use Matter?
Equinox: Why Does Land Use Matter?Grant Barrett
 
So c schumacher north workshop
So c schumacher north workshopSo c schumacher north workshop
So c schumacher north workshopSchool of Commoning
 
Conferencia LA Dr. David L. Bodde
Conferencia LA Dr. David L. BoddeConferencia LA Dr. David L. Bodde
Conferencia LA Dr. David L. Boddelideresacademicos
 
Ecocities overview
Ecocities overviewEcocities overview
Ecocities overviewLonnie Gamble
 
A Cross Town Rivalry: UCLA and USC, Engines for Real Estate Development (Scot...
A Cross Town Rivalry: UCLA and USC, Engines for Real Estate Development (Scot...A Cross Town Rivalry: UCLA and USC, Engines for Real Estate Development (Scot...
A Cross Town Rivalry: UCLA and USC, Engines for Real Estate Development (Scot...Virtual ULI
 
Sustainable Transport Saves Lives: Opportunities and Challenges for Urban Ind...
Sustainable Transport Saves Lives: Opportunities and Challenges for Urban Ind...Sustainable Transport Saves Lives: Opportunities and Challenges for Urban Ind...
Sustainable Transport Saves Lives: Opportunities and Challenges for Urban Ind...WRI Ross Center for Sustainable Cities
 
Program Lecture 3 Resilience And The Knowledge Revolution
Program Lecture 3   Resilience And The Knowledge RevolutionProgram Lecture 3   Resilience And The Knowledge Revolution
Program Lecture 3 Resilience And The Knowledge RevolutionGraciela Chichilnisky
 

What's hot (18)

Presentation
PresentationPresentation
Presentation
 
Un sustainable infrastructure
Un sustainable infrastructureUn sustainable infrastructure
Un sustainable infrastructure
 
Sustainable urban transport and urban development can save lives - Claudia Ad...
Sustainable urban transport and urban development can save lives - Claudia Ad...Sustainable urban transport and urban development can save lives - Claudia Ad...
Sustainable urban transport and urban development can save lives - Claudia Ad...
 
Technology is Transforming Mobility Everywhere - Robin Chase - Zipcar, Buzzca...
Technology is Transforming Mobility Everywhere - Robin Chase - Zipcar, Buzzca...Technology is Transforming Mobility Everywhere - Robin Chase - Zipcar, Buzzca...
Technology is Transforming Mobility Everywhere - Robin Chase - Zipcar, Buzzca...
 
Power Point For Comp
Power Point For CompPower Point For Comp
Power Point For Comp
 
Romel Pasqual, Deputy Mayor, City of LA at Opportunity Green 2009
Romel Pasqual, Deputy Mayor, City of LA at Opportunity Green 2009Romel Pasqual, Deputy Mayor, City of LA at Opportunity Green 2009
Romel Pasqual, Deputy Mayor, City of LA at Opportunity Green 2009
 
EIP Water Action Group City Blueprints September 2013
EIP Water Action Group City Blueprints September 2013EIP Water Action Group City Blueprints September 2013
EIP Water Action Group City Blueprints September 2013
 
Transportation and the Earth
Transportation and the EarthTransportation and the Earth
Transportation and the Earth
 
Power Point For Comp
Power Point For CompPower Point For Comp
Power Point For Comp
 
Solar powered transportation for a city in Costa Rica
Solar powered transportation for a city in Costa RicaSolar powered transportation for a city in Costa Rica
Solar powered transportation for a city in Costa Rica
 
Equinox: Why Does Land Use Matter?
Equinox: Why Does Land Use Matter?Equinox: Why Does Land Use Matter?
Equinox: Why Does Land Use Matter?
 
So c schumacher north workshop
So c schumacher north workshopSo c schumacher north workshop
So c schumacher north workshop
 
Conferencia LA Dr. David L. Bodde
Conferencia LA Dr. David L. BoddeConferencia LA Dr. David L. Bodde
Conferencia LA Dr. David L. Bodde
 
Ecocities overview
Ecocities overviewEcocities overview
Ecocities overview
 
A Cross Town Rivalry: UCLA and USC, Engines for Real Estate Development (Scot...
A Cross Town Rivalry: UCLA and USC, Engines for Real Estate Development (Scot...A Cross Town Rivalry: UCLA and USC, Engines for Real Estate Development (Scot...
A Cross Town Rivalry: UCLA and USC, Engines for Real Estate Development (Scot...
 
CK2017: Join the Urban Revolution!
CK2017: Join the Urban Revolution!CK2017: Join the Urban Revolution!
CK2017: Join the Urban Revolution!
 
Sustainable Transport Saves Lives: Opportunities and Challenges for Urban Ind...
Sustainable Transport Saves Lives: Opportunities and Challenges for Urban Ind...Sustainable Transport Saves Lives: Opportunities and Challenges for Urban Ind...
Sustainable Transport Saves Lives: Opportunities and Challenges for Urban Ind...
 
Program Lecture 3 Resilience And The Knowledge Revolution
Program Lecture 3   Resilience And The Knowledge RevolutionProgram Lecture 3   Resilience And The Knowledge Revolution
Program Lecture 3 Resilience And The Knowledge Revolution
 

Viewers also liked

New York City Case Study
New York City Case StudyNew York City Case Study
New York City Case StudyAlbert Chen
 
New York City
New  York CityNew  York City
New York Citytarzanol
 
Air Pollution in New York City
Air Pollution in New York CityAir Pollution in New York City
Air Pollution in New York CityVisualBee.com
 
T07_The AmazonRainforest_0842075
T07_The AmazonRainforest_0842075T07_The AmazonRainforest_0842075
T07_The AmazonRainforest_0842075Chris Crombie
 
Global Warming
Global WarmingGlobal Warming
Global Warmingguestc26722
 
Community types: urban, rural and suburban.
Community types: urban, rural and suburban.Community types: urban, rural and suburban.
Community types: urban, rural and suburban.Cheri Turman
 

Viewers also liked (9)

New York City Case Study
New York City Case StudyNew York City Case Study
New York City Case Study
 
New York City
New  York CityNew  York City
New York City
 
Air Pollution in New York City
Air Pollution in New York CityAir Pollution in New York City
Air Pollution in New York City
 
T07_The AmazonRainforest_0842075
T07_The AmazonRainforest_0842075T07_The AmazonRainforest_0842075
T07_The AmazonRainforest_0842075
 
Latin America Environmental Concerns
Latin America Environmental ConcernsLatin America Environmental Concerns
Latin America Environmental Concerns
 
Communities
CommunitiesCommunities
Communities
 
Global Warming
Global WarmingGlobal Warming
Global Warming
 
Smart city
Smart citySmart city
Smart city
 
Community types: urban, rural and suburban.
Community types: urban, rural and suburban.Community types: urban, rural and suburban.
Community types: urban, rural and suburban.
 

Similar to Global cities and ecology

Carpool Effects on Air Quality in Los Angeles
Carpool Effects on Air Quality in Los AngelesCarpool Effects on Air Quality in Los Angeles
Carpool Effects on Air Quality in Los AngelesJikun Lian EIT
 
CCAP Review
CCAP ReviewCCAP Review
CCAP ReviewPeter Miles
 
C40 adalberto maluf wuf medellin
C40 adalberto maluf wuf medellinC40 adalberto maluf wuf medellin
C40 adalberto maluf wuf medellindeespacio
 
Transport and Mobility - A History
Transport and Mobility - A HistoryTransport and Mobility - A History
Transport and Mobility - A HistoryEmilia Suomalainen
 
6 ecologies-stockholm
6 ecologies-stockholm6 ecologies-stockholm
6 ecologies-stockholmGreg Wass
 
Running head LOS ANGELES UNION STATION AS A SUSTAINABLE DEVELOPME.docx
Running head LOS ANGELES UNION STATION AS A SUSTAINABLE DEVELOPME.docxRunning head LOS ANGELES UNION STATION AS A SUSTAINABLE DEVELOPME.docx
Running head LOS ANGELES UNION STATION AS A SUSTAINABLE DEVELOPME.docxcharisellington63520
 
LTC, Jack R. Widmeyer Transportation Research Conference, 11/04/2011, Huasha Liu
LTC, Jack R. Widmeyer Transportation Research Conference, 11/04/2011, Huasha LiuLTC, Jack R. Widmeyer Transportation Research Conference, 11/04/2011, Huasha Liu
LTC, Jack R. Widmeyer Transportation Research Conference, 11/04/2011, Huasha LiuLTC @ CSUSB
 
Congestion Pricing Commission
Congestion Pricing CommissionCongestion Pricing Commission
Congestion Pricing Commissionstreetsblog
 
Traffic Pollution
Traffic PollutionTraffic Pollution
Traffic PollutionGina Alfaro
 
Apresentação Lance Brown
Apresentação Lance BrownApresentação Lance Brown
Apresentação Lance Browntransformurb
 
Senior design final report
Senior design final reportSenior design final report
Senior design final reportSifat Syed
 
Making Infrastructure Competitive in a Changing World through Investment
Making Infrastructure Competitive in a Changing World through InvestmentMaking Infrastructure Competitive in a Changing World through Investment
Making Infrastructure Competitive in a Changing World through InvestmentPenn Institute for Urban Research
 
CUTA 2008: Gayle Lake Presentation
CUTA 2008: Gayle Lake PresentationCUTA 2008: Gayle Lake Presentation
CUTA 2008: Gayle Lake Presentationcuta_dn
 
Taking the Subway to Copenhagen - How Transit is Essential to Global GHG Red...
Taking the Subway to Copenhagen - How Transit is Essential to Global GHG Red...Taking the Subway to Copenhagen - How Transit is Essential to Global GHG Red...
Taking the Subway to Copenhagen - How Transit is Essential to Global GHG Red...New York Public Transit Association
 

Similar to Global cities and ecology (20)

Sustainable Transport: The EMBARQ Footprint
Sustainable Transport: The EMBARQ FootprintSustainable Transport: The EMBARQ Footprint
Sustainable Transport: The EMBARQ Footprint
 
Carpool Effects on Air Quality in Los Angeles
Carpool Effects on Air Quality in Los AngelesCarpool Effects on Air Quality in Los Angeles
Carpool Effects on Air Quality in Los Angeles
 
CCAP Review
CCAP ReviewCCAP Review
CCAP Review
 
Transformative Solutions: Cities for People
Transformative Solutions: Cities for PeopleTransformative Solutions: Cities for People
Transformative Solutions: Cities for People
 
Transformative Solutions: Cities for People
Transformative Solutions: Cities for PeopleTransformative Solutions: Cities for People
Transformative Solutions: Cities for People
 
C40 adalberto maluf wuf medellin
C40 adalberto maluf wuf medellinC40 adalberto maluf wuf medellin
C40 adalberto maluf wuf medellin
 
Transport and Mobility - A History
Transport and Mobility - A HistoryTransport and Mobility - A History
Transport and Mobility - A History
 
6 ecologies-stockholm
6 ecologies-stockholm6 ecologies-stockholm
6 ecologies-stockholm
 
Session 6 - Better Growth Better Climate
Session 6 - Better Growth Better ClimateSession 6 - Better Growth Better Climate
Session 6 - Better Growth Better Climate
 
Running head LOS ANGELES UNION STATION AS A SUSTAINABLE DEVELOPME.docx
Running head LOS ANGELES UNION STATION AS A SUSTAINABLE DEVELOPME.docxRunning head LOS ANGELES UNION STATION AS A SUSTAINABLE DEVELOPME.docx
Running head LOS ANGELES UNION STATION AS A SUSTAINABLE DEVELOPME.docx
 
LTC, Jack R. Widmeyer Transportation Research Conference, 11/04/2011, Huasha Liu
LTC, Jack R. Widmeyer Transportation Research Conference, 11/04/2011, Huasha LiuLTC, Jack R. Widmeyer Transportation Research Conference, 11/04/2011, Huasha Liu
LTC, Jack R. Widmeyer Transportation Research Conference, 11/04/2011, Huasha Liu
 
Congestion Pricing Commission
Congestion Pricing CommissionCongestion Pricing Commission
Congestion Pricing Commission
 
Traffic Pollution
Traffic PollutionTraffic Pollution
Traffic Pollution
 
Apresentação Lance Brown
Apresentação Lance BrownApresentação Lance Brown
Apresentação Lance Brown
 
Senior design final report
Senior design final reportSenior design final report
Senior design final report
 
New Urbanism: Just... performs...better
New Urbanism: Just... performs...betterNew Urbanism: Just... performs...better
New Urbanism: Just... performs...better
 
Making Infrastructure Competitive in a Changing World through Investment
Making Infrastructure Competitive in a Changing World through InvestmentMaking Infrastructure Competitive in a Changing World through Investment
Making Infrastructure Competitive in a Changing World through Investment
 
CUTA 2008: Gayle Lake Presentation
CUTA 2008: Gayle Lake PresentationCUTA 2008: Gayle Lake Presentation
CUTA 2008: Gayle Lake Presentation
 
A Regional Perspective from Latin America
A Regional Perspective from Latin AmericaA Regional Perspective from Latin America
A Regional Perspective from Latin America
 
Taking the Subway to Copenhagen - How Transit is Essential to Global GHG Red...
Taking the Subway to Copenhagen - How Transit is Essential to Global GHG Red...Taking the Subway to Copenhagen - How Transit is Essential to Global GHG Red...
Taking the Subway to Copenhagen - How Transit is Essential to Global GHG Red...
 

More from Greg Wass

Budgeting for Results and Paying for Success in State Government 5.6.14
Budgeting for Results and Paying for Success in State Government 5.6.14Budgeting for Results and Paying for Success in State Government 5.6.14
Budgeting for Results and Paying for Success in State Government 5.6.14Greg Wass
 
Demonstrating ROI for Technology Investments 9.30.13
Demonstrating ROI for Technology Investments 9.30.13Demonstrating ROI for Technology Investments 9.30.13
Demonstrating ROI for Technology Investments 9.30.13Greg Wass
 
estonia | eesti
estonia | eestiestonia | eesti
estonia | eestiGreg Wass
 
Illinois budgeting for results update 6.19.13
Illinois budgeting for results update 6.19.13Illinois budgeting for results update 6.19.13
Illinois budgeting for results update 6.19.13Greg Wass
 
Illinois performance reporting system update 4.26.13
Illinois performance reporting system update 4.26.13Illinois performance reporting system update 4.26.13
Illinois performance reporting system update 4.26.13Greg Wass
 
Fast Track Proposal to Budgeting for Results Commission 02 22 13
Fast Track Proposal to Budgeting for Results Commission   02 22 13Fast Track Proposal to Budgeting for Results Commission   02 22 13
Fast Track Proposal to Budgeting for Results Commission 02 22 13Greg Wass
 
Report to Budgeting for Results Commission 01.25.13
Report to Budgeting for Results Commission 01.25.13Report to Budgeting for Results Commission 01.25.13
Report to Budgeting for Results Commission 01.25.13Greg Wass
 
Multi-tenant cloud-based apps for government 8.20.12
Multi-tenant cloud-based apps for government 8.20.12Multi-tenant cloud-based apps for government 8.20.12
Multi-tenant cloud-based apps for government 8.20.12Greg Wass
 
Week 5: Public safety
Week 5: Public safetyWeek 5: Public safety
Week 5: Public safetyGreg Wass
 
Week 9: IT governance and funding
Week 9: IT governance and fundingWeek 9: IT governance and funding
Week 9: IT governance and fundingGreg Wass
 
Week 8: The digital city
Week 8: The digital cityWeek 8: The digital city
Week 8: The digital cityGreg Wass
 
Week 6: Open data
Week 6: Open dataWeek 6: Open data
Week 6: Open dataGreg Wass
 
Syllabus - Technology in the Public Sector
Syllabus - Technology in the Public SectorSyllabus - Technology in the Public Sector
Syllabus - Technology in the Public SectorGreg Wass
 
Week 3: Health and human services IT
Week 3: Health and human services ITWeek 3: Health and human services IT
Week 3: Health and human services ITGreg Wass
 
Week 1: Social media and government
Week 1: Social media and governmentWeek 1: Social media and government
Week 1: Social media and governmentGreg Wass
 
Week 2: ERP and shared services
Week 2: ERP and shared servicesWeek 2: ERP and shared services
Week 2: ERP and shared servicesGreg Wass
 
The technology of transparency 6.12.12
The technology of transparency 6.12.12The technology of transparency 6.12.12
The technology of transparency 6.12.12Greg Wass
 
Transforming Cook County: Changing the Game with Shared Services and Open Gov...
Transforming Cook County: Changing the Game with Shared Services and Open Gov...Transforming Cook County: Changing the Game with Shared Services and Open Gov...
Transforming Cook County: Changing the Game with Shared Services and Open Gov...Greg Wass
 
Public policy and the information revolution 4.20.12
Public policy and the information revolution 4.20.12Public policy and the information revolution 4.20.12
Public policy and the information revolution 4.20.12Greg Wass
 
Cook County (IL) Open Government Plan
Cook County (IL) Open Government PlanCook County (IL) Open Government Plan
Cook County (IL) Open Government PlanGreg Wass
 

More from Greg Wass (20)

Budgeting for Results and Paying for Success in State Government 5.6.14
Budgeting for Results and Paying for Success in State Government 5.6.14Budgeting for Results and Paying for Success in State Government 5.6.14
Budgeting for Results and Paying for Success in State Government 5.6.14
 
Demonstrating ROI for Technology Investments 9.30.13
Demonstrating ROI for Technology Investments 9.30.13Demonstrating ROI for Technology Investments 9.30.13
Demonstrating ROI for Technology Investments 9.30.13
 
estonia | eesti
estonia | eestiestonia | eesti
estonia | eesti
 
Illinois budgeting for results update 6.19.13
Illinois budgeting for results update 6.19.13Illinois budgeting for results update 6.19.13
Illinois budgeting for results update 6.19.13
 
Illinois performance reporting system update 4.26.13
Illinois performance reporting system update 4.26.13Illinois performance reporting system update 4.26.13
Illinois performance reporting system update 4.26.13
 
Fast Track Proposal to Budgeting for Results Commission 02 22 13
Fast Track Proposal to Budgeting for Results Commission   02 22 13Fast Track Proposal to Budgeting for Results Commission   02 22 13
Fast Track Proposal to Budgeting for Results Commission 02 22 13
 
Report to Budgeting for Results Commission 01.25.13
Report to Budgeting for Results Commission 01.25.13Report to Budgeting for Results Commission 01.25.13
Report to Budgeting for Results Commission 01.25.13
 
Multi-tenant cloud-based apps for government 8.20.12
Multi-tenant cloud-based apps for government 8.20.12Multi-tenant cloud-based apps for government 8.20.12
Multi-tenant cloud-based apps for government 8.20.12
 
Week 5: Public safety
Week 5: Public safetyWeek 5: Public safety
Week 5: Public safety
 
Week 9: IT governance and funding
Week 9: IT governance and fundingWeek 9: IT governance and funding
Week 9: IT governance and funding
 
Week 8: The digital city
Week 8: The digital cityWeek 8: The digital city
Week 8: The digital city
 
Week 6: Open data
Week 6: Open dataWeek 6: Open data
Week 6: Open data
 
Syllabus - Technology in the Public Sector
Syllabus - Technology in the Public SectorSyllabus - Technology in the Public Sector
Syllabus - Technology in the Public Sector
 
Week 3: Health and human services IT
Week 3: Health and human services ITWeek 3: Health and human services IT
Week 3: Health and human services IT
 
Week 1: Social media and government
Week 1: Social media and governmentWeek 1: Social media and government
Week 1: Social media and government
 
Week 2: ERP and shared services
Week 2: ERP and shared servicesWeek 2: ERP and shared services
Week 2: ERP and shared services
 
The technology of transparency 6.12.12
The technology of transparency 6.12.12The technology of transparency 6.12.12
The technology of transparency 6.12.12
 
Transforming Cook County: Changing the Game with Shared Services and Open Gov...
Transforming Cook County: Changing the Game with Shared Services and Open Gov...Transforming Cook County: Changing the Game with Shared Services and Open Gov...
Transforming Cook County: Changing the Game with Shared Services and Open Gov...
 
Public policy and the information revolution 4.20.12
Public policy and the information revolution 4.20.12Public policy and the information revolution 4.20.12
Public policy and the information revolution 4.20.12
 
Cook County (IL) Open Government Plan
Cook County (IL) Open Government PlanCook County (IL) Open Government Plan
Cook County (IL) Open Government Plan
 

Recently uploaded

Painted Grey Ware.pptx, PGW Culture of India
Painted Grey Ware.pptx, PGW Culture of IndiaPainted Grey Ware.pptx, PGW Culture of India
Painted Grey Ware.pptx, PGW Culture of IndiaVirag Sontakke
 
18-04-UA_REPORT_MEDIALITERAСY_INDEX-DM_23-1-final-eng.pdf
18-04-UA_REPORT_MEDIALITERAСY_INDEX-DM_23-1-final-eng.pdf18-04-UA_REPORT_MEDIALITERAСY_INDEX-DM_23-1-final-eng.pdf
18-04-UA_REPORT_MEDIALITERAСY_INDEX-DM_23-1-final-eng.pdfssuser54595a
 
Crayon Activity Handout For the Crayon A
Crayon Activity Handout For the Crayon ACrayon Activity Handout For the Crayon A
Crayon Activity Handout For the Crayon AUnboundStockton
 
Pharmacognosy Flower 3. Compositae 2023.pdf
Pharmacognosy Flower 3. Compositae 2023.pdfPharmacognosy Flower 3. Compositae 2023.pdf
Pharmacognosy Flower 3. Compositae 2023.pdfMahmoud M. Sallam
 
Framing an Appropriate Research Question 6b9b26d93da94caf993c038d9efcdedb.pdf
Framing an Appropriate Research Question 6b9b26d93da94caf993c038d9efcdedb.pdfFraming an Appropriate Research Question 6b9b26d93da94caf993c038d9efcdedb.pdf
Framing an Appropriate Research Question 6b9b26d93da94caf993c038d9efcdedb.pdfUjwalaBharambe
 
MICROBIOLOGY biochemical test detailed.pptx
MICROBIOLOGY biochemical test detailed.pptxMICROBIOLOGY biochemical test detailed.pptx
MICROBIOLOGY biochemical test detailed.pptxabhijeetpadhi001
 
CELL CYCLE Division Science 8 quarter IV.pptx
CELL CYCLE Division Science 8 quarter IV.pptxCELL CYCLE Division Science 8 quarter IV.pptx
CELL CYCLE Division Science 8 quarter IV.pptxJiesonDelaCerna
 
Presiding Officer Training module 2024 lok sabha elections
Presiding Officer Training module 2024 lok sabha electionsPresiding Officer Training module 2024 lok sabha elections
Presiding Officer Training module 2024 lok sabha electionsanshu789521
 
Computed Fields and api Depends in the Odoo 17
Computed Fields and api Depends in the Odoo 17Computed Fields and api Depends in the Odoo 17
Computed Fields and api Depends in the Odoo 17Celine George
 
Difference Between Search & Browse Methods in Odoo 17
Difference Between Search & Browse Methods in Odoo 17Difference Between Search & Browse Methods in Odoo 17
Difference Between Search & Browse Methods in Odoo 17Celine George
 
Enzyme, Pharmaceutical Aids, Miscellaneous Last Part of Chapter no 5th.pdf
Enzyme, Pharmaceutical Aids, Miscellaneous Last Part of Chapter no 5th.pdfEnzyme, Pharmaceutical Aids, Miscellaneous Last Part of Chapter no 5th.pdf
Enzyme, Pharmaceutical Aids, Miscellaneous Last Part of Chapter no 5th.pdfSumit Tiwari
 
Full Stack Web Development Course for Beginners
Full Stack Web Development Course  for BeginnersFull Stack Web Development Course  for Beginners
Full Stack Web Development Course for BeginnersSabitha Banu
 
AmericanHighSchoolsprezentacijaoskolama.
AmericanHighSchoolsprezentacijaoskolama.AmericanHighSchoolsprezentacijaoskolama.
AmericanHighSchoolsprezentacijaoskolama.arsicmarija21
 
POINT- BIOCHEMISTRY SEM 2 ENZYMES UNIT 5.pptx
POINT- BIOCHEMISTRY SEM 2 ENZYMES UNIT 5.pptxPOINT- BIOCHEMISTRY SEM 2 ENZYMES UNIT 5.pptx
POINT- BIOCHEMISTRY SEM 2 ENZYMES UNIT 5.pptxSayali Powar
 
Organic Name Reactions for the students and aspirants of Chemistry12th.pptx
Organic Name Reactions  for the students and aspirants of Chemistry12th.pptxOrganic Name Reactions  for the students and aspirants of Chemistry12th.pptx
Organic Name Reactions for the students and aspirants of Chemistry12th.pptxVS Mahajan Coaching Centre
 
Introduction to ArtificiaI Intelligence in Higher Education
Introduction to ArtificiaI Intelligence in Higher EducationIntroduction to ArtificiaI Intelligence in Higher Education
Introduction to ArtificiaI Intelligence in Higher Educationpboyjonauth
 
call girls in Kamla Market (DELHI) 🔝 >༒9953330565🔝 genuine Escort Service 🔝✔️✔️
call girls in Kamla Market (DELHI) 🔝 >༒9953330565🔝 genuine Escort Service 🔝✔️✔️call girls in Kamla Market (DELHI) 🔝 >༒9953330565🔝 genuine Escort Service 🔝✔️✔️
call girls in Kamla Market (DELHI) 🔝 >༒9953330565🔝 genuine Escort Service 🔝✔️✔️9953056974 Low Rate Call Girls In Saket, Delhi NCR
 

Recently uploaded (20)

Painted Grey Ware.pptx, PGW Culture of India
Painted Grey Ware.pptx, PGW Culture of IndiaPainted Grey Ware.pptx, PGW Culture of India
Painted Grey Ware.pptx, PGW Culture of India
 
18-04-UA_REPORT_MEDIALITERAСY_INDEX-DM_23-1-final-eng.pdf
18-04-UA_REPORT_MEDIALITERAСY_INDEX-DM_23-1-final-eng.pdf18-04-UA_REPORT_MEDIALITERAСY_INDEX-DM_23-1-final-eng.pdf
18-04-UA_REPORT_MEDIALITERAСY_INDEX-DM_23-1-final-eng.pdf
 
Crayon Activity Handout For the Crayon A
Crayon Activity Handout For the Crayon ACrayon Activity Handout For the Crayon A
Crayon Activity Handout For the Crayon A
 
9953330565 Low Rate Call Girls In Rohini Delhi NCR
9953330565 Low Rate Call Girls In Rohini  Delhi NCR9953330565 Low Rate Call Girls In Rohini  Delhi NCR
9953330565 Low Rate Call Girls In Rohini Delhi NCR
 
Pharmacognosy Flower 3. Compositae 2023.pdf
Pharmacognosy Flower 3. Compositae 2023.pdfPharmacognosy Flower 3. Compositae 2023.pdf
Pharmacognosy Flower 3. Compositae 2023.pdf
 
TataKelola dan KamSiber Kecerdasan Buatan v022.pdf
TataKelola dan KamSiber Kecerdasan Buatan v022.pdfTataKelola dan KamSiber Kecerdasan Buatan v022.pdf
TataKelola dan KamSiber Kecerdasan Buatan v022.pdf
 
Framing an Appropriate Research Question 6b9b26d93da94caf993c038d9efcdedb.pdf
Framing an Appropriate Research Question 6b9b26d93da94caf993c038d9efcdedb.pdfFraming an Appropriate Research Question 6b9b26d93da94caf993c038d9efcdedb.pdf
Framing an Appropriate Research Question 6b9b26d93da94caf993c038d9efcdedb.pdf
 
MICROBIOLOGY biochemical test detailed.pptx
MICROBIOLOGY biochemical test detailed.pptxMICROBIOLOGY biochemical test detailed.pptx
MICROBIOLOGY biochemical test detailed.pptx
 
CELL CYCLE Division Science 8 quarter IV.pptx
CELL CYCLE Division Science 8 quarter IV.pptxCELL CYCLE Division Science 8 quarter IV.pptx
CELL CYCLE Division Science 8 quarter IV.pptx
 
Presiding Officer Training module 2024 lok sabha elections
Presiding Officer Training module 2024 lok sabha electionsPresiding Officer Training module 2024 lok sabha elections
Presiding Officer Training module 2024 lok sabha elections
 
Computed Fields and api Depends in the Odoo 17
Computed Fields and api Depends in the Odoo 17Computed Fields and api Depends in the Odoo 17
Computed Fields and api Depends in the Odoo 17
 
Difference Between Search & Browse Methods in Odoo 17
Difference Between Search & Browse Methods in Odoo 17Difference Between Search & Browse Methods in Odoo 17
Difference Between Search & Browse Methods in Odoo 17
 
Enzyme, Pharmaceutical Aids, Miscellaneous Last Part of Chapter no 5th.pdf
Enzyme, Pharmaceutical Aids, Miscellaneous Last Part of Chapter no 5th.pdfEnzyme, Pharmaceutical Aids, Miscellaneous Last Part of Chapter no 5th.pdf
Enzyme, Pharmaceutical Aids, Miscellaneous Last Part of Chapter no 5th.pdf
 
Full Stack Web Development Course for Beginners
Full Stack Web Development Course  for BeginnersFull Stack Web Development Course  for Beginners
Full Stack Web Development Course for Beginners
 
AmericanHighSchoolsprezentacijaoskolama.
AmericanHighSchoolsprezentacijaoskolama.AmericanHighSchoolsprezentacijaoskolama.
AmericanHighSchoolsprezentacijaoskolama.
 
OS-operating systems- ch04 (Threads) ...
OS-operating systems- ch04 (Threads) ...OS-operating systems- ch04 (Threads) ...
OS-operating systems- ch04 (Threads) ...
 
POINT- BIOCHEMISTRY SEM 2 ENZYMES UNIT 5.pptx
POINT- BIOCHEMISTRY SEM 2 ENZYMES UNIT 5.pptxPOINT- BIOCHEMISTRY SEM 2 ENZYMES UNIT 5.pptx
POINT- BIOCHEMISTRY SEM 2 ENZYMES UNIT 5.pptx
 
Organic Name Reactions for the students and aspirants of Chemistry12th.pptx
Organic Name Reactions  for the students and aspirants of Chemistry12th.pptxOrganic Name Reactions  for the students and aspirants of Chemistry12th.pptx
Organic Name Reactions for the students and aspirants of Chemistry12th.pptx
 
Introduction to ArtificiaI Intelligence in Higher Education
Introduction to ArtificiaI Intelligence in Higher EducationIntroduction to ArtificiaI Intelligence in Higher Education
Introduction to ArtificiaI Intelligence in Higher Education
 
call girls in Kamla Market (DELHI) 🔝 >༒9953330565🔝 genuine Escort Service 🔝✔️✔️
call girls in Kamla Market (DELHI) 🔝 >༒9953330565🔝 genuine Escort Service 🔝✔️✔️call girls in Kamla Market (DELHI) 🔝 >༒9953330565🔝 genuine Escort Service 🔝✔️✔️
call girls in Kamla Market (DELHI) 🔝 >༒9953330565🔝 genuine Escort Service 🔝✔️✔️
 

Global cities and ecology

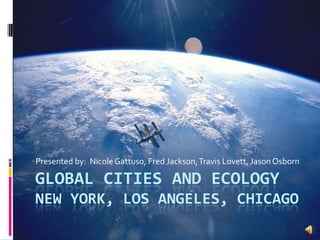
  • 1. Presented by: Nicole Gattuso, Fred Jackson, Travis Lovett, Jason Osborn Global cities and ecologyNew York, Los Angeles, Chicago
  • 2. Chicago New York Los Angeles Source: US Census Bureau http://www.census.gov/geo/www/maps/2010_census_nighttime_map/nighttime_map_2010.html
  • 6. World Population 1750-2050 Source: World Bank http://www.worldbank.org/depweb/beyond/beyondco/beg_03.pdf
  • 7. Energy Consumption (Kwh/capita) Source: World Bank Electric Power Consumption http://www.worldbank.org/depweb/beyond/beyondco/beg_03.pdf
  • 8. Oil Consumption(Barrels/Day) Source: Index Mundi, World Oil Consumption; http://www.indexmundi.com/energy.aspx
  • 9. Air Quality within Urban Environments Without air we would not be able to survive Photo: New York (from Ecoficial, 2010) http://www.ecoficial.com/epa-proposes-stronger-air-quality-standards-for-sulfur-dioxide-589/
  • 10. Air Pollution Carbon Dioxide/Monoxide Sulfur Oxides/Diesel Fuel Nitrogen Oxides This graph provides evidence that atmospheric CO2 has increased since the Industrial Revolution. (Source: NOAA; http://climate.nasa.gov/evidence/)
  • 11. Nature can no longer manage air pollution without our help. Pollution and Global Cities
  • 12.
  • 14. People with existing lung problems
  • 15. ChildrenWho is the most threatened?
  • 16.
  • 21. Premature DeathsWhat are the health effects? http://hubpages.com/hub/air
  • 22. NYC, LA, and Chicago Comparison Air Now http://www.airnow.gov/index.cfm?action=airnow.local_city&zipcode=10026&submit=Go
  • 23.
  • 24.
  • 25. Generates around $5.1 billions in annual state and local taxes
  • 26. Generates $21.5 billion taxes nationwide
  • 27. Value of global trade is estimated to be $250 billion per year.The Port of Los Angeles Air Monitoring Stations in Port http://www.portoflosangeles.org/
  • 28. 44% of all imports to the USA 90% of all trade from East Asia
  • 29.
  • 30. 460,000 Adults and 160,000 Children with Asthma(http://www.stateoftheair.org/2011/city-rankings/most-polluted-cities.html)
  • 31.
  • 34. WilliamsburgNew York’s Air Photo: Bronx with Manhattan in Background By Witzen
  • 35. In April, 2011, New York Times noted troubling levels of diesel pollution in Little Village, Lincoln Park, Ukrainian Village, Wicker Park, Pilsen, and other areas. Chicago’s Air
  • 36.
  • 38. 28,201 asthma attacks each year.Chicago’s Air
  • 39. Clean Air Act – Created in 1970 In 1990 after the Act was in place for 20 years, it is estimated that it prevented more than 200,000 premature deaths and almost 700,000 cases of chronic bronchitis were avoided. ( United States, EPA, 2010) Decades of Progress
  • 40. In 2009, the state of New York adopted additional clean air policies more stringent than the Clean Air Act. New York Initiatives
  • 41.
  • 42. Will reduce diesel emissions by 80% (City of Los Angeles, 2011) Los Angeles Initiatives
  • 43. Alternative Fuel Vehicles By 2012-2013, L.A. plans to covert 85% of all fleet to be powered by alternative fuel. Los Angeles Initiatives L.A.’s last diesel bus One of L.A.’s compressed natural gas buses
  • 44.
  • 46. Sulfur oxides by 52%L.A. Initiatives
  • 47. SPRAWLNew York City, Los Angeles, Chicago OBJECTIVES: What is sprawl Issues created from sprawl Combating sprawl Conclusion
  • 48. SPRAWL Became possible in 1814 in NYC Spreading outwards of a city Specifically, it is considered the rapid expansion of a metropolitan area Leads to suburbanization Creates small communities on the outskirts of the central city Environmental Problems Over consumption of resources
  • 49. Issues created from Sprawl Increase reliance on automobiles results in Health hazards such as: Air Pollution Motor vehicle crashes Pedestrian injuries and fatalities
  • 50. Issues created from Sprawl cont. EFFECTS OF LAND USE Newhall Ranch: Largest housing development ever approved in Los Angeles—for 70,000 people “While the population of the seven-county Chicago metro area experienced a growth rate of 63 percent between 1950 and 2006, that rate jumps to 261 percent by removing the city of Chicago from the equation” (Zekas, 2010) Clearing of a forest for development impacts water quantity and quality
  • 51.
  • 52. Combating Sprawl “Chicago must immediately make green infrastructure a priority” (Lyderson, 2010) The solutions for sprawl rest upon the same actors—individuals, businesses and governing policies—that create sprawl Smart growth encourages more mixed-use and compact development, investments in infill development projects in inner cities
  • 53. Combating Sprawl cont. Smart Growth in NYC- Supporting the purchase of farmland development rights and other farming preservation efforts
  • 54. Combating Sprawl cont. Smart Growth in LA- agreement making area westward of the Newhall Ranch off-limits for development
  • 55. Combating Sprawl cont. Smart Growth in Chicago- plans to redevelop the historic freight and commuter rail assets in southern Chicago
  • 56. Combating Sprawl Conclusion Sprawl is an ever compounding problem in NYC, Los Angeles, and Chicago. It strains vital city resources and creates health hazards Through smart growth efforts sprawl can be limited.
  • 57. Transportation Congestion Pricing Source: http://sustainableflatbush.org/2008/03/27/congestion-pricing-countdown/
  • 59. Public Good versus Common Good Public Good Common Resource Photo: New Delhi, AP Photo, Manish Swarup
  • 60. Market Failure Public Good No User Fee Free Riders Common Good No User Fee Excessive Use Vs. http://tutor2u.net/economics/content/topics/transport/transport_congestion.htm
  • 62. Market Solution Public Good No User Fee Free Riders Common Good User Fee More Efficient Use Vs. Photo: New Delhi, AP Photo, Manish Swarup
  • 63. Lessons Learned by FHWA London, Singapore, and Stockholm Faster Traffic More Transit Less Congestion
  • 64. Lessons Learned by FHWA London, Singapore, and Stockholm Greater Economic Returns Cleaner Air Less Oil
  • 65. Do these apply to NY, LA, and Chicago? Source: Texas Transportation Institute, 2010
  • 66. Life is Better Underground–New York has the two slowest highways in the United States and five of the worst traffic bottlenecks. The subways are a superior choice (Van Zyl, 2010). New York Photo: AP Photo/Bill Kostroun
  • 67.
  • 69. Doesn’t address Taxi and Truck Problems
  • 70. MTA can’t be trusted to use the funding wisely
  • 71. Transit is not viable
  • 72.
  • 74.
  • 75. Vision and Top-Level Leadership
  • 76. Linking it to broader transportation, climate change, and land use goals
  • 77. Let the public shape the final plan
  • 78. Do extensive public education and outreach
  • 79. Leverage leadership from civic, business, labor, environmental and advocacy groups.
  • 80. Design the pricing proposals to win
  • 81. Understand who has authority
  • 82. Understand how they might be influenced by small opposition groups
  • 83.
  • 84. Good Idea - Convert existing car-pooling lanes to toll lanes Los Angeles – A Winning Proposal
  • 85. The Second City is Number 1- Chicago was tied with Washington D.C. as the most congested region in the United State. (Texas Transportation Institute 2010). Chicago
  • 86.
  • 87. Chicago – Shaped by the Public Use this shoulder as a lane and charge a Premium price.
  • 88.
  • 89. Since 1940, agricultural industrialization has significantly increased our food supply to meet global population demands
  • 90. Scientists and environmental advocates argue that fundamental shifts in agricultural food production systems are vital to sustaining future generationsRetailers, such as Wal-Mart, can drastically alter the marketplace for local produce with their purchasing power. Source: http://www.theatlantic.com/magazine/archive/2010/03/the-great-grocery-smackdown/7904/ Click the icon to the left to hear why sustainable agriculture is critical to the future development of global cities
  • 91.
  • 92. Natural resources are being depleted at rates that are currently unsustainable long-term
  • 93. Large-scale factory farms have significantly increased food production over the last generation, but natural resources have been drained significantly; lack of diversity in food sources also poses serious health risks
  • 94. Americans currently throw out about 14% of the food they buyThe map above, provided by Food and Water watch, highlights the presence of factory farms (red indicates farm areas with extremely high animal concentrations) – Source: http://www.factoryfarmmap.org/#animal:all;location:US;year:2007 Click the icon to the right to hear about agricultural production challenges
  • 95.
  • 96. By the year 2050, Columbia Professor Dickson Despommier calculated that “the world will need 1 billion more hectares of arable land by 2050 – roughly the area of Brazil – if projections are true, agricultural processes will need to transform
  • 97. Across the country, there has been extensive growth in the interest of organic food, farmers markets, food labeling, fair trade, local cooperatives, and community supported agricultureProfessor Dickson Despommier (above) is an advocate of vertical farming methods – click the picture above to watch his October 2010 TED Talk on the subject. Click the icon to the right to hear about sustainability in practice
  • 98.
  • 99. Government support for urban farms has been inconsistent, so several nonprofit organizations such as East New York Farms!, Green Guerillas, Added Value, and New York Sun Works have developed extensive networks for farming throughout the city
  • 100. John Ameroso, an urban farm advocate, spent almost 35 years training city farmers and supporting localized farming efforts
  • 101. Farmers markets in New York City have grown 150% from 1994 to 2006, with total sales projections of $1 billion in 2005New York Sun Works builds state-of-the-art greenhouses throughout the city (pictured above). Click the icon to the right to hear about sustainable agriculture practices in New York
  • 102.
  • 103. Access to fresh/healthy food in Chicago is a major issue; to combat the issue, Walgreens announced that they will start selling fresh produce in 39 of their Chicago locations
  • 104. Chicago’s city government has also offered vacant temporary lots in the city for farming purposes; this has had mixed success over the last few years as the average urban farmer made between $20,000 and $23,000 per yearMayor Rahm Emanuel , a political advocate for urban farming, has campaigned on the strategy of improving urban farms. Source: http://www.suntimes.com/news/cityhall/6717226-418/mayor-emanuel-promotes-urban-farms-as-oases-in-food-deserts.html Click the icon to the left to hear about the progress of sustainable agriculture initiatives in Chicago
  • 105.
  • 106. Urban farming initiatives have not yet gained political momentum, but they have gotten the support of Southern California’s leading environmental advocates
  • 107. There are currently 90 food producing farms in Los Angeles County - the city could fully sustain itself on 8.9 percent of the city’s square mileageGraphic courtesy of Farmscape - Source: http://farmscapegardens.com/blog/54 Click the icon to the left to hear about sustainable farming challenges in Los Angeles
  • 108.
  • 109. Air quality issues, sprawl, transportation congestion, and lack of healthy food options have significantly inhibited the potential of global cities to use resources efficiently and effectively
  • 110. Partnerships between scientists, politicians, and the general public will be critical to making the types of large-scale changes we will need to sustain ourselves long-termClick the icon to the left to hear our concluding thoughts on preserving the ecology of our global cities
  • 111. REFERENCES American Lung Association. (2011). Most Polluted Cities. Retrieved 7 12, 2011, from State of the Air 2011: http://www.stateoftheair.org/2011/city-rankings/most-polluted-cities.html California Environmental Protection Agency. (2011, 2 28). Introduction to the Air Resources Board. Retrieved 7 16, 2011, from California Environmental Protection Agency: http://www.arb.ca.gov/html/brochure/arb.htm Clifford, Stephanie. “Wal-Mart to Buy More Local Produce.” The New York Times, October 14, 2010. Web source: http://www.nytimes.com/2010/10/15/business/15walmart.html. City of Los Angeles. (2011). City of Los Angeles. Retrieved 7 13, 2011, from Air - Greening LA: http://mayor.lacity.org/issues/environment/air/index.htm "Chicago Urban Farming: Mayor Emanuel Reverses Daley's Course, Plans Expansion Of City Agriculture” (2011, July 27). Retrieved on July 29, 2011 from The Huffington Post: http://www.huffingtonpost.com/2011/07/27/chicago-urban-farming-may_n_911145.html EPA State Government Victoria. (2011). What is air pollution? Retrieved 8 7, 2011, from EPA Victoria: http://www.epa.vic.gov.au/air/aq4kids/pollution.asp Environmental Literacy Council. (2008). Urban Sprawl. Retrieved on July 11, 2011 from http://www.enviroliteracy.org/article.php/409.html Farrell, P (2005). Contaminated Water Can’t Stop California Sprawl. Retrieved on August 2, 2011 from: https://www.hcn.org/issues/307/15814 Frumkin, H. (2002). Urban Sprawl and Public Health. Public Health Reports May-June 2002. Volume 117. 201-217 Federal Highway Administration. (2008, 12 3). Lessons Learned From International Experience in Congestion Pricing. Retrieved July 29, 2011, from Toll and Pricing Program: http://ops.fhwa.dot.gov/publications/fhwahop08047/es.htm
  • 112. REFERENCES CONT. Goldstein, E. (2003). Suburban Sprawl, City Troubles. Gotham Gazette. Retrieved on July 8, 2011 from: http://www.gothamgazette.com/article/environment/20030616/7/425 Illinois Tollway. (2010, November). Chicago Regional Congestion Pricing Study. Retrieved August 4, 2011, from Illinois Tollway : http://www.illinoistollway.com/pls/portal/docs/PAGE/TW_CONTENT_REPOSITORY/TW_CR_TRAFFIC_CONST/PROJECTS_BY_ROADWAY_CR/FINAL%20REPORT%20CHICAGO%20REGIONAL%20CONGESTION%20PRICING%20STUDY%20NOV%202.PDF Illinois Toll Highway Authority. (2011). 2010 Traffic Data Report for the Illinois Tollway System. Downers Grove, Illinois: Illinois Toll Highway Authority Kleinman, M. T. (2000). The Health Effects of Air Pollution on Children. Retrieved 8 7, 2011, from South Coast Air Quality Management District: http://www.aqmd.gov/forstudents/health_effects_on_children.html Lamb, J. O. (2007, March). New York City's Air is Anything But Clean. Retrieved 8 7, 2011, from The Brooklyn Rail: http://www.brooklynrail.org/2007/03/local/new-york-citys-air-is-anything-but-clean Levenston, M. (2010, July). "Regional Food System for Los Angeles - supports urban agriculture." Retrieved on July 29, 2011 from City Farmer: http://www.cityfarmer.info/2010/09/11/report-regional-food-system-for-los-angeles-supports-urban-agriculture/ Lydersen, K. (2011, April 21). Black Carbon Testing Finds High Levels. Retrieved 8 , 2011, from The New York Times: http://www.nytimes.com/2011/04/22/us/22cnccarbon.html?_r=1&ref=airpollution Lyderson, K. (2010). Sprawl, Climate change, carp control hinder Chicago sewer solution. Retrieved on August 2, 2011 from: http://greatlakesecho.org/2010/12/08/sprawl-climate-change-carp-control-hinder-chicago-sewage-overflows/
  • 113. REFERENCES CONT. Mankiw, N. G. (2008). Principles of Microeconomics. Mason, Ohio: South-Western Cengage Learning NASA. (2011). Global Climate Change Vital Signs of the Planet. Retrieved 8 8, 2011, from NASA: http://climate.nasa.gov/evidence/ National Geographic. (2011). National Geographic Education. Retrieved 7 12, 2011, from Encyclopedia Air Pollution: http://education.nationalgeographic.com/education/encyclopedia/air-pollution/#page=1 New York City’s Water Supply Systems Map. (2007) NYCEnvironmental Protection. Retrieved On July 10, 2011 from: http://www.nyc.gov/html/dep/html/drinking_water/wsmaps_wide.shtml New York State Department of Environmental Conservation. (2009, February). Environmental DEC. Retrieved 8 7, 2011, from New York State Adopts Clean Air Rules to Limit Pollution: http://www.dec.ny.gov/environmentdec/50877.html Purdum, T. (2004). Los Angeles Sprawl Bumps Angry Neighbor. Retrieved on August 3, 2011 from: http://www.nytimes.com/learning/teachers/featured_articles/20000214monday.html Rybczynski, Witold. "The Green Case for Cities." The Atlantic, October 2009. Web source: http://www.theatlantic.com/magazine/archive/2009/10/the-green-case-for-cities/7661/. Sassen, S. (2006). Cities in a World Economy. Thousand Oaks: Sage Publications, Inc. Smith-Peterson, T. (2006). THE SPIGOT. Trains (66(9)), pp. 34-41.
  • 114. REFERENCES CONT. Texas Transportation Institute. (2010, December). 2010 Urban Mobility Report. Retrieved August 4, 2011, from Texas Transportation Institute: http://tti.tamu.edu/documents/mobility_report_2010.pdf The Port of Los Angeles. (2011). Port of Los Angeles 2011 Sustainability Report. Los Angeles: The Port of Los Angeles. The World Bank. (n.d.). World Population Growth. Retrieved August 6, 2011, from The World Bank: http://www.worldbank.org/depweb/beyond/beyondco/beg_03.pdf Tuto2u. (2011). Transportation Economics Congestion and Market Failure. Retrieved August 9, 2011, from Tutor2u: http://tutor2u.net/economics/content/topics/transport/transport_congestion.htm U.S. Department of Transportation Federal Highway Administration. (2011). Policy Information. Retrived on July 10, 2011 from: http://www.fhwa.dot.gov/policyinformation/charts/07.cfm United States Environmental Protection Agency. (2011). Los Angeles Area Environmental Enforcement Collaborative. Retrieved 7 12, 2011, from EPA Pacific Southwest, Region 9: http://www.epa.gov/region9/ej/enforcement.html United States EPA. (2010, 9 14). 40th Anniversary of the Clean Air Act. Retrieved 8 7, 2011, from U.S. EPA : http://www.epa.gov/air/caa/40th.html Van Zyl, J. (2011). The World's Most Congested Cities. Retrieved August 4, 2011, from MSN Autos: http://autos.ca.msn.com/editors-picks/gallery.aspx?cp-documentid=29239351

Editor's Notes

  1. This a presentation by Nicole Gattuso, Fred Jackson, Travis Lovett, and Jason Osborn regarding global cities and ecology. This presentation looks at three global cities and their efforts to limit impacts on the environment. The Cities of New York, Los Angeles, and Chicago are global cities in the United States, the Country with the highest per capita energy consumption (The World Bank, 2011). This presentation will discuss air quality, sprawl, congestion pricing, and sustainable agriculture.
  2. New York City, Los Angeles, and Chicago are the three largest cities in the United States.
  3. Here’s New York, if you can make it here, you can make it anywhere. This presentation covers innovative approaches to lessen and mitigate New York’s impacts to the environment. The environmental initiatives are hard fought in this town and the lessons learned should be noted by everyone.
  4. Los Angeles has a bad reputation as a polluted, superficial, car-oriented city. After this presentation, you will appreciate Los Angeles as anything but. The City and its inhabitants are perhaps more serious about ecological issues than any other city on the planet.
  5. Chicago has a knack for layering government agency on top of government agency making it as complicated as the most advanced computer chip. This giant in America’s heartland gave the world the first modern skyscraper and the first atomic reaction. Lately, it has begun to turn its ambitious rusty eye towards being green.
  6. The world’s population had not exceeded 1 billion until the late 19th century. Today, the world’s population is nearly 7 billion (US Census). The exploding population is increasingly concentrated in and adjacent to specialized resource management centers called global cities (Sassen, 2006). In the 1800s, only 2.5% of the world’s population lived in cities (Luke, 2006, p. 279). Today, over half of the worlds’ population lives within cities.It is in areas that the risk taking and entrepreneurial attributes of humanity converge to creatively use the advantage of these areas (Brugmann, 2010, p. 54). In global cities, the inhabitants find ways to access new and greater amounts of material inputs across the planet to consume locally (Luke, 2006, p. 276).
  7. The scale of the forces creating and sustaining global cities is so intense that they have transformed the Earth’s ecology (Brugmann, 2010, p. 13). This phenomenon is overpowering the Earth’s natural ecology and threatening the sustainability of ecosystems across the planet (Luke, 2006, p. 276). The United States consumes twice as much electricity of the typical European country and over four times as much energy as the China or Brazil.
  8. On any given day, the United States consumes more oil than India, Russia, Brazil, Germany, Saudi Araabia, South Korea, and Canada combined. It consumes more than twice as much as China and four times as much as Japan.
  9. The United States is by far the largest consumer of petroleum on the planet. Congestion pricing is a relatively straight forward, fairly simple to implement, and economical sound tool that could help reduce the amount of fuel wasted in the United States. It has been proposed in New York, Chicago, and in Los Angeles and has yet to take hold. On the left you see a poster from efforts back in 2008 to implement congestion pricing in the New York City Region. The t-shirt on the right encourages the public to ask the person why they support congestion pricing.
  10. Here are three reason’s why one might consider congestion pricing on highways. On any given day, the United States consumes 19 million barrels of oil. 72% of this is burned in cars, planes and trains in general; about 50% for gasoline alone. (U.S. Energy Information Administration; http://www.eia.gov/energyexplained/index.cfm?page=oil_home#tab2)
  11. To answer how and why congestion pricing works. We need to understand basic economics. In an economy, prices are used to signal the value of something to others. Without a price, real things or goods can be underused or overused. When you can’t stop someone from consuming a good and when one additional person consuming that good can do so without changing the levels of consumption by others, this can be considered a public good. A classic example of this is a fire-works display. Now, when the consumption of a good by one individual reduces the ability for someone else to consume and you still can’t exclude people from the good, this type of good is a common resource.Roads are special in that they can be either public goods or common resources. When uncongested, they are not rival in consumption and are public goods. When congested, the road yields a negative externality, a cost that is not included in the operational and maintenance costs of the facility such as wasted time). At this point, a road becomes a common resource (Mankiw, 2008, p. 234). This is a very important to keep in mind. A road might be a public good at 2:00 a.m. and then a common resource at 7:00 a.m.
  12. Users have an incentive to free fide when a public good is provided. For this reason governments tend to provide public goods such as roads. As a road gains more users, government must add lanes to keep the roadway a public good. If congestion conditions occur, the road becomes a common good. If there is no charge for a common resource, it will be used excessively (Mankiw, 2008, p. 238). “When the demand for roads rises above a certain level, road users impose additional costs (externalities) on others leading to a divergence between the private and the social marginal costs of road usage. External congestion costs include increased travel times, increased fuel and operating costs, and pollution. (Tutor2, 2011)”
  13. Even a roadway with few cars has negative externalities. The pavement sheds storm water at high rates and volumes that can disrupt water quality. Additionally, storm water washes motor oil, engine coolants, de-icing salts, crack-sealing materials (tar), road striping (used to be lead based paint now acrylic in the U.S.), and road gravel off the roadway. The road acts as a barrier for all animals including humans. Turtles are often flipped by the curbs, deer can get tangled in fencing, and smaller animals expose themselves to predators such as hawks by crossing. The roadway itself requires site excavation and leveling, the extraction of materials from gravel pits, the production of asphalt and/or concrete, the noise, dust, and noxious smell of construction. As traffic increases, animals are killed at high rates. These collisions damage vehicles and sometimes cause to personal injury or driver fatality. Eventually, more lanes are added to the roadway. But, those benefits might not last. At severely congested levels, cars idle and waste fuel, some cars overheat and leak fluids onto the pavement, travel times become unpredictable, businesses and factories relocate to more predictable transportation areas. On average, a mile of travel emits about 1 pound of carbon dioxide (Metro, 2010, p. 15). Congestion leads to wasted fuel and releases more carbon dioxide then if traffic was moving smoothly.
  14. An efficient way to address congestion on highways is to charge higher tolls during peak hours to provide an incentive to alter schedules (Mankiw, 2008, pp. 235-236). Transportation experts at the Federal Highway Administration have evaluated congestion pricing case studies and a review of the literature regarding those case studies. The FHWA studied congestion pricing in Singapore, London, and Stockholm.
  15. Without exception, congestion pricing reduced congestion and sustained congestion relieve over long periods. Travel speeds inside and outside the priced zones increased, many shifted to use public transit or car pools, and these benefits have not faded.
  16. Without exception, congestion pricing reduced fuel consumption, had positive benefit/cost rations, and helped improve air quality.
  17. According to the Texas Transportation Institute, New York, Los Angeles, and Chicago are at the top of the list for commuters wasting time and gas as a result of congestion. Chicago tied with D.C. last years as the city with the most hours of delay resulting from congestion. Chicago ranked second in terms of waster fuel resulting from congestion. In Chicago and Los Angeles, the average driver wastes about 5 fill-ups at the gas station each year due to traffic delay (assumes 10 gallons per fill-up).New York’s superior transit system can compensate only so much for it’s lack of highway capacity.
  18. New York City has two of the slowest highways in the United States and five of the worst traffic bottlenecks. For most drivers, the best idea is to avoid driving and use New York’s vast transit services. In 2007, having been inspired by the congestion pricing results in London and with support from regional planning association and transit, pedestrian, and biker advocates, Mayor Bloomberg proposed charging congestion prices to vehicles traveling to the core of Manhattan.The Deputy Commissioner for Planning and Sustainability for the New York City Department of Transportation, Bruce Schaller, evaluated the cities 2007 congestion pricing proposal after it had failed to gain legislative acceptance in 2010.
  19. Despite opposing and passionate arguments, there was broad consensus for sustainable modes of transportation and initially the press was generally positive towards the proposal. Supporters of the proposal said it would reduce traffic congestion, help fund improved mass transit, and clean the air. Opponents believed it targeting working class people, is a type of social engineering, didn’t address the problem of taxis and delivery trucks in Manhattan, and that the additional revenues for the MTA would be misused and not worth the time savings.
  20. Bruce Schaller offers this advise to cities wishing to implement congestion pricing. He says that the New York experience highlights how important it is to build support for the pricing proposal. He sighted that continued and steadfast leadership willing to champion the cause is important as well as linking the proposal to broader transportation, climate change, and land use goads. He says extensive public education and outreach and allowing the public to shape the proposals is needed. Additionally, strategic use of civic, business, labor, environmental, and advocacy group leaders is needed.Even with all this support, the pricing proposal has to be designed in such a way as to take into account what legislative body is responsible for implementation and how is this body influenced by the various stakeholders. He recommends crafting the proposal to better suite the realities of these influences. He says ultimately, full blown mileage based pricing might be easier to sell to all parties than congestion pricing alone as it would apply everywhere. He suggests it would be easier to then build off of mileage based pricing schemes to focus on different prices for certain places and times.
  21. The City of Los Angeles has made great strides to reduce roadway congestion. In 2003, the Texas Transportation Institute estimated the average driver in Los Angeles lost 93 hours due to traffic congestion (Economist, 2005). By 2009, this number had been reduced to 63 hours (Texas Transportation Institute, 2010). However, this still adds up to over 515 million hours every year being lost because of traffic jams.
  22. Los Angeles clearly learned from the New York experience.In July 2011, the Mayor Villaraigos announced that 25 miles of the existing car pool lanes on the Interstate 10 and Interstate 110 freeways would be converted to high occupancy toll lanes. To assist with the low income households of $35,000 or less the pilot program will offer a $25 discount off the $75 deposit required to set up a prepaid toll.In New York, there was great skepticism that congested would be relieved or that the additional revenues would go to appropriate expenditures. The Mayor’s proposal was crafted as a “pilot” meaning to some that if all else fails, this doesn’t have to be permanent. This helps diffuse the skeptics by transforming the question from “do you want to do this?” to “do you want to try this?”. Additionally, the mayor helped addressed one of the greatest concerns of the New York experiment, that the working class was being targeted. The discount off of the deposit sounds fair as $75 dollars is expensive.
  23. In 2010, Chicago was tied with Washington D.C. as the most congested region in the United State. (Texas Transportation Institute 2010). In the last fifty years, automobile use has skyrocketed in the region. The Illinois State Toll Highway Authority has been operating in the Chicago area since 1959. The system operates throughout Northeastern Illinois from Rockford in the west to Indiana in the east. In 1959, the system had 899 total lane miles and the average number of vehicle trips on the system was 62,000. In 2010, the system had more than doubled in terms of lane miles (2,049) but the number of vehicle trips had increased over 23 times (1,445,000 vehicle trips were using the system each day). To put this growth in perspective, there were 69 trips per lane mile in 1959 and there were 705 trips per lane mile in 2010. The construction of new lanes on the highway is not keeping pace at all with this exploding growth in use. As such, it is not a surprise to anyone in Chicago that the city would top the congestion charts.
  24. Deputy Commissioner Bruce Schaller from New York advised that those wanting to implement congestion pricing better have an outstanding amount of support. In 2010, that’s what happened in Illinois.In July 2010, RaghuKowshik, a consultant from Wilbur Smith Associates, Rocco Zucchero of the Toll Highway Authority and Peter Skosey of the Metropolitan Planning Council completed a congestion pricing study for the Chicago region (Kowshik, Skosey, & Zucchero, 2010). This study focused on congestion pricing as a tool to address the Chicago region’s crippling traffic congestion. The benefits measured for appyling congestion-pricing were great and that previously perceived negatives, such as diversions to local roads, were none-existant if the pricing came with a new travel lane (Kowshik, Skosey, & Zucchero, 2010, p. 15). A very comprehensive outreach effort stemming from that research was undertaken. Step One was to present these findings and provide additional briefs. Step Two was to hold elected and stakeholder workshops. Step Three was to hold focus groups with different types of users such as automobile and trucking. Step Four has to compile a state preference survey. 85% said they would pay an extra toll it assures me mytravel won’t be slowed by traffic conditions40% said they are able to access a sufficient numberof transit routes from my neighborhood82% said I support using tolls to pay for highwayimprovements that relieve congestion97% said I’ll use a toll route if the tolls are reasonableand I save timeVirtually none of the mayors in the region wanted to make all the tolls subject to congestion pricing (Skosey, personal communication, July 14, 2011). New managed lanes, separate lanes with higher or premium toll prices, were preferred. The preference was to tie the implementation of congestion pricing with an increase in transit services in the same area to lessen the effects of persons being priced off the highways.Also in 2010, an ad hoc Strategic Advisory Team consisting of a broad range of regional and local interestscharted a path for a future in which the Toll Highway will use congestion pricing as a cost-effective solution to avoid huge costs of widening and adding new toll roads (IlllinoisTollway Strategic Advisory Team, 2010, p. 12).
  25. Previous analysis has shown that a priced lane on I-90 could reduce travel times from Illinois Route 31 (the Elgin/Algonquin area) 21 miles to O’Hare Airport by 38 minutes over the no build option for those using the congestion-priced lane and 22 minutes less for the regular toll users (Kowshik, Skosey, & Zucchero, 2010, p. 15). These are staggering reduction numbers for a 21 mile stretch. Bruce Schaller from New York advised allowing the public to shape the proposals is needed with strategic use of civic, business, labor, environmental, and advocacy group leaders.Two months ago, on May 26, 2011, the Illinois State Toll Highway Authority announced the creation of an I-90 Corridor Planning Council to guide a plan for the I-90 Corridor including the Jane Addams Memorial Tollway from Rockford to O’Hare Airport and the Kennedy Expressway from O’Hare Airport to the loop (Illinois Tollway, 2011). The plan will be developed with assistance from the Regional Transportation Authority to target transit improvements. It will develop a cost estimate for a new congestion-priced lane using existing highway shoulder where possible. This lane will be dedicated to express bus service and users willing to pay a premium toll. Unlike most add lane projects where the increased capacity is all too often simply filled with more vehicles, the managed lane approach offers a mechanism to retain these benefits. Peter Skosey from the Metropolitan Planning Council said that the project will look at a managing the toll fares on this lane in a manner to maintain freeflow or uncongested conditions in that lane (personal communiciation, July 14, 2011).