SlideShare a Scribd company logo
1 of 47
Download to read offline
University of Southern California
DEPARTMENT OF AEROSPACE AND MECHANICAL ENGINEERING
AME-409: SENIOR DESIGN PROJECT
Spring 2017
T180RX
Final Project Report
(Team 5)
Aishwarya Adgaonkar, adgaonka@usc.edu
Scott Cooper, scottaco@usc.edu
Karissa Hendrie, khendrie@usc.edu
Maria Mendoza, mendozmg@usc.edu
Sifat Syed, sifatsye@usc.edu
Monica Perez, perezmon@usc.edu
Submission email address: Final_R.9l0a1g3e37gz19qo@u.box.com
Date Submitted:
May 5, 2017
Table of Contents
1 Introduction 4
1.1 Traffic Congestion 4
1.2 Air Quality 5
1.3 Public Transportation 5
1.4 Electric Vehicles 6
1.5 Fuel Cell Vehicle 6
1.6 Hybrid Electric Vehicles 7
1.7 Preferred Advanced Technology 7
1.8 General Requirements 7
2 Style Design 8
2.1 Design Target 8
2.2 Performance Objectives 9
2.3 Technology Objectives 9
2.4 Cost Objectives 10
3 Performance 10
3.1 Power Requirement 10
3.1.1 Power Required to Overcome Drag and Rolling Resistance 11
3.1.2 Maximum Power Required 12
3.2 Powertrain Design 12
3.2.1 Engine and Motor Power Split 14
3.2.2 Engine and Motor Specifications 15
3.3 Drivetrain Design 16
3.4 Power Curve and Acceleration Performance 17
3.4.1 Acceleration Calculation 18
4 Energy System 19
4.1 Mission Scenario Analysis 20
4.2 Battery Requirements 22
4.3 Energy Schematic 22
5 Steering and Suspension Dynamics 23
5.1 Steering Design 23
5.2 Suspension Design 26
6 Packaging Design 28
1
7 Weight and Cost 30
7.1 Weight Schedule 30
7.2 Cost Estimate 32
8 Comparison with Competitors 33
9 Conclusions 34
10 Recommendations 34
11 References 35
12 Appendix 36
Appendix A: Vehicle Specification Sheet 36
Appendix B: The White Method 40
Appendix C: Power Required Calculation 41
Appendix D: Power Curve 42
Appendix E: Acceleration Curve 43
Appendix F: Steering Angle 44
Appendix G: Gain Curves 45
Appendix H. Suspension Design 46
2
Abstract
As of the past decade, concerns for pollution and air quality, especially in Los Angeles,
have rapidly risen. A large contribution to this problem is the growing population in the Southern
California city. Along with this comes the difficulty of transportation in the bustling suburb, as it
is considered necessary to own a car in order to get from point A to point B. As a result, the use
of cars is one of the highest in the world, contributing widely to harmful emissions being emitted
from these vehicles that are being used everyday by most Angelenos. However, the T180RX has
been designed to help eliminate this growing problem that is greatly contributing to the world’s
climate change. This vehicle seeks to provide outstanding performance while maintaining
competitive fuel efficiency and overall usefulness as a daily-drivable vehicle. The T180RX
would pioneer the market of performance oriented hybrid hatchbacks. There are currently none
on the market that have similar specifications. The T180RX produces 438 HP with the combined
electric motor and 2.4 liter turbocharged 4-cylinder engine, accelerating from 0-60mph in 2.19
seconds. Yet it is also able to cruise with zero emissions for half an hour during a regular driving
period and achieve a combined fuel rating of 26.5 MPG using hybrid technologies such as
regenerative braking.
3
1 Introduction
Los Angeles is best known for being the cultural, financial, and commercial center of
California. It is the second most densely-populated city in the United States and the most
populated in California with thirteen million inhabitants covering an area of about 1210 km​2​
. [1]
Driven by international trade, technology and petroleum industries, manufacturing centers, and
tourism, Los Angeles has become one of the busiest and most economically independent cities in
the Western Hemisphere. This attractive city for foreigners and locals offers an extensive
network of freeways, transit systems, airports, and seaports allowing easy access to different
regions and aid with daily activities; however, due to its dense population, Los Angeles these
resources are not been enough and has progressively became an issue due to increases in traffic
congestion, air pollution, and greenhouse gas emissions.
1.1 Traffic Congestion
Traffic in Los Angeles has been an ongoing challenge for traffic engineers and a
repeatable topic in national and global news. In 2015, Los Angeles was ranked U.S. most
congested region and the second heaviest traffic globally with every driver spending an
estimated average of 81 hours per year in traffic following London. [2] This average has since
grown as reported by ​ABC NEWS​ in 2017 to 104 hours per driver every year making Los
Angeles the city with the worst commuter traffic.
Even though traffic is associated with a stable economy and continues urbanization of
cities, it can also lead to an increase in driver’s cost due to its counterproductive nature, fuel
expenditure, and other health related issues. It is estimated that traffic costs the average driver
$2,408 a year. [3] Heavy traffic is due to the high automobile ownership and LA’s
overpopulation. Even though there are efforts for reduce the number of cars driving at peak hours
through carpool services and lanes, every year the number of drivers and cars continue to
increase resulting in increased pollution.
Figure 1. Vehicles in rush hour in the I-405 freeway in Westwood, CA neighborhood.
Source: Forbes Magazine
4
1.2 Air Quality
Thousands of Californians are currently living in and breathing polluted air everyday. In
April 2016, ​Los Angeles Times​ reported Bakersfield having the highest airborne particles spewed
by highway traffic, trucks with diesel engines, and equipment for farms and fireplaces. Although
not entirely due to traffic, a significant contributor of harmful ozone pollution is vehicle
emissions. Air pollution has been known for threatening human health by triggering asthma,
heart attacks, lung cancer, and other premature death-related diseases.
Environmental issues also arise from air pollution. Climate change, rising temperature
and El Niño are due to climate change and are a direct consequence of the heated hydrocarbons
and nitrogen oxide emitted in vehicle smog. Fortunately, industries have invested billions of
dollars on air cleaning techniques that have reduced pollutants by 80% since 1980’s. [4] Car
manufacturers have also opted for newer technologies with zero or partial emission and improve
efficiency.
1.3 Public Transportation
Currently, Los Angeles County Metropolitan Transportation Authority offers a system of
bus, subway, and light rail lines around the city. A 2005 study shows that 10.2% of Los Angeles
commuters use public transportation making the subway and bus system the 9​th​
and 2​nd​
busiest in
the country, respectively. [6] With such small portion utilizing this service, traffic congestion
during peak hours is overwhelming. Many residents of Los Angeles, regardless of traffic, still
choose to drive over public transportation due to inconvenience. Surveys have shown that local
commuters are unhappy about the travel time, cost, and difficult access to certain areas while
many other residents list unreliability and safety concern as main reason for opting out of LA
public transportation system. [5] The LA transit map is shown in Figure 2.
Figure 2. Map of the Los Angeles Transit System.
5
To reduce the impact on the environment, car companies have developed vehicles that
produce partial to zero emission. In addition, California has become more stringent with
emission standards. Eco-friendly vehicles mainly function on alternative energy sources without
using fossil fuel or less carbon intensive gasoline or diesel.
1.4 Electric Vehicles
Electric vehicles (EV) store energy in rechargeable batteries to power and propel the
vehicle forward. Once empty the battery is easily recharged by plugging it into a wall socket.
EVs are considered green because they do not pollution like a normal gasoline engine. They have
also become cheaper to operate than gasoline-based vehicles saving the average driver one third
of the typical fuel costs incurred by a gasoline-powered. [7] ​​
As of mid 2016, the world’s top
selling electric cars are the Nissan Leaf and Tesla Model S.
Figure 3. Mid 2016 world's top selling electric vehicles (left) Nissan Leaf and (right) Tesla
Model S.
1.5 Fuel Cell Vehicle
Fuel Cell Vehicles (FCV) also significantly reduces the cost dependence on oil prices and
harmful emissions to the environment. FCVs convert hydrogen gas and oxygen into electricity to
power the electric motor and battery while also storing energy from regenerative braking to
provide additional power to the motor. It contains a hydrogen storage tank where hydrogen is
compressed at extreme pressures to increase driving range. [8] Toyota and Hyundai have
engineered the most popular Fuel Cell Vehicles with the Mirai and Tucson models.
Figure 4. Most Popular Fuel Cell Vehicles (left) Toyota Mirai and (right) Hyundai
Tucson.
6
1.6 Hybrid Electric Vehicles
A Hybrid Electric Vehicle (HEV) uses a combination of an electric motor and a
conventional gasoline or diesel engine to improve fuel economy and increase power. These
vehicles run on fuel without needing to be plugged into an electrical outlet. When compared to
battery electric vehicles, HEVs have an extended driving range by lowering the all-electric
threshold. Technologies typically available in a HEV are regenerative braking, electric motor
drive assist and automatic star/shutoff. The most popular hybrid cars in 2016 are Toyota Prius
and the Ford Fusion.
Figure 5. Most Popular Hybrids (left) Toyota Prius and (right) Ford Fusion.
1.7 Preferred Advanced Technology
From the three previously mentioned eco-friendly technologies, the most accessible and
viable choice for today’s existing conditions is a hybrid. Even though fuel cell cars and pure
electric produce less harmful emissions, manufacturing is more expensive and infrastructure for
hydrogen delivery in the city is very limited to satisfy driver’s needs. Moreover, the most
affordable EVs have a limited driving range of approximately 80 miles with long refueling times
between six to eight hours, depending on the size of the battery. [9] For Los Angeles commuters
and environmental concerns, the best option is a hybrid vehicle.
For our design, we are committed to providing consumers with a hatchback style hybrid
vehicle catering to the thrill seeking, adventurous driver who wish to drive in the fast lane while
also conquering rough terrain. With the aggressive and sleek aerodynamic design of the car
body, our objective is to create a unique and eco-friendly experience or our customers, as well as
produce a cost efficient LEV.
1.8 General Requirements
In order to combat the rising trends of pollutants and carbon emissions in urban areas, a
partial zero emission vehicle will be designed to meet the needs of a typical Los Angeles
commuter. The vehicle should meet or exceed the requirements listed in Table 1.
The vehicle should also have minimum smog emissions and energy consumption.
Utilizing current available technologies, the T180RX will have easy handling. And finally, it
7
should be attractive and marketable compared with current vehicles in its class. One major issue
that will arise when designing this vehicle is the struggle to balance power and fuel efficiency.
Table 1: T180RX vehicle performance requirements
Maximum Speed 120 mph
Acceleration 0-60 mph in 6 secs
Freeway Cruise Speed 60 mph
Minimum Zero Emission Range 30 miles at 60 mph
Total Range 320 miles (local and highway)
2 Style Design
2.1 Design Target
The T180RX is a production compact hatchback styled around on and off road
performance rally racing. The automobile would be marketed towards car enthusiasts as well as
daily drivers who desire reasonable performance coupled with aggressive styling . Currently,
there are no hybrid vehicles on the market that combine the hatchback’s day-to-day usefulness
with performance features. Therefore, our designed vehicle will fill this gap in the market.
Concept drawings are illustrated in Figure 6.
Figure 6. T180RX 3-View conceptual drawings (appendix A)
Aggressive and performance oriented styling was chosen to attract the described targeted
audience. A wider body style, when compared to others in its class, allows for widened and
8
flared wheel wells. The hood features a bulge with air vents on either side. The front bumper was
designed to incorporate an intercooler and thus has a large vent.
The dimensions of the T180RX as seen in Table 2 were created and estimated using cars
in similar classes in conjunction with the aesthetic proportions of the concept drawings. The
weight was found from averaging the weights of the Volkswagen GTI, Ford Focus RS, and
Subaru WRX STI. The frontal area was estimated from the concept art.
Table 2: General dimensions of the T180RX
Height 4.83 ft 1.47 m
Length 14.2 ft 4.32 m
Width 5.83 ft 1.78 m
Weight 3384 lb 1525 kg
Frontal Area 20.99 ft​2
1.95 m​2
2.2 Performance Objectives
To compete with existing cars in the market, the maximum speed was chosen to be 120
mph with a 0-60mph acceleration time of 6 seconds and desired range of 320 miles. The target
MPG is 24 in the city.
The T180RX, as a compact hatchback, should handle very well and have agile but stable
steering. The steering radius is likely and most desirable to be 2 to 2.5 times the total length of
the vehicle, or approximately 2.9-3.6 m. The steering response and sensitivity of the vehicle will
depend on the speed. At low speeds the power steering will work more to increase sensitivity,
while at high speeds the power steering will work less to provide the driver with more direct feel
over the vehicle. The suspension should be stiff enough to provide good road feeling without
forfeiting too much comfort while driving. The addition of multiple suspension settings will
allow the driver to change stiffness based on desired driving conditions.
2.3 Technology Objectives
There are three popular powertrains for hybrid vehicles currently in production: series
hybrid, parallel hybrid, and dual hybrid. The series hybrid uses a gasoline engine and battery to
power a motor which then turns the drive axle. The parallel hybrid uses an engine that can turn
the drive axle through a transmission and also has a battery powered motor that can also turn the
axle. Lastly, the dual hybrid utilizes an engine that can drive the axle and charge the battery in
addition to a motor that can perform the same functions, leading to increased efficiency. Table 3
compares the different hybrid typed on fuel economy and driving performance.
From Table 3, it is clear that the dual hybrid powertrain offers the most advantages, while the
parallel hybrid powertrain is a close second. The main differentiator however, was the cost of the
powertrain. While the dual powertrain is the most efficient owing to the additional power split
9
device, its cost is too high. Since, the T180RX is aimed at the economic luxury segment, it was
decided to use the efficient yet affordable parallel powertrain.
Table 3: Hybrid Powertrain Comparison Chart
Hybrid
Type
Fuel Economy Driving Performance
Idling Stop
Energy
Recovery
High
Efficiency
Operation
Control
Total
Efficiency
Acceleration
Continuous
High
Output
Series Superior Excellent Superior Superior Unfavorable Unfavorable
Parallel Superior Superior Unfavorable Superior Superior Unfavorable
Dual Excellent Excellent Excellent Excellent Superior Superior
2.4 Cost Objectives
The T180RX was designed to be a upper-middle end hatchback accommodating 4
passengers. The T180RX targets middle class individuals with emphasis on ages 16-28.
Therefore, all attempts were made to embody an entry-level performance coupé. It is designed to
grab attention and while being compact, fun, and unique.
The targeted purchase price for the T180RX is $35,000. The material costs and labor
costs in manufacturing the T180RX are approximately $14,875 and $2,275, respectively. The
operation costs over a five year period across similar vehicle models, such as the 2016
Volkswagen GTI, 2016 Ford Focus and the 2016 Mazda Speed 3 Hatchback, is approximately
$34,500. This total took into consideration depreciation, fuel costs, insurance, taxes, and
maintenance/repairs. However, since our model will be designed as a hybrid vehicle this value
will slightly decrease due to fuel savings. Expected technology such as heated seats, bluetooth
navigation system, cruise control, etc. will be including in the manufacturing costs.
3 Performance
3.1 Power Requirement
The required total power, of a vehicle at any constant velocity before drivetrain losses is given
by a sum of the powers to overcome rolling and drag forces, respectively, given by equations (1)
and (2) where ​⍴​ is the density of air, ​A​ is the vehicle’s frontal area, ​V​ is the vehicle’s velocity, ​m
is the vehicle’s mass, and ​g​ is the gravitational constant.
(1)
(2)
10
The rolling friction coefficient ​f​R​ typically varies from 0.01 to 0.03 and increases with the
vehicle’s velocity. Because the vehicle would likely see high speeds ​f​R​ was set to 0.025. The
coefficient of drag ​C​d​ was estimated using the White method and found to be 0.33± 0.7, the
relevant calculations can be seen in appendix B.
The White method is an empirical method using statistics from real vehicles and their
geometries. Since a vehicle is not a simple geometry, there methods would include wind tunnel
testing and therefore are not applicable to this design process.
3.1.1 Power Required to Overcome Drag and Rolling Resistance
With ​C​d​ and ​f​R​ calculated, the drag and rolling resistance forces can be calculated using
previously defined quantities such as frontal area and mass. Since these two forces will act on the
car continuously throughout the drive, they must be overcome requiring additional power.
The power needed to overcome rolling resistance (P​r​), drag (P​d​), and the total power required (P​t​)
can be calculated using the following equations. All are a function of the velocity.
(3)
(4)
(5)
Figure 7 shows the power required at the wheel to overcome the drag and rolling resistance.
Figure 7. Required power at wheel as a function of the velocity
11
As can be seen from the figure above, rolling power is linearly related to velocity, while
drag and consequently, the total power have a cubic relationship with the velocity
3.1.2 Maximum Power Required
Figure 7 only displays the power required for a car to travel on a flat road. However, this is not
necessarily the maximum power required, as it does not take into consideration the power needed
to travel up an incline. The maximum power is the maximum power required to either accelerate
from 0 to 60 mph, cruise at 60mph up a incline, or maintain the max speed of 120 mph. As noted
by, where
(6)
(7)
(8)
The results of the above calculations are summarized in the table 4. The maximum power
required at wheel was found to be 147 hp (110 kW)
Table 4: Summary of Power Required
Total Power [hp] Total Power [kW]
P​t​ at 120mph 109.011 81.290
P​t​ to accelerate from 0 to 60 mph 147.761 110.185
P​t​ at cruising speed on an incline 101.750 75.875
Max wheel power required 147.761 110.185
The calculations used for the values and figures computed in section can be seen in Appendix C.
3.2 Powertrain Design
The major requirement for the T180RX is that it has a hybrid powertrain. The three main
options for hybrid design are series, parallel, and dual. In a series hybrid, the engine is only used
to generate electrical power, in a parallel hybrid the engine and motor drive the car, and in a dual
hybrid the engine both generates electricity and drives the vehicle with the motor. Table 5 ranks
each hybrid configuration based upon performance and fuel economy characteristics.
12
Table 5: Comparison of fuel efficiency and driving performance for series, parallel and dual
hybrid drivetrain.
From table 5 one can see that the dual configuration hybrid vehicle outperforms both the parallel
and series configurations in both fuel economy and driving. For these reasons the dual
powertrain was chosen for the T180RX as it is a performance oriented vehicle.
Table 6: The function of the engine, motor, and battery during different vehicle driving modes.
While there are no specific fuel and energy consumptions available yet, fuel economy
was optimized in all modes. For example, the T180RX will be equipped with regenerative
braking, where the engine is used to generate electricity during braking. The flow of materials,
energies, and signals are illustrated in Figure 8, a functional diagram.
13
Figure 8. Functional diagram of dual hybrid
It is seen in Figure 8 that the hybrid aspects complicate the functional process of the
vehicle and require many more components than a regular internal combustion engine vehicle.
The chosen components to fulfill the three main processes, convert the fuel to mechanical
energy, store electrical energy, and convert electrical energy, will respectively be an internal
combustion engine, lithium ion battery, and electric motor.
3.2.1 Engine and Motor Power Split
Since T180RX ​is a parallel hybrid, it is necessary to determine how much power will
come from the engine and how much will come from the motor. As calculated earlier, the
maximum power needed at the wheels for the T180RX is 147 hp or 110 kW, so the engine or
motor must combine to provide this amount of power at the wheels.
Because efficiency is the main objective of the T180RX, our goal was to opt for the
minimum battery required to keep the weight of the car to a minimum while meeting all the
performance goals. Before the components can be selected, it is necessary to account for the
losses between where the energy is converted - the engine and motor - and where the energy is
applied - the drive wheels. In a typical manual transmission car, about 18-21% of the power that
the engine and motor produce is lost before it gets to the wheels. Therefore, the maximum power
required after these losses, is calculated as:
(9)
14
Thus, it was found that the engine and motor must produce 187.039 hp or 139.475 kW to
completely power the vehicle. Once this is known, it is possible to calculate the minimum
amount of energy needed in the battery. Since one of the main design goals of the T180RX is to
have a 30 mile zero-emission cruise at 60mph, the minimum energy, E​min​, required can be
calculated as:
(10)
From this equation it was found that the minimum battery energy required onboard is 11.224
kWh.
It was decided that the power split strategy used for the car would be to minimize the
battery. Thus, ​E​onboard​ ​= Emin and a battery with a minimum 11.224 kWh capacity was found.
The most suitable battery found to meet these requirements was the Mitsubishi iMiEV 16kWh
Li-Ion battery. Thus, the ​E​onboard​=16 kWh according to the battery’s specification and the Battery
P/E ratio was found to be 3.0.
With the Battery P/E ratio known, the engine and battery design space can be seen
graphically in Figure 9​ ​ below:
Figure 9. Engine/Battery Design Space
3.2.2 Engine and Motor Specifications
With ​E​onboard​ and Battery P/E ratio known, the valid ​P​motor​ range, ​P​motor​ , and ​P​engine​ can be
calculated with equations (11) and (12).
15
(11)
(12)
From the above equations, ​P​motor​ was chosen to be 48 kW and ​P​engine​ was calculated to be
86,475 kW. Taking the minimum power required for the engine and motor into consideration,
and the goal of a powerful car, the following engine and motor were selected for the T180RX​.
Table 7: Engine Specifications
Engine BMW 1.6 liter EP6/EP6C
Horsepower 118 hp (88 kW) at 6000 rpm
Torque 118 lb-ft (160 N·m) at 4250 rpm.
No. of Cylinders Four
Displacement 1598 cc
Stroke 85.8 mm (3.4 in)
Table 8: Motor Specifications
Motor Permanent magnet AC synchronous motor
Power 53 kW
Torque 120 lb.-ft. (163 N•m)
Voltage 600V
The selected motor and engine are a great fit for the T180RX because it provides slightly
more power than the conservative estimate from Figure 9. It is always a good idea to build a
margin into designs to avoid any unforeseen power losses. In addition, the engine is a BMW
engine, and the motor is used in a Toyota Prius, making them both highly reliable components.
Thus, we anticipate that the customers will be very happy with their ride quality.
3.3 Drivetrain Design
In order to deliver the power generated from the engine, a drivetrain is needed. A gearbox
is used to deliver maximum engine power without having to accelerate to the maximum road
speed. Additionally, having gears increases the efficiency of the engine, since an engine is the
most efficient near the maximum speed. This relationship is evident from equation (13) where V
16
is the car’s velocity in miles per hour, D is the diameter of the wheels in inches, N is the number
of rotations per minute, G is the gear ratio, and R is the differential ratio.
(13)
While V, D, and N are known, G is assumed to be 1.0 at the car’s maximum speed. From
this, R is calculated to be 2.5. With R known, all the gearbox ratios were calculated and can be
seen in Table 9.
Table 9: Transmission Gear Ratios
Gear Speed (mph) Gear Ratio, G Differential Ratio
2.51 20 6.0
2 40 3.0
3 60 2.0
4 80 1.5
5 100 1.2
6 120 1.0
A similar process is completed for the motor as well, but since the motor is not geared,
the gear ratio is 1. Once the motor reaches its maximum power output, it continues to produce at
the level regardless of speed. While is this is only a simplification, it works well for near perfect
results.
3.4 Power Curve and Acceleration Performance
Now that the gearbox and differential ratios for the engine are known, and the
specifications and output of the motor is known, it is possible to calculate the Power Available
for the T180RX. After the power available from the engine and motor were calculated, they were
added to the power required chart and can be seen in the Figure 10. The data for this chart can
be referred to in Appendix D.
17
Figure 10. Power Available and Power Required Chart (WHP)
In the Figure 10, the solid red, blue and orange lines represent the total power available,
the power available from engine, and the power available from the motor respectively. The solid
grey line, the dashed green line and the dashed purple line represent the total power required, the
drag power required and the rolling power required respectively. As can be seen from the figure,
the total power available is much higher than the total power required, which is necessary for
efficient acceleration. The six peaks of the engine power available and total power available are
the points when the engine is operating at its most efficient in each of the 6 gears. Also, the
motor does not provide completely constant power in reality, however it is a reasonable
simplification to make.
3.4.1 Acceleration Calculation
In order for a car to accelerate, additional power beyond the power required to overcome
drag and rolling resistance is needed. Therefore, any available power that is not being used to
overcome the resistance forces can be used to accelerate the car. This is shown in the equation
(13).
(13)
18
Where P​e​ is the excess power available, P​a​ is the total power available, and P​r​ is the required
power available at that speed. On integrating with respect to time, and breaking the velocity in
intervals, the average excess power available is found as:
Then the average acceleration due to that excess power and the time that passes at that step is
calculated using equations (14) and (15).
(14)
(15)
With this the time needed to accelerate from one velocity to another can be found, and
the results can be seen in the Figure 11. These calculations can be seen in Appendix E.
Figure 11. Acceleration curve. 0 -60 mph time indicated at 6.9 sec.
From the Figure 11, it can be seen that it takes 6.94 seconds to reach 60mph. This shows
that the chosen engine, motor and battery have led to a good performance of the car, and has
helped us to almost reach our set performance goal of 6 seconds. Overall, we are very pleased
with the acceleration performance of the T180RX.
4 Energy System
Once the acceleration performance is evaluated, it is possible to analyze the energy
consumption of the car. In order to analyze the energy consumption, it is necessary to determine
the power usage of the car during different scenarios like, acceleration, deceleration, cruising,
hill climbing, etc.
19
1.​ ​Calculate Energy Usage for Acceleration
The energy required during acceleration can be found by summing the energy for every segment
by using the below equation.
2.​ ​Calculate Energy Usage for Deceleration
3.​ ​Calculate Power Usage for Cruising
4.​ ​Calculate Power Usage for Hill Climbing
Where, BSFC is the Brake Specific Fuel Consumption and is defined as the fuel flow per
horsepower. The BSFC for most car engines is about 0.5[lb/hr]/HP. The BSFC depends on the
engine speed, and the values were calculated from the following chart.
Figure 12. Customized BSFC chart for T180RX engine.
4.1 Mission Scenario Analysis
Since there are many potential ways to a design a car’s use and creation of energy, it is
imperative to have a target driver and consider how the driver will use the car. The target
T180RX​ driver is assumed to be a young person who would be driving in the city, hence will
mostly be cruising, and braking. Taking this into consideration, a Mission Table was created.
20
Figure 13. Mission scenario table with calculated results for T180RX.
Once the power usage for every scenario was calculated, and the corresponding engine
speed and BSFC were found, the total energy usage, energy per cycle for the engine, and the
energy per cycle for the motor were calculated according to the Engine-Motor energy split. The
number of cycles for every scenario were determined according to the target driver of the car,
which allowed us to find the total energy usage for the engine and the motor. The total time, and
the total range of the car were also determined.
The total fuel needed was then calculated using equation (16).
(16)
This was then converted from kg to gallons. Further the fuel tank size was determined by
adding 10% to the total fuel needed and was found to be ​16.5 gallons​. Finally, the MPG was
calculated as follows and was found to be:
The dimensions of the fuel tank selected can be seen in table 10.
Table 10. Dimensions of gasoline tank in T180RX.
Gasoline Tank Dimensions
Length 0.38m
Width 0.38m
Height 0.38m
21
4.2 Battery Requirements
The battery in the T180RX​ ​will be a Lithium-Ion battery, which was chosen for its high energy
and power densities, and long life cycles. The properties of the battery can be seen below:
Table 11. Battery Properties
Producer Mitsubishi iMiEV
Energy Density 109 Wh/kg
Voltage 330 V
Range 128 km (80 miles)
Weight 146 kg
Number of Cells 88 cells
Charge time 13h at 115VAC
15A
7h at 230VAC 15A
4.3 Energy Schematic
Once all the components of the car were chosen, it was necessary to decide their layout
keeping the weight balance in mind. After trial and error, the layout shown in the figure below
was chosen.
22
Figure 14. Energy System Schematic
As can be seen in the energy schematic, all attempts were made to successfully balance the
weight throughout the T180RX.
5 Steering and Suspension Dynamics
5.1 Steering Design
The Ackerman level of a vehicle’s steering linkage geometries defines the radii of which
each steering wheel will rotate about while the vehicle is negotiating a turn. Pure Ackerman
provides that both the steering wheels’ turn radii coincide on the same turn center or that each
wheel follow concentric curves. Under Ackerman causes the inner wheel to try to follow a
smaller diameter circle than the car actually does, while over Ackerman does the opposite.
Ideally pure Ackerman will provide the least wear on the tires and the best steering response
however, actual cars do not use pure Ackerman steering linkage because of dynamic effects.
Pure Ackerman linkage design was chosen for the T180RX since these dynamic effects are not
currently accounted for.
The maximum steering arm, , to achieve the desired max inside steering angle, , foundamax δmax
using equation (17).
23
(17)
where
Thus the maximum steering arm was found to be 4.2 feet. The actual steering arm length,
, was chosen to be 10 inches as the normal range is from 10-13 inches. A steering arm length ina
this range provides that the steering response of the trapezoidal linkage will be converge as close
to the Ackerman linkage as possible.
The following drawings show the Ackerman linkage with the corresponding dimensions.
Figure 15. Ackerman linkage design.
24
The vehicle steering dimensions are presented in table 12.
Table 12. Vehicle steering dimensions.
Vehicle and Steering Linkage Geometry Dimension
L 8.67 ft
t 5.32 ft
a 0.83 ft
b 4.832 ft
β 17.06 (deg)
α 43.74 (deg)
δimax 29.2 (deg)
The lateral acceleration gain and the yaw speed gain were calculated using equations (18)
and (19), respectively. Graphing steering angle over curvature as seen in Figure 16, we see a
linear relationship at various velocities.
(18)
(19)
25
Figure 16. Steering angle vs Curvature plot
5.2 Suspension Design
The unsprung mass of the vehicle was calculated as 14% of the curb weight, and was
found to be 474 lbs. The sprung mass was then calculated as 2910 lb. For our vehicle, values for
the spring rate, rear spring rate, and body spring rate are listed in Table 13. These values were
obtained from the suggested range of values for each, and tweaked around till the desirable pitch
and bounce frequencies, and ride ratio were obtained. The pitching and bouncing frequencies of
our vehicle were calculated from the equations below. Once the P&B frequencies were found,
the ride ratio was calculated to be 1.2.
(20)
(21)
After calculating these values, the roll gradient was found using the inverse of the following
equation:
Where , , and represent the front wheel displacement, rear wheel displacement, andXf Xr Xb
chassis wheel displacement, respectively.
The T180RX is between a compact and sports vehicle and therefore the center of gravity
(CG) height was chosen to be close to 23 inches. From this, the roll gradient was found to be
0.29 deg/g and falls within high downforce vehicles.
Double wishbone suspension was chosen for the front and rear of the vehicle as it
provides ideal camber control for better handling; and for a sports car, it is ideal to have the
motion of the wheels independent from each other. The vehicle suspension geometries are
illustrated below.
26
Figure 17. Double wishbone suspension for front and rear wheels.
​Table 13: Summary of all relevant parameters for T180RX
Vehicle Parameter Value
Front Spring Rate, ​S​f 100 lb/in
Rear Spring Rate, ​S​r 110 lb/in
Body Spring Rate, ​S​b 50 lb/in
Tire Spring Rate, ​S​t 1000 lb
⍵nr 1.244 Hz
⍵nf 1.035 Hz
Ride Ratio, /⍵nr ⍵nf 1.202
CG to front axle distance, Lf 3.74 ft
CG to rear axle distance, Lr 4.95 ft
Roll Gradient, ​G​ro 0.29
Rolling Arm, ​d 9.8 in
Roll Center, ​R​o 13.1 in
CG height 22.9 in
Front Wheel Roll Center,​ R​of 3.0 in
Rear Wheel Roll Center, ​R​or 17.8 in
27
Figure 18. Vehicle suspension geometries.
6 Packaging Design
The ergonomics of the T180RX were designed considering the vehicle would be a
production compact hatchback. It should therefore be suitable for a large percentage of the
population and be comfortable. The driving seating configuration was designed as follows using
SAE median values.
Figure 19. Vehicle seating configuration
Table 14. Driving Rig Values
Ergonomic
Variable
L11
[in]
L40
[deg.]
L53
[in]
H30
[in]
H17
[in]
Value 18 15 24 12 27
28
The driving rig values were determined for a comfortable feel for all drivers ranging from
young to old and male or female. The T180RX is suitable for five person occupation including
the operator of the vehicle as shown in Figure 20. The material and fabric of the interior would
vary depending on the package that the consumer selects. Vehicle sightlines were determined in
Figures 21 - 23. Blind spots were slightly smaller since the T180RX is a compact car.
Figure 20. 3-View package drawing
Figure 21. Vehicle sightlines for left side of the driver window.
29
Figure 22. Vehicle sightlines for left side of the driver window. Top view
Figure 23. Vehicle sightlines for front and rear windows
7 Weight and Cost
7.1 Weight Schedule
Researching other vehicles of the same size and functionality, estimates of each part were
made. Categorizing them into body/ chassis, propulsion and braking, electrical, heating and
ventilation, the weights of each all total to the curb weight of the T180RX. On the far right
column of Table 15, percentages of each component show how much it contributes to the overall
weight.
30
Table 15. Weight distribution of body/chassis
Body/Chassis LB %
Body, paint and glass 1089.648 32.2
Bumpers 186.12 5.5
Grille and Lamps 16.92 0.5
Exterior Ornamentation 3.384 0.1
Instrument Panel & Steering Wheel 37.224 1.1
Interior Trim 209.808 6.2
A. Rear Seats & Seat Belts 37.224 1.1
B. Rear Floor & Tunnel Insulation 10.152 0.3
Suspension & Shock Absorbers 175.968 5.2
Steering System 77.832 2.3
Wheels (5) 101.52 3.0
Tires & Valves (5) 118.44 3.5
Radiator 13.536 0.4
Exhaust System 54.144 1.6
Fuel Tank, Lines & System 33.84 1.0
Engine Support 20.304 0.6
Throttle, Shift, Clutch Control 10.152 0.3
Standard Tools 10.152 0.3
Gasoline, Full Capacity 108.288 3.2
Subtotals 2314.656 68.4
Table 16. Weight distribution of propulsion and braking
Propulsion & Braking LB %
Engine and Accessories 517.752 15.3
Transmission 98.136 2.9
Drive Shaft 16.92 0.5
Drive Axle 138.744 4.1
Brake System 159.048 4.7
Engine Coolant and Oil 33.84 1.0
Transmission & Axle Lubricant 6.768 0.2
Subtotals 971.208 28.7
31
Table 17. Weight Distribution of Electrical, Heating, and Ventilation
Electrical, Heating & Ventilation LB %
Electric Circuits 30.456 0.9
Heater System 23.688 0.7
Battery 43.992 1.3
Subtotals 98.136 2.9
Curb Weight 3384 100.00
From the weight schedule, it is evident that the body, paint, and glass contribute the most
weight at 32%, compared to the other components listed. At 15.3%, the engine along with its
accessories carry the second largest weight at roughly 518 lbs. From these estimates, we have
attempted to maximize the weight efficiency of the T180RX by allocating the majority of the
weight to these specified components.
7.2 Cost Estimate
Figure 24 . Cost breakdown of T180RX.
Cost is initially estimated in the embodiment and design stage of the vehicle. As
specifications and features are finalized throughout the design phase, estimation of cost becomes
more solidified. Majority of the cost comes from manufacturing and it can vary depending on
costs of different components and the whether it utilizes traditional manufacturing techniques.
Majority of the engineering that was done in the previous sections only took 6.5% of the
manufacturer’s suggested retail price.
32
Table 18 . Percentage breakdown of MSRP.
Type of Cost Percentage (%)
Manufacturing Costs 50
Warranty 5
R&D/Engineering 6.5
Depreciation &
Amortization
5.5
Corporate Overhead 7
Selling 23.5
Proft 2.5
Total MSRP 100
8 Comparison with Competitors
Figure 25. 2017 Volkswagen Golf GTI
One vehicle in the current market that is similar to T180RX is the 2017 Volkswagen Golf GTI.
The dimensions and vehicle performance specifications are compared in Table 19.
Table 19. Comparison of T180RX and 2017 Volkswagen Golf GTI.
2017 Volkswagen Golf GTI T180RX
Height 4.73 ft. 4.83 ft.
Width 5.88 ft. 5.83 ft.
Length 14 ft. 14.2 ft.
Weight 2972 lbs. 3384 lbs.
Engine Hp 210 @ 4500 RPM 118 HP @ 6000 RPM
MPG 28 22
0-60 mph time 5.9 sec 6.9 sec
33
Both cars are sport compact cars but the T180RX is a two door. The engine rating for the
Golf GTI has extra horsepower that help it reaches 60 mph faster at full throttle. However, the
T180RX 0-60 mph time is relatively good considering its horsepower is approximately half of
the Golf GTI. One disadvantage of the T180RX is that it is almost 400 lbs. heavier compared to
the Golf GTI contributing to the lower MPG of the T180RX. The use of the motor can reduce
emission in heavy traffic as opposed to the Golf GTI which is all engine powered. They both fall
under similar price range with the T180RX being slightly cheaper.
9 Conclusions
The T180RX is an efficient sports compact car. It powertrain is a dual hybrid drive which
is ideal for a busy city like Los Angeles, allowing it to use its electric motor in slower speeds and
its engine on open roads. The engine has a rating of 118 HP at 6000 RPM and the motor has a
rating of 53kW. The maximum speed power 187 hp. The battery to power the motor is
lithium-ion battery with a density of 109 Wh/kg. The 0 – 60 mph acceleration time for the
T180RX is 6.9 seconds. Cost of the T180RX is $23,250.
It was learned from designing the T180RX, that hybrid cars take much more planning to
take make an efficient in comparison to traditional cars. The original goals were for the car to be
extremely powerful but due to limitations of using a motor and being fuel efficient, expectations
had to be tempered. Researching for specific parts for a vehicle require a lot of time since they
are not readily available like other commercial items. By being smart with driving style the car
efficiency can dramatically increase the miles per gallon of the car.
The T180RX is relatively efficient for its size and speed capability but there are many
opportunities for it to be environmentally friendly with some fine tuning. It’s an impressive car
but would fall on the expensive side due to the not ideal MPG. Marketing and advertisement are
the next steps in the post production phase.
10 Recommendations
For future development of the T180RX, a higher split of the motor should be
recommended and put less reliance on the engine in order to increase fuel efficiency. This will
come with an expense to power of the vehicle but reducing emissions is the ultimate goal of it
being a hybrid vehicle. Reducing the cycles of the extreme energy consuming driving modes will
help reduce emission and get more out of the vehicle. For example, instead of having 15 cruise
cycles and increase the lower cruising cycles. Another major goal, would be to reduce to the
overall weight of the vehicle which would optimize the maximum speed and 0-60 mph time.
34
11 References
1. Branch, Geographic Products. "2010 Census Gazetteer Files Record Layouts." ​2010 Census
Gazetteer Files - Geography - U.S. Census Bureau​. N.p., 01 Sept. 2012. Web. 2 Mar. 2017.
2. Service, City News. "Los Angeles Area Has the Nation’s Worst Traffic, Study Says." ​LA
Daily News​. LA Daily News, 15 Mar. 2016. Web. 1 Mar. 2017.
3. Allen, Karma. "Los Angeles the World's Most Traffic-clogged City, Study Says." ​ABC
News​. ABC News Network, n.d. Web. 4 Mar. 2017.
4. "Los Angeles and Bakersfield Top List of Worst Air Pollution in the Nation." ​Los Angeles
Times​. Los Angeles Times, n.d. Web. 2 Mar. 2017.
5. Lazarus, David. "Fixes Needed for L.A. Public Transit System." ​Los Angeles Times​. Los
Angeles Times, 13 May 2010. Web. 1 Mar. 2017.
6. "Bradenton, Florida." ​Wikipedia​. Wikimedia Foundation, 10 Mar. 2017. Web. 3 Mar. 2017.
7. "How Do Battery Electric Cars Work?" Union of Concerned Scientists. N.p., n.d. Web. 5
Mar. 2017.
8. "Fuel Cell Vehicles." Fuel Economy. N.p., n.d. Web. 8 Mar. 2017.
9. "Need to Know." Is It Easy to Charge an Electric Car? N.p., n.d. Web. 9 Mar. 2017.
35
12 Appendix
Appendix A: Vehicle Specification Sheet
36
37
38
Ergonomics
Driver size adjustments L11-18in, L40-15 deg, L53-24 in, H30-12 in,
H17- 27 in
Seat Synthetic leather and sport padding
Driver Visibility F: 30 in, Driver Side: 40in, Pass-side: 80 in,
R: 120 in
39
Appendix B: The White Method
40
Appendix C: Power Required Calculation
41
Appendix D: Power Curve
42
Appendix E: Acceleration Curve
43
Appendix F: Steering Angle
44
Appendix G: Gain Curves
45
Appendix H. Suspension Design
46

More Related Content

What's hot

Cleaner cars from cradle to grave full report
Cleaner cars from cradle to grave full reportCleaner cars from cradle to grave full report
Cleaner cars from cradle to grave full reportFrédéric Lambert
 
ETCleanFuels+UFMA_Work-Truck-Options_4-27-15
ETCleanFuels+UFMA_Work-Truck-Options_4-27-15ETCleanFuels+UFMA_Work-Truck-Options_4-27-15
ETCleanFuels+UFMA_Work-Truck-Options_4-27-15ETCleanFuels
 
Influence of Vehicle Inspection Tests on Crashworthiness of School Bus in Nai...
Influence of Vehicle Inspection Tests on Crashworthiness of School Bus in Nai...Influence of Vehicle Inspection Tests on Crashworthiness of School Bus in Nai...
Influence of Vehicle Inspection Tests on Crashworthiness of School Bus in Nai...Dr. Amarjeet Singh
 
Delberating Diesel Mazda Jim Kliesch
Delberating Diesel Mazda Jim KlieschDelberating Diesel Mazda Jim Kliesch
Delberating Diesel Mazda Jim KlieschCardinaleWay Mazda
 
Sustainable energy and transportation
Sustainable energy and transportationSustainable energy and transportation
Sustainable energy and transportationPablo Martin
 
Green transportation
Green transportationGreen transportation
Green transportationBrayden Smith
 
Green transportation and climate change
Green transportation and climate changeGreen transportation and climate change
Green transportation and climate changeecokao
 
Transportation and the Earth
Transportation and the EarthTransportation and the Earth
Transportation and the Earthaleemarie1106
 
Power Point For Comp
Power Point For CompPower Point For Comp
Power Point For Compxorachieeee
 
Power Point For Comp
Power Point For CompPower Point For Comp
Power Point For Compaleemarie1106
 
Application to International High School
Application to International High SchoolApplication to International High School
Application to International High Schoolchrisd
 
Efficiency gains through transport transitions perspectives of international ...
Efficiency gains through transport transitions perspectives of international ...Efficiency gains through transport transitions perspectives of international ...
Efficiency gains through transport transitions perspectives of international ...Energy Cultures 2 Janet Stephenson
 
T10 x transportation
T10 x transportationT10 x transportation
T10 x transportationAzilan Aria
 
Joule, a spearhead for the south African Electric Vehicle and Battery industr...
Joule, a spearhead for the south African Electric Vehicle and Battery industr...Joule, a spearhead for the south African Electric Vehicle and Battery industr...
Joule, a spearhead for the south African Electric Vehicle and Battery industr...RAMP Group
 
The Future of Mobility: Is Personal Car Ownership a Thing of the Past?
The Future of Mobility: Is Personal Car Ownership a Thing of the Past?The Future of Mobility: Is Personal Car Ownership a Thing of the Past?
The Future of Mobility: Is Personal Car Ownership a Thing of the Past?Social Media Today
 
Green Transport Presentation
Green Transport PresentationGreen Transport Presentation
Green Transport PresentationPhil Tate
 

What's hot (19)

Presented to the Electrification Coalition on April 8, 2010
Presented to the Electrification Coalition on April 8, 2010Presented to the Electrification Coalition on April 8, 2010
Presented to the Electrification Coalition on April 8, 2010
 
Cleaner cars from cradle to grave full report
Cleaner cars from cradle to grave full reportCleaner cars from cradle to grave full report
Cleaner cars from cradle to grave full report
 
ETCleanFuels+UFMA_Work-Truck-Options_4-27-15
ETCleanFuels+UFMA_Work-Truck-Options_4-27-15ETCleanFuels+UFMA_Work-Truck-Options_4-27-15
ETCleanFuels+UFMA_Work-Truck-Options_4-27-15
 
QuikJak
QuikJakQuikJak
QuikJak
 
Influence of Vehicle Inspection Tests on Crashworthiness of School Bus in Nai...
Influence of Vehicle Inspection Tests on Crashworthiness of School Bus in Nai...Influence of Vehicle Inspection Tests on Crashworthiness of School Bus in Nai...
Influence of Vehicle Inspection Tests on Crashworthiness of School Bus in Nai...
 
Delberating Diesel Mazda Jim Kliesch
Delberating Diesel Mazda Jim KlieschDelberating Diesel Mazda Jim Kliesch
Delberating Diesel Mazda Jim Kliesch
 
Sustainable energy and transportation
Sustainable energy and transportationSustainable energy and transportation
Sustainable energy and transportation
 
Green transportation
Green transportationGreen transportation
Green transportation
 
Green transportation and climate change
Green transportation and climate changeGreen transportation and climate change
Green transportation and climate change
 
Transportation and the Earth
Transportation and the EarthTransportation and the Earth
Transportation and the Earth
 
Power Point For Comp
Power Point For CompPower Point For Comp
Power Point For Comp
 
Power Point For Comp
Power Point For CompPower Point For Comp
Power Point For Comp
 
Application to International High School
Application to International High SchoolApplication to International High School
Application to International High School
 
Green Transport
Green TransportGreen Transport
Green Transport
 
Efficiency gains through transport transitions perspectives of international ...
Efficiency gains through transport transitions perspectives of international ...Efficiency gains through transport transitions perspectives of international ...
Efficiency gains through transport transitions perspectives of international ...
 
T10 x transportation
T10 x transportationT10 x transportation
T10 x transportation
 
Joule, a spearhead for the south African Electric Vehicle and Battery industr...
Joule, a spearhead for the south African Electric Vehicle and Battery industr...Joule, a spearhead for the south African Electric Vehicle and Battery industr...
Joule, a spearhead for the south African Electric Vehicle and Battery industr...
 
The Future of Mobility: Is Personal Car Ownership a Thing of the Past?
The Future of Mobility: Is Personal Car Ownership a Thing of the Past?The Future of Mobility: Is Personal Car Ownership a Thing of the Past?
The Future of Mobility: Is Personal Car Ownership a Thing of the Past?
 
Green Transport Presentation
Green Transport PresentationGreen Transport Presentation
Green Transport Presentation
 

Similar to Senior design final report

scope of reenewable energy in automobile industry
scope of reenewable energy in automobile industryscope of reenewable energy in automobile industry
scope of reenewable energy in automobile industrykevIN kovaDIA
 
Transportation, Electric Vehicles and the Environment
Transportation, Electric Vehicles and the EnvironmentTransportation, Electric Vehicles and the Environment
Transportation, Electric Vehicles and the EnvironmentHector Rodriguez
 
Science and Policy
Science and PolicyScience and Policy
Science and Policyestrahle
 
Reducing the impact of transportation on air pollution in China through freig...
Reducing the impact of transportation on air pollution in China through freig...Reducing the impact of transportation on air pollution in China through freig...
Reducing the impact of transportation on air pollution in China through freig...WRI Ross Center for Sustainable Cities
 
Current status of the electric car
Current status of the electric carCurrent status of the electric car
Current status of the electric carvladtempest5
 
High Speed Rail
High Speed RailHigh Speed Rail
High Speed Railsmehro
 
LTC, Jack R. Widmeyer Transportation Research Conference, Going to San Bernar...
LTC, Jack R. Widmeyer Transportation Research Conference, Going to San Bernar...LTC, Jack R. Widmeyer Transportation Research Conference, Going to San Bernar...
LTC, Jack R. Widmeyer Transportation Research Conference, Going to San Bernar...LTC @ CSUSB
 
Carpool Effects on Air Quality in Los Angeles
Carpool Effects on Air Quality in Los AngelesCarpool Effects on Air Quality in Los Angeles
Carpool Effects on Air Quality in Los AngelesJikun Lian EIT
 
plug in hybrid vehicles in electric vehicles
plug in hybrid vehicles in electric vehiclesplug in hybrid vehicles in electric vehicles
plug in hybrid vehicles in electric vehiclesshivrampatilscoemech
 
Pollution Assignment July 2000
Pollution Assignment July 2000Pollution Assignment July 2000
Pollution Assignment July 2000russell bolton
 
CALSTART Van Amburg Mobility 2030 8 18 09 Final
CALSTART Van Amburg Mobility 2030 8 18 09 FinalCALSTART Van Amburg Mobility 2030 8 18 09 Final
CALSTART Van Amburg Mobility 2030 8 18 09 FinalCALSTART
 
Transport Issues in Adelaide | Biocity Studio
Transport Issues in Adelaide | Biocity StudioTransport Issues in Adelaide | Biocity Studio
Transport Issues in Adelaide | Biocity StudioBiocity Studio
 
STEP Summer Seminar 2017 - Jillian Anable, University of Leeds - Influencing ...
STEP Summer Seminar 2017 - Jillian Anable, University of Leeds - Influencing ...STEP Summer Seminar 2017 - Jillian Anable, University of Leeds - Influencing ...
STEP Summer Seminar 2017 - Jillian Anable, University of Leeds - Influencing ...STEP_scotland
 
Final_Design_Document
Final_Design_DocumentFinal_Design_Document
Final_Design_DocumentJace Miller
 
Automobile Emissions Final Project Infographics CIS 3700
Automobile Emissions Final Project Infographics CIS 3700Automobile Emissions Final Project Infographics CIS 3700
Automobile Emissions Final Project Infographics CIS 3700AndrewChu46
 
Electric scooter report
Electric scooter reportElectric scooter report
Electric scooter reportAdinath Londhe
 

Similar to Senior design final report (20)

scope of reenewable energy in automobile industry
scope of reenewable energy in automobile industryscope of reenewable energy in automobile industry
scope of reenewable energy in automobile industry
 
PES1.ppt
PES1.pptPES1.ppt
PES1.ppt
 
Transportation, Electric Vehicles and the Environment
Transportation, Electric Vehicles and the EnvironmentTransportation, Electric Vehicles and the Environment
Transportation, Electric Vehicles and the Environment
 
Science and Policy
Science and PolicyScience and Policy
Science and Policy
 
Reducing the impact of transportation on air pollution in China through freig...
Reducing the impact of transportation on air pollution in China through freig...Reducing the impact of transportation on air pollution in China through freig...
Reducing the impact of transportation on air pollution in China through freig...
 
Current status of the electric car
Current status of the electric carCurrent status of the electric car
Current status of the electric car
 
High Speed Rail
High Speed RailHigh Speed Rail
High Speed Rail
 
LTC, Jack R. Widmeyer Transportation Research Conference, Going to San Bernar...
LTC, Jack R. Widmeyer Transportation Research Conference, Going to San Bernar...LTC, Jack R. Widmeyer Transportation Research Conference, Going to San Bernar...
LTC, Jack R. Widmeyer Transportation Research Conference, Going to San Bernar...
 
newFinalReport.docx
newFinalReport.docxnewFinalReport.docx
newFinalReport.docx
 
Carpool Effects on Air Quality in Los Angeles
Carpool Effects on Air Quality in Los AngelesCarpool Effects on Air Quality in Los Angeles
Carpool Effects on Air Quality in Los Angeles
 
plug in hybrid vehicles in electric vehicles
plug in hybrid vehicles in electric vehiclesplug in hybrid vehicles in electric vehicles
plug in hybrid vehicles in electric vehicles
 
Pollution Assignment July 2000
Pollution Assignment July 2000Pollution Assignment July 2000
Pollution Assignment July 2000
 
CALSTART Van Amburg Mobility 2030 8 18 09 Final
CALSTART Van Amburg Mobility 2030 8 18 09 FinalCALSTART Van Amburg Mobility 2030 8 18 09 Final
CALSTART Van Amburg Mobility 2030 8 18 09 Final
 
NZC - Prochazka
NZC - ProchazkaNZC - Prochazka
NZC - Prochazka
 
Air Pollution In Texas
Air Pollution In TexasAir Pollution In Texas
Air Pollution In Texas
 
Transport Issues in Adelaide | Biocity Studio
Transport Issues in Adelaide | Biocity StudioTransport Issues in Adelaide | Biocity Studio
Transport Issues in Adelaide | Biocity Studio
 
STEP Summer Seminar 2017 - Jillian Anable, University of Leeds - Influencing ...
STEP Summer Seminar 2017 - Jillian Anable, University of Leeds - Influencing ...STEP Summer Seminar 2017 - Jillian Anable, University of Leeds - Influencing ...
STEP Summer Seminar 2017 - Jillian Anable, University of Leeds - Influencing ...
 
Final_Design_Document
Final_Design_DocumentFinal_Design_Document
Final_Design_Document
 
Automobile Emissions Final Project Infographics CIS 3700
Automobile Emissions Final Project Infographics CIS 3700Automobile Emissions Final Project Infographics CIS 3700
Automobile Emissions Final Project Infographics CIS 3700
 
Electric scooter report
Electric scooter reportElectric scooter report
Electric scooter report
 

Recently uploaded

GDSC ASEB Gen AI study jams presentation
GDSC ASEB Gen AI study jams presentationGDSC ASEB Gen AI study jams presentation
GDSC ASEB Gen AI study jams presentationGDSCAESB
 
Study on Air-Water & Water-Water Heat Exchange in a Finned Tube Exchanger
Study on Air-Water & Water-Water Heat Exchange in a Finned Tube ExchangerStudy on Air-Water & Water-Water Heat Exchange in a Finned Tube Exchanger
Study on Air-Water & Water-Water Heat Exchange in a Finned Tube ExchangerAnamika Sarkar
 
OSVC_Meta-Data based Simulation Automation to overcome Verification Challenge...
OSVC_Meta-Data based Simulation Automation to overcome Verification Challenge...OSVC_Meta-Data based Simulation Automation to overcome Verification Challenge...
OSVC_Meta-Data based Simulation Automation to overcome Verification Challenge...Soham Mondal
 
HARMONY IN THE NATURE AND EXISTENCE - Unit-IV
HARMONY IN THE NATURE AND EXISTENCE - Unit-IVHARMONY IN THE NATURE AND EXISTENCE - Unit-IV
HARMONY IN THE NATURE AND EXISTENCE - Unit-IVRajaP95
 
IVE Industry Focused Event - Defence Sector 2024
IVE Industry Focused Event - Defence Sector 2024IVE Industry Focused Event - Defence Sector 2024
IVE Industry Focused Event - Defence Sector 2024Mark Billinghurst
 
Decoding Kotlin - Your guide to solving the mysterious in Kotlin.pptx
Decoding Kotlin - Your guide to solving the mysterious in Kotlin.pptxDecoding Kotlin - Your guide to solving the mysterious in Kotlin.pptx
Decoding Kotlin - Your guide to solving the mysterious in Kotlin.pptxJoão Esperancinha
 
complete construction, environmental and economics information of biomass com...
complete construction, environmental and economics information of biomass com...complete construction, environmental and economics information of biomass com...
complete construction, environmental and economics information of biomass com...asadnawaz62
 
Application of Residue Theorem to evaluate real integrations.pptx
Application of Residue Theorem to evaluate real integrations.pptxApplication of Residue Theorem to evaluate real integrations.pptx
Application of Residue Theorem to evaluate real integrations.pptx959SahilShah
 
Introduction-To-Agricultural-Surveillance-Rover.pptx
Introduction-To-Agricultural-Surveillance-Rover.pptxIntroduction-To-Agricultural-Surveillance-Rover.pptx
Introduction-To-Agricultural-Surveillance-Rover.pptxk795866
 
CCS355 Neural Network & Deep Learning Unit II Notes with Question bank .pdf
CCS355 Neural Network & Deep Learning Unit II Notes with Question bank .pdfCCS355 Neural Network & Deep Learning Unit II Notes with Question bank .pdf
CCS355 Neural Network & Deep Learning Unit II Notes with Question bank .pdfAsst.prof M.Gokilavani
 
What are the advantages and disadvantages of membrane structures.pptx
What are the advantages and disadvantages of membrane structures.pptxWhat are the advantages and disadvantages of membrane structures.pptx
What are the advantages and disadvantages of membrane structures.pptxwendy cai
 
Microscopic Analysis of Ceramic Materials.pptx
Microscopic Analysis of Ceramic Materials.pptxMicroscopic Analysis of Ceramic Materials.pptx
Microscopic Analysis of Ceramic Materials.pptxpurnimasatapathy1234
 
SPICE PARK APR2024 ( 6,793 SPICE Models )
SPICE PARK APR2024 ( 6,793 SPICE Models )SPICE PARK APR2024 ( 6,793 SPICE Models )
SPICE PARK APR2024 ( 6,793 SPICE Models )Tsuyoshi Horigome
 
Introduction to Microprocesso programming and interfacing.pptx
Introduction to Microprocesso programming and interfacing.pptxIntroduction to Microprocesso programming and interfacing.pptx
Introduction to Microprocesso programming and interfacing.pptxvipinkmenon1
 

Recently uploaded (20)

GDSC ASEB Gen AI study jams presentation
GDSC ASEB Gen AI study jams presentationGDSC ASEB Gen AI study jams presentation
GDSC ASEB Gen AI study jams presentation
 
Study on Air-Water & Water-Water Heat Exchange in a Finned Tube Exchanger
Study on Air-Water & Water-Water Heat Exchange in a Finned Tube ExchangerStudy on Air-Water & Water-Water Heat Exchange in a Finned Tube Exchanger
Study on Air-Water & Water-Water Heat Exchange in a Finned Tube Exchanger
 
OSVC_Meta-Data based Simulation Automation to overcome Verification Challenge...
OSVC_Meta-Data based Simulation Automation to overcome Verification Challenge...OSVC_Meta-Data based Simulation Automation to overcome Verification Challenge...
OSVC_Meta-Data based Simulation Automation to overcome Verification Challenge...
 
HARMONY IN THE NATURE AND EXISTENCE - Unit-IV
HARMONY IN THE NATURE AND EXISTENCE - Unit-IVHARMONY IN THE NATURE AND EXISTENCE - Unit-IV
HARMONY IN THE NATURE AND EXISTENCE - Unit-IV
 
young call girls in Green Park🔝 9953056974 🔝 escort Service
young call girls in Green Park🔝 9953056974 🔝 escort Serviceyoung call girls in Green Park🔝 9953056974 🔝 escort Service
young call girls in Green Park🔝 9953056974 🔝 escort Service
 
IVE Industry Focused Event - Defence Sector 2024
IVE Industry Focused Event - Defence Sector 2024IVE Industry Focused Event - Defence Sector 2024
IVE Industry Focused Event - Defence Sector 2024
 
★ CALL US 9953330565 ( HOT Young Call Girls In Badarpur delhi NCR
★ CALL US 9953330565 ( HOT Young Call Girls In Badarpur delhi NCR★ CALL US 9953330565 ( HOT Young Call Girls In Badarpur delhi NCR
★ CALL US 9953330565 ( HOT Young Call Girls In Badarpur delhi NCR
 
young call girls in Rajiv Chowk🔝 9953056974 🔝 Delhi escort Service
young call girls in Rajiv Chowk🔝 9953056974 🔝 Delhi escort Serviceyoung call girls in Rajiv Chowk🔝 9953056974 🔝 Delhi escort Service
young call girls in Rajiv Chowk🔝 9953056974 🔝 Delhi escort Service
 
Decoding Kotlin - Your guide to solving the mysterious in Kotlin.pptx
Decoding Kotlin - Your guide to solving the mysterious in Kotlin.pptxDecoding Kotlin - Your guide to solving the mysterious in Kotlin.pptx
Decoding Kotlin - Your guide to solving the mysterious in Kotlin.pptx
 
complete construction, environmental and economics information of biomass com...
complete construction, environmental and economics information of biomass com...complete construction, environmental and economics information of biomass com...
complete construction, environmental and economics information of biomass com...
 
Application of Residue Theorem to evaluate real integrations.pptx
Application of Residue Theorem to evaluate real integrations.pptxApplication of Residue Theorem to evaluate real integrations.pptx
Application of Residue Theorem to evaluate real integrations.pptx
 
🔝9953056974🔝!!-YOUNG call girls in Rajendra Nagar Escort rvice Shot 2000 nigh...
🔝9953056974🔝!!-YOUNG call girls in Rajendra Nagar Escort rvice Shot 2000 nigh...🔝9953056974🔝!!-YOUNG call girls in Rajendra Nagar Escort rvice Shot 2000 nigh...
🔝9953056974🔝!!-YOUNG call girls in Rajendra Nagar Escort rvice Shot 2000 nigh...
 
Introduction-To-Agricultural-Surveillance-Rover.pptx
Introduction-To-Agricultural-Surveillance-Rover.pptxIntroduction-To-Agricultural-Surveillance-Rover.pptx
Introduction-To-Agricultural-Surveillance-Rover.pptx
 
CCS355 Neural Network & Deep Learning Unit II Notes with Question bank .pdf
CCS355 Neural Network & Deep Learning Unit II Notes with Question bank .pdfCCS355 Neural Network & Deep Learning Unit II Notes with Question bank .pdf
CCS355 Neural Network & Deep Learning Unit II Notes with Question bank .pdf
 
What are the advantages and disadvantages of membrane structures.pptx
What are the advantages and disadvantages of membrane structures.pptxWhat are the advantages and disadvantages of membrane structures.pptx
What are the advantages and disadvantages of membrane structures.pptx
 
Microscopic Analysis of Ceramic Materials.pptx
Microscopic Analysis of Ceramic Materials.pptxMicroscopic Analysis of Ceramic Materials.pptx
Microscopic Analysis of Ceramic Materials.pptx
 
SPICE PARK APR2024 ( 6,793 SPICE Models )
SPICE PARK APR2024 ( 6,793 SPICE Models )SPICE PARK APR2024 ( 6,793 SPICE Models )
SPICE PARK APR2024 ( 6,793 SPICE Models )
 
Call Us -/9953056974- Call Girls In Vikaspuri-/- Delhi NCR
Call Us -/9953056974- Call Girls In Vikaspuri-/- Delhi NCRCall Us -/9953056974- Call Girls In Vikaspuri-/- Delhi NCR
Call Us -/9953056974- Call Girls In Vikaspuri-/- Delhi NCR
 
Introduction to Microprocesso programming and interfacing.pptx
Introduction to Microprocesso programming and interfacing.pptxIntroduction to Microprocesso programming and interfacing.pptx
Introduction to Microprocesso programming and interfacing.pptx
 
9953056974 Call Girls In South Ex, Escorts (Delhi) NCR.pdf
9953056974 Call Girls In South Ex, Escorts (Delhi) NCR.pdf9953056974 Call Girls In South Ex, Escorts (Delhi) NCR.pdf
9953056974 Call Girls In South Ex, Escorts (Delhi) NCR.pdf
 

Senior design final report

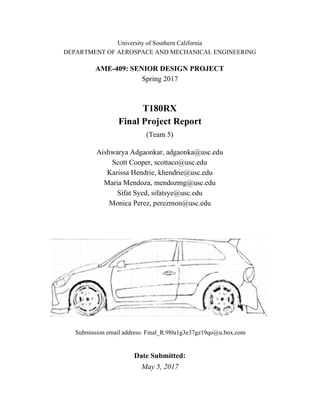
  • 1. University of Southern California DEPARTMENT OF AEROSPACE AND MECHANICAL ENGINEERING AME-409: SENIOR DESIGN PROJECT Spring 2017 T180RX Final Project Report (Team 5) Aishwarya Adgaonkar, adgaonka@usc.edu Scott Cooper, scottaco@usc.edu Karissa Hendrie, khendrie@usc.edu Maria Mendoza, mendozmg@usc.edu Sifat Syed, sifatsye@usc.edu Monica Perez, perezmon@usc.edu Submission email address: Final_R.9l0a1g3e37gz19qo@u.box.com Date Submitted: May 5, 2017
  • 2. Table of Contents 1 Introduction 4 1.1 Traffic Congestion 4 1.2 Air Quality 5 1.3 Public Transportation 5 1.4 Electric Vehicles 6 1.5 Fuel Cell Vehicle 6 1.6 Hybrid Electric Vehicles 7 1.7 Preferred Advanced Technology 7 1.8 General Requirements 7 2 Style Design 8 2.1 Design Target 8 2.2 Performance Objectives 9 2.3 Technology Objectives 9 2.4 Cost Objectives 10 3 Performance 10 3.1 Power Requirement 10 3.1.1 Power Required to Overcome Drag and Rolling Resistance 11 3.1.2 Maximum Power Required 12 3.2 Powertrain Design 12 3.2.1 Engine and Motor Power Split 14 3.2.2 Engine and Motor Specifications 15 3.3 Drivetrain Design 16 3.4 Power Curve and Acceleration Performance 17 3.4.1 Acceleration Calculation 18 4 Energy System 19 4.1 Mission Scenario Analysis 20 4.2 Battery Requirements 22 4.3 Energy Schematic 22 5 Steering and Suspension Dynamics 23 5.1 Steering Design 23 5.2 Suspension Design 26 6 Packaging Design 28 1
  • 3. 7 Weight and Cost 30 7.1 Weight Schedule 30 7.2 Cost Estimate 32 8 Comparison with Competitors 33 9 Conclusions 34 10 Recommendations 34 11 References 35 12 Appendix 36 Appendix A: Vehicle Specification Sheet 36 Appendix B: The White Method 40 Appendix C: Power Required Calculation 41 Appendix D: Power Curve 42 Appendix E: Acceleration Curve 43 Appendix F: Steering Angle 44 Appendix G: Gain Curves 45 Appendix H. Suspension Design 46 2
  • 4. Abstract As of the past decade, concerns for pollution and air quality, especially in Los Angeles, have rapidly risen. A large contribution to this problem is the growing population in the Southern California city. Along with this comes the difficulty of transportation in the bustling suburb, as it is considered necessary to own a car in order to get from point A to point B. As a result, the use of cars is one of the highest in the world, contributing widely to harmful emissions being emitted from these vehicles that are being used everyday by most Angelenos. However, the T180RX has been designed to help eliminate this growing problem that is greatly contributing to the world’s climate change. This vehicle seeks to provide outstanding performance while maintaining competitive fuel efficiency and overall usefulness as a daily-drivable vehicle. The T180RX would pioneer the market of performance oriented hybrid hatchbacks. There are currently none on the market that have similar specifications. The T180RX produces 438 HP with the combined electric motor and 2.4 liter turbocharged 4-cylinder engine, accelerating from 0-60mph in 2.19 seconds. Yet it is also able to cruise with zero emissions for half an hour during a regular driving period and achieve a combined fuel rating of 26.5 MPG using hybrid technologies such as regenerative braking. 3
  • 5. 1 Introduction Los Angeles is best known for being the cultural, financial, and commercial center of California. It is the second most densely-populated city in the United States and the most populated in California with thirteen million inhabitants covering an area of about 1210 km​2​ . [1] Driven by international trade, technology and petroleum industries, manufacturing centers, and tourism, Los Angeles has become one of the busiest and most economically independent cities in the Western Hemisphere. This attractive city for foreigners and locals offers an extensive network of freeways, transit systems, airports, and seaports allowing easy access to different regions and aid with daily activities; however, due to its dense population, Los Angeles these resources are not been enough and has progressively became an issue due to increases in traffic congestion, air pollution, and greenhouse gas emissions. 1.1 Traffic Congestion Traffic in Los Angeles has been an ongoing challenge for traffic engineers and a repeatable topic in national and global news. In 2015, Los Angeles was ranked U.S. most congested region and the second heaviest traffic globally with every driver spending an estimated average of 81 hours per year in traffic following London. [2] This average has since grown as reported by ​ABC NEWS​ in 2017 to 104 hours per driver every year making Los Angeles the city with the worst commuter traffic. Even though traffic is associated with a stable economy and continues urbanization of cities, it can also lead to an increase in driver’s cost due to its counterproductive nature, fuel expenditure, and other health related issues. It is estimated that traffic costs the average driver $2,408 a year. [3] Heavy traffic is due to the high automobile ownership and LA’s overpopulation. Even though there are efforts for reduce the number of cars driving at peak hours through carpool services and lanes, every year the number of drivers and cars continue to increase resulting in increased pollution. Figure 1. Vehicles in rush hour in the I-405 freeway in Westwood, CA neighborhood. Source: Forbes Magazine 4
  • 6. 1.2 Air Quality Thousands of Californians are currently living in and breathing polluted air everyday. In April 2016, ​Los Angeles Times​ reported Bakersfield having the highest airborne particles spewed by highway traffic, trucks with diesel engines, and equipment for farms and fireplaces. Although not entirely due to traffic, a significant contributor of harmful ozone pollution is vehicle emissions. Air pollution has been known for threatening human health by triggering asthma, heart attacks, lung cancer, and other premature death-related diseases. Environmental issues also arise from air pollution. Climate change, rising temperature and El Niño are due to climate change and are a direct consequence of the heated hydrocarbons and nitrogen oxide emitted in vehicle smog. Fortunately, industries have invested billions of dollars on air cleaning techniques that have reduced pollutants by 80% since 1980’s. [4] Car manufacturers have also opted for newer technologies with zero or partial emission and improve efficiency. 1.3 Public Transportation Currently, Los Angeles County Metropolitan Transportation Authority offers a system of bus, subway, and light rail lines around the city. A 2005 study shows that 10.2% of Los Angeles commuters use public transportation making the subway and bus system the 9​th​ and 2​nd​ busiest in the country, respectively. [6] With such small portion utilizing this service, traffic congestion during peak hours is overwhelming. Many residents of Los Angeles, regardless of traffic, still choose to drive over public transportation due to inconvenience. Surveys have shown that local commuters are unhappy about the travel time, cost, and difficult access to certain areas while many other residents list unreliability and safety concern as main reason for opting out of LA public transportation system. [5] The LA transit map is shown in Figure 2. Figure 2. Map of the Los Angeles Transit System. 5
  • 7. To reduce the impact on the environment, car companies have developed vehicles that produce partial to zero emission. In addition, California has become more stringent with emission standards. Eco-friendly vehicles mainly function on alternative energy sources without using fossil fuel or less carbon intensive gasoline or diesel. 1.4 Electric Vehicles Electric vehicles (EV) store energy in rechargeable batteries to power and propel the vehicle forward. Once empty the battery is easily recharged by plugging it into a wall socket. EVs are considered green because they do not pollution like a normal gasoline engine. They have also become cheaper to operate than gasoline-based vehicles saving the average driver one third of the typical fuel costs incurred by a gasoline-powered. [7] ​​ As of mid 2016, the world’s top selling electric cars are the Nissan Leaf and Tesla Model S. Figure 3. Mid 2016 world's top selling electric vehicles (left) Nissan Leaf and (right) Tesla Model S. 1.5 Fuel Cell Vehicle Fuel Cell Vehicles (FCV) also significantly reduces the cost dependence on oil prices and harmful emissions to the environment. FCVs convert hydrogen gas and oxygen into electricity to power the electric motor and battery while also storing energy from regenerative braking to provide additional power to the motor. It contains a hydrogen storage tank where hydrogen is compressed at extreme pressures to increase driving range. [8] Toyota and Hyundai have engineered the most popular Fuel Cell Vehicles with the Mirai and Tucson models. Figure 4. Most Popular Fuel Cell Vehicles (left) Toyota Mirai and (right) Hyundai Tucson. 6
  • 8. 1.6 Hybrid Electric Vehicles A Hybrid Electric Vehicle (HEV) uses a combination of an electric motor and a conventional gasoline or diesel engine to improve fuel economy and increase power. These vehicles run on fuel without needing to be plugged into an electrical outlet. When compared to battery electric vehicles, HEVs have an extended driving range by lowering the all-electric threshold. Technologies typically available in a HEV are regenerative braking, electric motor drive assist and automatic star/shutoff. The most popular hybrid cars in 2016 are Toyota Prius and the Ford Fusion. Figure 5. Most Popular Hybrids (left) Toyota Prius and (right) Ford Fusion. 1.7 Preferred Advanced Technology From the three previously mentioned eco-friendly technologies, the most accessible and viable choice for today’s existing conditions is a hybrid. Even though fuel cell cars and pure electric produce less harmful emissions, manufacturing is more expensive and infrastructure for hydrogen delivery in the city is very limited to satisfy driver’s needs. Moreover, the most affordable EVs have a limited driving range of approximately 80 miles with long refueling times between six to eight hours, depending on the size of the battery. [9] For Los Angeles commuters and environmental concerns, the best option is a hybrid vehicle. For our design, we are committed to providing consumers with a hatchback style hybrid vehicle catering to the thrill seeking, adventurous driver who wish to drive in the fast lane while also conquering rough terrain. With the aggressive and sleek aerodynamic design of the car body, our objective is to create a unique and eco-friendly experience or our customers, as well as produce a cost efficient LEV. 1.8 General Requirements In order to combat the rising trends of pollutants and carbon emissions in urban areas, a partial zero emission vehicle will be designed to meet the needs of a typical Los Angeles commuter. The vehicle should meet or exceed the requirements listed in Table 1. The vehicle should also have minimum smog emissions and energy consumption. Utilizing current available technologies, the T180RX will have easy handling. And finally, it 7
  • 9. should be attractive and marketable compared with current vehicles in its class. One major issue that will arise when designing this vehicle is the struggle to balance power and fuel efficiency. Table 1: T180RX vehicle performance requirements Maximum Speed 120 mph Acceleration 0-60 mph in 6 secs Freeway Cruise Speed 60 mph Minimum Zero Emission Range 30 miles at 60 mph Total Range 320 miles (local and highway) 2 Style Design 2.1 Design Target The T180RX is a production compact hatchback styled around on and off road performance rally racing. The automobile would be marketed towards car enthusiasts as well as daily drivers who desire reasonable performance coupled with aggressive styling . Currently, there are no hybrid vehicles on the market that combine the hatchback’s day-to-day usefulness with performance features. Therefore, our designed vehicle will fill this gap in the market. Concept drawings are illustrated in Figure 6. Figure 6. T180RX 3-View conceptual drawings (appendix A) Aggressive and performance oriented styling was chosen to attract the described targeted audience. A wider body style, when compared to others in its class, allows for widened and 8
  • 10. flared wheel wells. The hood features a bulge with air vents on either side. The front bumper was designed to incorporate an intercooler and thus has a large vent. The dimensions of the T180RX as seen in Table 2 were created and estimated using cars in similar classes in conjunction with the aesthetic proportions of the concept drawings. The weight was found from averaging the weights of the Volkswagen GTI, Ford Focus RS, and Subaru WRX STI. The frontal area was estimated from the concept art. Table 2: General dimensions of the T180RX Height 4.83 ft 1.47 m Length 14.2 ft 4.32 m Width 5.83 ft 1.78 m Weight 3384 lb 1525 kg Frontal Area 20.99 ft​2 1.95 m​2 2.2 Performance Objectives To compete with existing cars in the market, the maximum speed was chosen to be 120 mph with a 0-60mph acceleration time of 6 seconds and desired range of 320 miles. The target MPG is 24 in the city. The T180RX, as a compact hatchback, should handle very well and have agile but stable steering. The steering radius is likely and most desirable to be 2 to 2.5 times the total length of the vehicle, or approximately 2.9-3.6 m. The steering response and sensitivity of the vehicle will depend on the speed. At low speeds the power steering will work more to increase sensitivity, while at high speeds the power steering will work less to provide the driver with more direct feel over the vehicle. The suspension should be stiff enough to provide good road feeling without forfeiting too much comfort while driving. The addition of multiple suspension settings will allow the driver to change stiffness based on desired driving conditions. 2.3 Technology Objectives There are three popular powertrains for hybrid vehicles currently in production: series hybrid, parallel hybrid, and dual hybrid. The series hybrid uses a gasoline engine and battery to power a motor which then turns the drive axle. The parallel hybrid uses an engine that can turn the drive axle through a transmission and also has a battery powered motor that can also turn the axle. Lastly, the dual hybrid utilizes an engine that can drive the axle and charge the battery in addition to a motor that can perform the same functions, leading to increased efficiency. Table 3 compares the different hybrid typed on fuel economy and driving performance. From Table 3, it is clear that the dual hybrid powertrain offers the most advantages, while the parallel hybrid powertrain is a close second. The main differentiator however, was the cost of the powertrain. While the dual powertrain is the most efficient owing to the additional power split 9
  • 11. device, its cost is too high. Since, the T180RX is aimed at the economic luxury segment, it was decided to use the efficient yet affordable parallel powertrain. Table 3: Hybrid Powertrain Comparison Chart Hybrid Type Fuel Economy Driving Performance Idling Stop Energy Recovery High Efficiency Operation Control Total Efficiency Acceleration Continuous High Output Series Superior Excellent Superior Superior Unfavorable Unfavorable Parallel Superior Superior Unfavorable Superior Superior Unfavorable Dual Excellent Excellent Excellent Excellent Superior Superior 2.4 Cost Objectives The T180RX was designed to be a upper-middle end hatchback accommodating 4 passengers. The T180RX targets middle class individuals with emphasis on ages 16-28. Therefore, all attempts were made to embody an entry-level performance coupé. It is designed to grab attention and while being compact, fun, and unique. The targeted purchase price for the T180RX is $35,000. The material costs and labor costs in manufacturing the T180RX are approximately $14,875 and $2,275, respectively. The operation costs over a five year period across similar vehicle models, such as the 2016 Volkswagen GTI, 2016 Ford Focus and the 2016 Mazda Speed 3 Hatchback, is approximately $34,500. This total took into consideration depreciation, fuel costs, insurance, taxes, and maintenance/repairs. However, since our model will be designed as a hybrid vehicle this value will slightly decrease due to fuel savings. Expected technology such as heated seats, bluetooth navigation system, cruise control, etc. will be including in the manufacturing costs. 3 Performance 3.1 Power Requirement The required total power, of a vehicle at any constant velocity before drivetrain losses is given by a sum of the powers to overcome rolling and drag forces, respectively, given by equations (1) and (2) where ​⍴​ is the density of air, ​A​ is the vehicle’s frontal area, ​V​ is the vehicle’s velocity, ​m is the vehicle’s mass, and ​g​ is the gravitational constant. (1) (2) 10
  • 12. The rolling friction coefficient ​f​R​ typically varies from 0.01 to 0.03 and increases with the vehicle’s velocity. Because the vehicle would likely see high speeds ​f​R​ was set to 0.025. The coefficient of drag ​C​d​ was estimated using the White method and found to be 0.33± 0.7, the relevant calculations can be seen in appendix B. The White method is an empirical method using statistics from real vehicles and their geometries. Since a vehicle is not a simple geometry, there methods would include wind tunnel testing and therefore are not applicable to this design process. 3.1.1 Power Required to Overcome Drag and Rolling Resistance With ​C​d​ and ​f​R​ calculated, the drag and rolling resistance forces can be calculated using previously defined quantities such as frontal area and mass. Since these two forces will act on the car continuously throughout the drive, they must be overcome requiring additional power. The power needed to overcome rolling resistance (P​r​), drag (P​d​), and the total power required (P​t​) can be calculated using the following equations. All are a function of the velocity. (3) (4) (5) Figure 7 shows the power required at the wheel to overcome the drag and rolling resistance. Figure 7. Required power at wheel as a function of the velocity 11
  • 13. As can be seen from the figure above, rolling power is linearly related to velocity, while drag and consequently, the total power have a cubic relationship with the velocity 3.1.2 Maximum Power Required Figure 7 only displays the power required for a car to travel on a flat road. However, this is not necessarily the maximum power required, as it does not take into consideration the power needed to travel up an incline. The maximum power is the maximum power required to either accelerate from 0 to 60 mph, cruise at 60mph up a incline, or maintain the max speed of 120 mph. As noted by, where (6) (7) (8) The results of the above calculations are summarized in the table 4. The maximum power required at wheel was found to be 147 hp (110 kW) Table 4: Summary of Power Required Total Power [hp] Total Power [kW] P​t​ at 120mph 109.011 81.290 P​t​ to accelerate from 0 to 60 mph 147.761 110.185 P​t​ at cruising speed on an incline 101.750 75.875 Max wheel power required 147.761 110.185 The calculations used for the values and figures computed in section can be seen in Appendix C. 3.2 Powertrain Design The major requirement for the T180RX is that it has a hybrid powertrain. The three main options for hybrid design are series, parallel, and dual. In a series hybrid, the engine is only used to generate electrical power, in a parallel hybrid the engine and motor drive the car, and in a dual hybrid the engine both generates electricity and drives the vehicle with the motor. Table 5 ranks each hybrid configuration based upon performance and fuel economy characteristics. 12
  • 14. Table 5: Comparison of fuel efficiency and driving performance for series, parallel and dual hybrid drivetrain. From table 5 one can see that the dual configuration hybrid vehicle outperforms both the parallel and series configurations in both fuel economy and driving. For these reasons the dual powertrain was chosen for the T180RX as it is a performance oriented vehicle. Table 6: The function of the engine, motor, and battery during different vehicle driving modes. While there are no specific fuel and energy consumptions available yet, fuel economy was optimized in all modes. For example, the T180RX will be equipped with regenerative braking, where the engine is used to generate electricity during braking. The flow of materials, energies, and signals are illustrated in Figure 8, a functional diagram. 13
  • 15. Figure 8. Functional diagram of dual hybrid It is seen in Figure 8 that the hybrid aspects complicate the functional process of the vehicle and require many more components than a regular internal combustion engine vehicle. The chosen components to fulfill the three main processes, convert the fuel to mechanical energy, store electrical energy, and convert electrical energy, will respectively be an internal combustion engine, lithium ion battery, and electric motor. 3.2.1 Engine and Motor Power Split Since T180RX ​is a parallel hybrid, it is necessary to determine how much power will come from the engine and how much will come from the motor. As calculated earlier, the maximum power needed at the wheels for the T180RX is 147 hp or 110 kW, so the engine or motor must combine to provide this amount of power at the wheels. Because efficiency is the main objective of the T180RX, our goal was to opt for the minimum battery required to keep the weight of the car to a minimum while meeting all the performance goals. Before the components can be selected, it is necessary to account for the losses between where the energy is converted - the engine and motor - and where the energy is applied - the drive wheels. In a typical manual transmission car, about 18-21% of the power that the engine and motor produce is lost before it gets to the wheels. Therefore, the maximum power required after these losses, is calculated as: (9) 14
  • 16. Thus, it was found that the engine and motor must produce 187.039 hp or 139.475 kW to completely power the vehicle. Once this is known, it is possible to calculate the minimum amount of energy needed in the battery. Since one of the main design goals of the T180RX is to have a 30 mile zero-emission cruise at 60mph, the minimum energy, E​min​, required can be calculated as: (10) From this equation it was found that the minimum battery energy required onboard is 11.224 kWh. It was decided that the power split strategy used for the car would be to minimize the battery. Thus, ​E​onboard​ ​= Emin and a battery with a minimum 11.224 kWh capacity was found. The most suitable battery found to meet these requirements was the Mitsubishi iMiEV 16kWh Li-Ion battery. Thus, the ​E​onboard​=16 kWh according to the battery’s specification and the Battery P/E ratio was found to be 3.0. With the Battery P/E ratio known, the engine and battery design space can be seen graphically in Figure 9​ ​ below: Figure 9. Engine/Battery Design Space 3.2.2 Engine and Motor Specifications With ​E​onboard​ and Battery P/E ratio known, the valid ​P​motor​ range, ​P​motor​ , and ​P​engine​ can be calculated with equations (11) and (12). 15
  • 17. (11) (12) From the above equations, ​P​motor​ was chosen to be 48 kW and ​P​engine​ was calculated to be 86,475 kW. Taking the minimum power required for the engine and motor into consideration, and the goal of a powerful car, the following engine and motor were selected for the T180RX​. Table 7: Engine Specifications Engine BMW 1.6 liter EP6/EP6C Horsepower 118 hp (88 kW) at 6000 rpm Torque 118 lb-ft (160 N·m) at 4250 rpm. No. of Cylinders Four Displacement 1598 cc Stroke 85.8 mm (3.4 in) Table 8: Motor Specifications Motor Permanent magnet AC synchronous motor Power 53 kW Torque 120 lb.-ft. (163 N•m) Voltage 600V The selected motor and engine are a great fit for the T180RX because it provides slightly more power than the conservative estimate from Figure 9. It is always a good idea to build a margin into designs to avoid any unforeseen power losses. In addition, the engine is a BMW engine, and the motor is used in a Toyota Prius, making them both highly reliable components. Thus, we anticipate that the customers will be very happy with their ride quality. 3.3 Drivetrain Design In order to deliver the power generated from the engine, a drivetrain is needed. A gearbox is used to deliver maximum engine power without having to accelerate to the maximum road speed. Additionally, having gears increases the efficiency of the engine, since an engine is the most efficient near the maximum speed. This relationship is evident from equation (13) where V 16
  • 18. is the car’s velocity in miles per hour, D is the diameter of the wheels in inches, N is the number of rotations per minute, G is the gear ratio, and R is the differential ratio. (13) While V, D, and N are known, G is assumed to be 1.0 at the car’s maximum speed. From this, R is calculated to be 2.5. With R known, all the gearbox ratios were calculated and can be seen in Table 9. Table 9: Transmission Gear Ratios Gear Speed (mph) Gear Ratio, G Differential Ratio 2.51 20 6.0 2 40 3.0 3 60 2.0 4 80 1.5 5 100 1.2 6 120 1.0 A similar process is completed for the motor as well, but since the motor is not geared, the gear ratio is 1. Once the motor reaches its maximum power output, it continues to produce at the level regardless of speed. While is this is only a simplification, it works well for near perfect results. 3.4 Power Curve and Acceleration Performance Now that the gearbox and differential ratios for the engine are known, and the specifications and output of the motor is known, it is possible to calculate the Power Available for the T180RX. After the power available from the engine and motor were calculated, they were added to the power required chart and can be seen in the Figure 10. The data for this chart can be referred to in Appendix D. 17
  • 19. Figure 10. Power Available and Power Required Chart (WHP) In the Figure 10, the solid red, blue and orange lines represent the total power available, the power available from engine, and the power available from the motor respectively. The solid grey line, the dashed green line and the dashed purple line represent the total power required, the drag power required and the rolling power required respectively. As can be seen from the figure, the total power available is much higher than the total power required, which is necessary for efficient acceleration. The six peaks of the engine power available and total power available are the points when the engine is operating at its most efficient in each of the 6 gears. Also, the motor does not provide completely constant power in reality, however it is a reasonable simplification to make. 3.4.1 Acceleration Calculation In order for a car to accelerate, additional power beyond the power required to overcome drag and rolling resistance is needed. Therefore, any available power that is not being used to overcome the resistance forces can be used to accelerate the car. This is shown in the equation (13). (13) 18
  • 20. Where P​e​ is the excess power available, P​a​ is the total power available, and P​r​ is the required power available at that speed. On integrating with respect to time, and breaking the velocity in intervals, the average excess power available is found as: Then the average acceleration due to that excess power and the time that passes at that step is calculated using equations (14) and (15). (14) (15) With this the time needed to accelerate from one velocity to another can be found, and the results can be seen in the Figure 11. These calculations can be seen in Appendix E. Figure 11. Acceleration curve. 0 -60 mph time indicated at 6.9 sec. From the Figure 11, it can be seen that it takes 6.94 seconds to reach 60mph. This shows that the chosen engine, motor and battery have led to a good performance of the car, and has helped us to almost reach our set performance goal of 6 seconds. Overall, we are very pleased with the acceleration performance of the T180RX. 4 Energy System Once the acceleration performance is evaluated, it is possible to analyze the energy consumption of the car. In order to analyze the energy consumption, it is necessary to determine the power usage of the car during different scenarios like, acceleration, deceleration, cruising, hill climbing, etc. 19
  • 21. 1.​ ​Calculate Energy Usage for Acceleration The energy required during acceleration can be found by summing the energy for every segment by using the below equation. 2.​ ​Calculate Energy Usage for Deceleration 3.​ ​Calculate Power Usage for Cruising 4.​ ​Calculate Power Usage for Hill Climbing Where, BSFC is the Brake Specific Fuel Consumption and is defined as the fuel flow per horsepower. The BSFC for most car engines is about 0.5[lb/hr]/HP. The BSFC depends on the engine speed, and the values were calculated from the following chart. Figure 12. Customized BSFC chart for T180RX engine. 4.1 Mission Scenario Analysis Since there are many potential ways to a design a car’s use and creation of energy, it is imperative to have a target driver and consider how the driver will use the car. The target T180RX​ driver is assumed to be a young person who would be driving in the city, hence will mostly be cruising, and braking. Taking this into consideration, a Mission Table was created. 20
  • 22. Figure 13. Mission scenario table with calculated results for T180RX. Once the power usage for every scenario was calculated, and the corresponding engine speed and BSFC were found, the total energy usage, energy per cycle for the engine, and the energy per cycle for the motor were calculated according to the Engine-Motor energy split. The number of cycles for every scenario were determined according to the target driver of the car, which allowed us to find the total energy usage for the engine and the motor. The total time, and the total range of the car were also determined. The total fuel needed was then calculated using equation (16). (16) This was then converted from kg to gallons. Further the fuel tank size was determined by adding 10% to the total fuel needed and was found to be ​16.5 gallons​. Finally, the MPG was calculated as follows and was found to be: The dimensions of the fuel tank selected can be seen in table 10. Table 10. Dimensions of gasoline tank in T180RX. Gasoline Tank Dimensions Length 0.38m Width 0.38m Height 0.38m 21
  • 23. 4.2 Battery Requirements The battery in the T180RX​ ​will be a Lithium-Ion battery, which was chosen for its high energy and power densities, and long life cycles. The properties of the battery can be seen below: Table 11. Battery Properties Producer Mitsubishi iMiEV Energy Density 109 Wh/kg Voltage 330 V Range 128 km (80 miles) Weight 146 kg Number of Cells 88 cells Charge time 13h at 115VAC 15A 7h at 230VAC 15A 4.3 Energy Schematic Once all the components of the car were chosen, it was necessary to decide their layout keeping the weight balance in mind. After trial and error, the layout shown in the figure below was chosen. 22
  • 24. Figure 14. Energy System Schematic As can be seen in the energy schematic, all attempts were made to successfully balance the weight throughout the T180RX. 5 Steering and Suspension Dynamics 5.1 Steering Design The Ackerman level of a vehicle’s steering linkage geometries defines the radii of which each steering wheel will rotate about while the vehicle is negotiating a turn. Pure Ackerman provides that both the steering wheels’ turn radii coincide on the same turn center or that each wheel follow concentric curves. Under Ackerman causes the inner wheel to try to follow a smaller diameter circle than the car actually does, while over Ackerman does the opposite. Ideally pure Ackerman will provide the least wear on the tires and the best steering response however, actual cars do not use pure Ackerman steering linkage because of dynamic effects. Pure Ackerman linkage design was chosen for the T180RX since these dynamic effects are not currently accounted for. The maximum steering arm, , to achieve the desired max inside steering angle, , foundamax δmax using equation (17). 23
  • 25. (17) where Thus the maximum steering arm was found to be 4.2 feet. The actual steering arm length, , was chosen to be 10 inches as the normal range is from 10-13 inches. A steering arm length ina this range provides that the steering response of the trapezoidal linkage will be converge as close to the Ackerman linkage as possible. The following drawings show the Ackerman linkage with the corresponding dimensions. Figure 15. Ackerman linkage design. 24
  • 26. The vehicle steering dimensions are presented in table 12. Table 12. Vehicle steering dimensions. Vehicle and Steering Linkage Geometry Dimension L 8.67 ft t 5.32 ft a 0.83 ft b 4.832 ft β 17.06 (deg) α 43.74 (deg) δimax 29.2 (deg) The lateral acceleration gain and the yaw speed gain were calculated using equations (18) and (19), respectively. Graphing steering angle over curvature as seen in Figure 16, we see a linear relationship at various velocities. (18) (19) 25
  • 27. Figure 16. Steering angle vs Curvature plot 5.2 Suspension Design The unsprung mass of the vehicle was calculated as 14% of the curb weight, and was found to be 474 lbs. The sprung mass was then calculated as 2910 lb. For our vehicle, values for the spring rate, rear spring rate, and body spring rate are listed in Table 13. These values were obtained from the suggested range of values for each, and tweaked around till the desirable pitch and bounce frequencies, and ride ratio were obtained. The pitching and bouncing frequencies of our vehicle were calculated from the equations below. Once the P&B frequencies were found, the ride ratio was calculated to be 1.2. (20) (21) After calculating these values, the roll gradient was found using the inverse of the following equation: Where , , and represent the front wheel displacement, rear wheel displacement, andXf Xr Xb chassis wheel displacement, respectively. The T180RX is between a compact and sports vehicle and therefore the center of gravity (CG) height was chosen to be close to 23 inches. From this, the roll gradient was found to be 0.29 deg/g and falls within high downforce vehicles. Double wishbone suspension was chosen for the front and rear of the vehicle as it provides ideal camber control for better handling; and for a sports car, it is ideal to have the motion of the wheels independent from each other. The vehicle suspension geometries are illustrated below. 26
  • 28. Figure 17. Double wishbone suspension for front and rear wheels. ​Table 13: Summary of all relevant parameters for T180RX Vehicle Parameter Value Front Spring Rate, ​S​f 100 lb/in Rear Spring Rate, ​S​r 110 lb/in Body Spring Rate, ​S​b 50 lb/in Tire Spring Rate, ​S​t 1000 lb ⍵nr 1.244 Hz ⍵nf 1.035 Hz Ride Ratio, /⍵nr ⍵nf 1.202 CG to front axle distance, Lf 3.74 ft CG to rear axle distance, Lr 4.95 ft Roll Gradient, ​G​ro 0.29 Rolling Arm, ​d 9.8 in Roll Center, ​R​o 13.1 in CG height 22.9 in Front Wheel Roll Center,​ R​of 3.0 in Rear Wheel Roll Center, ​R​or 17.8 in 27
  • 29. Figure 18. Vehicle suspension geometries. 6 Packaging Design The ergonomics of the T180RX were designed considering the vehicle would be a production compact hatchback. It should therefore be suitable for a large percentage of the population and be comfortable. The driving seating configuration was designed as follows using SAE median values. Figure 19. Vehicle seating configuration Table 14. Driving Rig Values Ergonomic Variable L11 [in] L40 [deg.] L53 [in] H30 [in] H17 [in] Value 18 15 24 12 27 28
  • 30. The driving rig values were determined for a comfortable feel for all drivers ranging from young to old and male or female. The T180RX is suitable for five person occupation including the operator of the vehicle as shown in Figure 20. The material and fabric of the interior would vary depending on the package that the consumer selects. Vehicle sightlines were determined in Figures 21 - 23. Blind spots were slightly smaller since the T180RX is a compact car. Figure 20. 3-View package drawing Figure 21. Vehicle sightlines for left side of the driver window. 29
  • 31. Figure 22. Vehicle sightlines for left side of the driver window. Top view Figure 23. Vehicle sightlines for front and rear windows 7 Weight and Cost 7.1 Weight Schedule Researching other vehicles of the same size and functionality, estimates of each part were made. Categorizing them into body/ chassis, propulsion and braking, electrical, heating and ventilation, the weights of each all total to the curb weight of the T180RX. On the far right column of Table 15, percentages of each component show how much it contributes to the overall weight. 30
  • 32. Table 15. Weight distribution of body/chassis Body/Chassis LB % Body, paint and glass 1089.648 32.2 Bumpers 186.12 5.5 Grille and Lamps 16.92 0.5 Exterior Ornamentation 3.384 0.1 Instrument Panel & Steering Wheel 37.224 1.1 Interior Trim 209.808 6.2 A. Rear Seats & Seat Belts 37.224 1.1 B. Rear Floor & Tunnel Insulation 10.152 0.3 Suspension & Shock Absorbers 175.968 5.2 Steering System 77.832 2.3 Wheels (5) 101.52 3.0 Tires & Valves (5) 118.44 3.5 Radiator 13.536 0.4 Exhaust System 54.144 1.6 Fuel Tank, Lines & System 33.84 1.0 Engine Support 20.304 0.6 Throttle, Shift, Clutch Control 10.152 0.3 Standard Tools 10.152 0.3 Gasoline, Full Capacity 108.288 3.2 Subtotals 2314.656 68.4 Table 16. Weight distribution of propulsion and braking Propulsion & Braking LB % Engine and Accessories 517.752 15.3 Transmission 98.136 2.9 Drive Shaft 16.92 0.5 Drive Axle 138.744 4.1 Brake System 159.048 4.7 Engine Coolant and Oil 33.84 1.0 Transmission & Axle Lubricant 6.768 0.2 Subtotals 971.208 28.7 31
  • 33. Table 17. Weight Distribution of Electrical, Heating, and Ventilation Electrical, Heating & Ventilation LB % Electric Circuits 30.456 0.9 Heater System 23.688 0.7 Battery 43.992 1.3 Subtotals 98.136 2.9 Curb Weight 3384 100.00 From the weight schedule, it is evident that the body, paint, and glass contribute the most weight at 32%, compared to the other components listed. At 15.3%, the engine along with its accessories carry the second largest weight at roughly 518 lbs. From these estimates, we have attempted to maximize the weight efficiency of the T180RX by allocating the majority of the weight to these specified components. 7.2 Cost Estimate Figure 24 . Cost breakdown of T180RX. Cost is initially estimated in the embodiment and design stage of the vehicle. As specifications and features are finalized throughout the design phase, estimation of cost becomes more solidified. Majority of the cost comes from manufacturing and it can vary depending on costs of different components and the whether it utilizes traditional manufacturing techniques. Majority of the engineering that was done in the previous sections only took 6.5% of the manufacturer’s suggested retail price. 32
  • 34. Table 18 . Percentage breakdown of MSRP. Type of Cost Percentage (%) Manufacturing Costs 50 Warranty 5 R&D/Engineering 6.5 Depreciation & Amortization 5.5 Corporate Overhead 7 Selling 23.5 Proft 2.5 Total MSRP 100 8 Comparison with Competitors Figure 25. 2017 Volkswagen Golf GTI One vehicle in the current market that is similar to T180RX is the 2017 Volkswagen Golf GTI. The dimensions and vehicle performance specifications are compared in Table 19. Table 19. Comparison of T180RX and 2017 Volkswagen Golf GTI. 2017 Volkswagen Golf GTI T180RX Height 4.73 ft. 4.83 ft. Width 5.88 ft. 5.83 ft. Length 14 ft. 14.2 ft. Weight 2972 lbs. 3384 lbs. Engine Hp 210 @ 4500 RPM 118 HP @ 6000 RPM MPG 28 22 0-60 mph time 5.9 sec 6.9 sec 33
  • 35. Both cars are sport compact cars but the T180RX is a two door. The engine rating for the Golf GTI has extra horsepower that help it reaches 60 mph faster at full throttle. However, the T180RX 0-60 mph time is relatively good considering its horsepower is approximately half of the Golf GTI. One disadvantage of the T180RX is that it is almost 400 lbs. heavier compared to the Golf GTI contributing to the lower MPG of the T180RX. The use of the motor can reduce emission in heavy traffic as opposed to the Golf GTI which is all engine powered. They both fall under similar price range with the T180RX being slightly cheaper. 9 Conclusions The T180RX is an efficient sports compact car. It powertrain is a dual hybrid drive which is ideal for a busy city like Los Angeles, allowing it to use its electric motor in slower speeds and its engine on open roads. The engine has a rating of 118 HP at 6000 RPM and the motor has a rating of 53kW. The maximum speed power 187 hp. The battery to power the motor is lithium-ion battery with a density of 109 Wh/kg. The 0 – 60 mph acceleration time for the T180RX is 6.9 seconds. Cost of the T180RX is $23,250. It was learned from designing the T180RX, that hybrid cars take much more planning to take make an efficient in comparison to traditional cars. The original goals were for the car to be extremely powerful but due to limitations of using a motor and being fuel efficient, expectations had to be tempered. Researching for specific parts for a vehicle require a lot of time since they are not readily available like other commercial items. By being smart with driving style the car efficiency can dramatically increase the miles per gallon of the car. The T180RX is relatively efficient for its size and speed capability but there are many opportunities for it to be environmentally friendly with some fine tuning. It’s an impressive car but would fall on the expensive side due to the not ideal MPG. Marketing and advertisement are the next steps in the post production phase. 10 Recommendations For future development of the T180RX, a higher split of the motor should be recommended and put less reliance on the engine in order to increase fuel efficiency. This will come with an expense to power of the vehicle but reducing emissions is the ultimate goal of it being a hybrid vehicle. Reducing the cycles of the extreme energy consuming driving modes will help reduce emission and get more out of the vehicle. For example, instead of having 15 cruise cycles and increase the lower cruising cycles. Another major goal, would be to reduce to the overall weight of the vehicle which would optimize the maximum speed and 0-60 mph time. 34
  • 36. 11 References 1. Branch, Geographic Products. "2010 Census Gazetteer Files Record Layouts." ​2010 Census Gazetteer Files - Geography - U.S. Census Bureau​. N.p., 01 Sept. 2012. Web. 2 Mar. 2017. 2. Service, City News. "Los Angeles Area Has the Nation’s Worst Traffic, Study Says." ​LA Daily News​. LA Daily News, 15 Mar. 2016. Web. 1 Mar. 2017. 3. Allen, Karma. "Los Angeles the World's Most Traffic-clogged City, Study Says." ​ABC News​. ABC News Network, n.d. Web. 4 Mar. 2017. 4. "Los Angeles and Bakersfield Top List of Worst Air Pollution in the Nation." ​Los Angeles Times​. Los Angeles Times, n.d. Web. 2 Mar. 2017. 5. Lazarus, David. "Fixes Needed for L.A. Public Transit System." ​Los Angeles Times​. Los Angeles Times, 13 May 2010. Web. 1 Mar. 2017. 6. "Bradenton, Florida." ​Wikipedia​. Wikimedia Foundation, 10 Mar. 2017. Web. 3 Mar. 2017. 7. "How Do Battery Electric Cars Work?" Union of Concerned Scientists. N.p., n.d. Web. 5 Mar. 2017. 8. "Fuel Cell Vehicles." Fuel Economy. N.p., n.d. Web. 8 Mar. 2017. 9. "Need to Know." Is It Easy to Charge an Electric Car? N.p., n.d. Web. 9 Mar. 2017. 35
  • 37. 12 Appendix Appendix A: Vehicle Specification Sheet 36
  • 38. 37
  • 39. 38
  • 40. Ergonomics Driver size adjustments L11-18in, L40-15 deg, L53-24 in, H30-12 in, H17- 27 in Seat Synthetic leather and sport padding Driver Visibility F: 30 in, Driver Side: 40in, Pass-side: 80 in, R: 120 in 39
  • 41. Appendix B: The White Method 40
  • 42. Appendix C: Power Required Calculation 41
  • 43. Appendix D: Power Curve 42
  • 46. Appendix G: Gain Curves 45