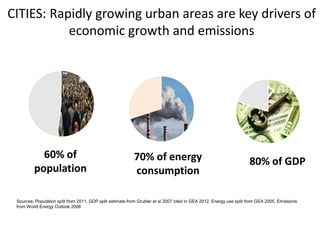
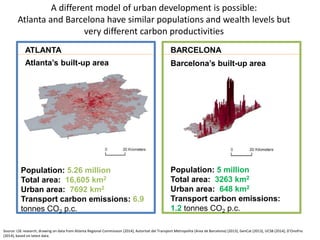
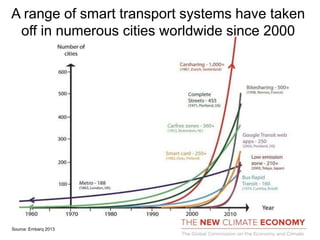
Better Growth Better Climate
Madhav Pai
connectkaro.org
connectkaro.org
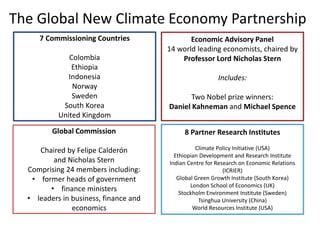
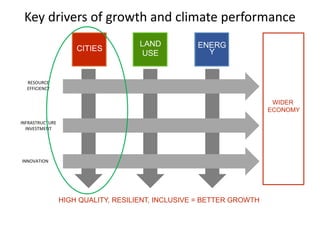
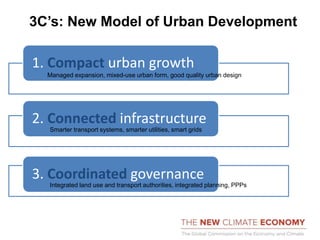
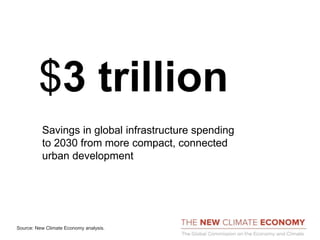
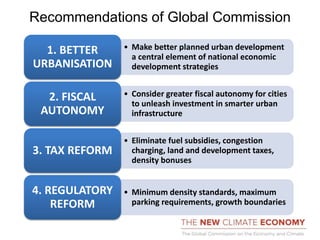
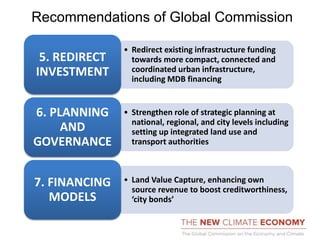
The Global New Climate Economy Partnership
Global Commission
Chaired by Felipe Calderón
and Nicholas Stern
Comprising 24 members including:
• former heads of government
• finance ministers
• leaders in business, finance and
economics
Economic Advisory Panel
14 world leading economists, chaired by
Professor Lord Nicholas Stern
Includes:
Two Nobel prize winners:
Daniel Kahneman and Michael Spence
7 Commissioning Countries
Colombia
Ethiopia
Indonesia
Norway
Sweden
South Korea
United Kingdom
8 Partner Research Institutes
Climate Policy Initiative (USA)
Ethiopian Development and Research Institute
Indian Centre for Research on Economic Relations
(ICRIER)
Global Green Growth Institute (South Korea)
London School of Economics (UK)
Stockholm Environment Institute (Sweden)
Tsinghua University (China)
World Resources Institute (USA)
Members of the Global Commission
Jean Pascal Tricoire
CEO, Schneider
Electric
Felipe Calderón (Chair)
Former President,
Mexico
Ingrid Bonde
CFO and Deputy
CEO, Vattenfall
Sharan Burrow
General Secretary,
International Trade
Union Confederation
Chen Yuan
Former Chairman,
Chinese Development
Bank
Helen Clark
Administrator, UNDP
Luísa Diogo
Former Prime
Minister, Mozambique
Dan Doctoroff
Former CEO,
Bloomberg
S. (Kris) Gopalakrishnan
Co-founder, Infosys
Angel Gurría
Secretary General,
OECD
Chad Holliday
Chairman-designate,
Shell
Sri Mulyani Indrawati
Managing Director and
COO, World Bank
Caio Koch Weser
Vice Chairman,
Deutsche Bank
Ricardo Lagos
Former President,
Chile
Michel Liès
CEO, Swiss Re
Trevor Manuel
Former Finance
Minister, South Africa
Takehiko Nakao
President, Asian
Development Bank
Eduardo Paes
Mayor, Rio de Janeiro
Annise Parker
Mayor, Houston
Paul Polman
CEO, Unilever
Nicholas Stern (Vice-Chair)
IG Patel Professor at the
London School of Economics
and Political Science
Zhu Levin
Former CEO, China
International Capital
Corporation
Jens Stoltenberg
Former Prime
Minister, Norway
Maria van der Hoeven
Executive Director,
International Energy
Agency
Ngozi Okonjo-Iweala
Minister of Finance,
Nigeria
Naina Lal Kidwai
Chairman, HSBC
India
Suma Chakrabarti
President, EBRD
Kristin Skogen Lund
Director General,
Confederation of
Norwegian Enterprise
Key drivers of growth and climate performance
RESOURCE
EFFICIENCY
INNOVATION
INFRASTRUCTURE
INVESTMENT
HIGH QUALITY, RESILIENT, INCLUSIVE = BETTER GROWTH
ENERG
Y
LAND
USE
CITIES
WIDER
ECONOMY
CITIES: Rapidly growing urban areas are key drivers of
economic growth and emissions
Sources: Population split from 2011, GDP split estimate from Grubler et al 2007 cited in GEA 2012, Energy use split from GEA 2005, Emissions
from World Energy Outlook 2006
60% of
population
80% of GDP70% of energy
consumption
3C’s: New Model of Urban Development
1. Compact urban growth
2. Connected infrastructure
3. Coordinated governance
Managed expansion, mixed-use urban form, good quality urban design
Smarter transport systems, smarter utilities, smart grids
Integrated land use and transport authorities, integrated planning, PPPs
A different model of urban development is possible:
Atlanta and Barcelona have similar populations and wealth levels but
very different carbon productivities
Atlanta’s built-up area Barcelona’s built-up area
Population: 5.26 million
Total area: 16,605 km2
Urban area: 7692 km2
Transport carbon emissions: 6.9
tonnes CO2 p.c.
Population: 5 million
Total area: 3263 km2
Urban area: 648 km2
Transport carbon emissions:
1.2 tonnes CO2 p.c.
ATLANTA BARCELONA
Source: LSE research, drawing on data from Atlanta Regional Commission (2014), Autoritat del Transport Metropolita (Area de Barcelona) (2013), GenCat (2013), UCSB (2014), D’Onofrio
(2014), based on latest data.
A range of smart transport systems have taken
off in numerous cities worldwide since 2000
Source: Embarq 2013
There are affordable mass transit solutions:
BRT can be delivered at 15% of the cost of a metro
Number of cities (Source: Wright 2007)
Implementing smart
transport infrastructures
such as Bus Rapid Transit
(BRT) has transformative
effects
Cities
1995 201020001990 20142005
USD/MWh
Current fossil fuel
range, indicative
Solar PV, historical
Best utility-scale
project, 2014
Sources: Citi Research 2012; G. F Nemet, “Beyond the learning curve”, Energy Policy 34, 3218-3232 (2006)
ENERGY: The cost of solar PV is
dropping fast
ENERGY: Wind turbines have evolved to have 100 times
more power generation capabilities than 30 years ago
Sources: Cityfix.com, NY Times, LSE and NCE Cities – Paper 03 Accessibility in Cities: Transport and Urban Form, p 10-11
Energy in Cities1. Building Sector:
• Improved design
• Insulation
• Lighting and heating/cooling
• Small scale renewables
Leeds, UK
• Payback < 3 years
• Domestic sector emission
reductions of 16%
2. Transport Sector:
• Efficient vehicles
• Cleaner fuels
• Public Transport
3. Waste Management:
• Recylcing
• Landfill gas capture
• Composting of waste
Lima-Callao, Peru
• Payback 2.6 years
• Transport related emission
reductions of 26% by 2025
Kolkata, India:
• Payback 11.8 years
• Waste related emission
reductions of 41% by 2025
INNOVATION: Google is becoming one of the
biggest “clean tech” companies on the planet
Source: Google, Greentech Media
Savings in global infrastructure spending
to 2030 from more compact, connected
urban development
Source: New Climate Economy analysis.
$3 trillion
Recommendations of Global Commission
• Make better planned urban development
a central element of national economic
development strategies
1. BETTER
URBANISATION
• Consider greater fiscal autonomy for cities
to unleash investment in smarter urban
infrastructure
2. FISCAL
AUTONOMY
• Eliminate fuel subsidies, congestion
charging, land and development taxes,
density bonuses
3. TAX REFORM
• Minimum density standards, maximum
parking requirements, growth boundaries
4. REGULATORY
REFORM
Recommendations of Global Commission
• Redirect existing infrastructure funding
towards more compact, connected and
coordinated urban infrastructure,
including MDB financing
5. REDIRECT
INVESTMENT
• Strengthen role of strategic planning at
national, regional, and city levels including
setting up integrated land use and
transport authorities
6. PLANNING
AND
GOVERNANCE
• Land Value Capture, enhancing own
source revenue to boost creditworthiness,
‘city bonds’
7. FINANCING
MODELS
connectkaro.org

Session 6 - Better Growth Better Climate

  • 1.
    Better Growth BetterClimate Madhav Pai connectkaro.org
  • 2.
  • 3.
    The Global NewClimate Economy Partnership Global Commission Chaired by Felipe Calderón and Nicholas Stern Comprising 24 members including: • former heads of government • finance ministers • leaders in business, finance and economics Economic Advisory Panel 14 world leading economists, chaired by Professor Lord Nicholas Stern Includes: Two Nobel prize winners: Daniel Kahneman and Michael Spence 7 Commissioning Countries Colombia Ethiopia Indonesia Norway Sweden South Korea United Kingdom 8 Partner Research Institutes Climate Policy Initiative (USA) Ethiopian Development and Research Institute Indian Centre for Research on Economic Relations (ICRIER) Global Green Growth Institute (South Korea) London School of Economics (UK) Stockholm Environment Institute (Sweden) Tsinghua University (China) World Resources Institute (USA)
  • 4.
    Members of theGlobal Commission Jean Pascal Tricoire CEO, Schneider Electric Felipe Calderón (Chair) Former President, Mexico Ingrid Bonde CFO and Deputy CEO, Vattenfall Sharan Burrow General Secretary, International Trade Union Confederation Chen Yuan Former Chairman, Chinese Development Bank Helen Clark Administrator, UNDP Luísa Diogo Former Prime Minister, Mozambique Dan Doctoroff Former CEO, Bloomberg S. (Kris) Gopalakrishnan Co-founder, Infosys Angel Gurría Secretary General, OECD Chad Holliday Chairman-designate, Shell Sri Mulyani Indrawati Managing Director and COO, World Bank Caio Koch Weser Vice Chairman, Deutsche Bank Ricardo Lagos Former President, Chile Michel Liès CEO, Swiss Re Trevor Manuel Former Finance Minister, South Africa Takehiko Nakao President, Asian Development Bank Eduardo Paes Mayor, Rio de Janeiro Annise Parker Mayor, Houston Paul Polman CEO, Unilever Nicholas Stern (Vice-Chair) IG Patel Professor at the London School of Economics and Political Science Zhu Levin Former CEO, China International Capital Corporation Jens Stoltenberg Former Prime Minister, Norway Maria van der Hoeven Executive Director, International Energy Agency Ngozi Okonjo-Iweala Minister of Finance, Nigeria Naina Lal Kidwai Chairman, HSBC India Suma Chakrabarti President, EBRD Kristin Skogen Lund Director General, Confederation of Norwegian Enterprise
  • 5.
    Key drivers ofgrowth and climate performance RESOURCE EFFICIENCY INNOVATION INFRASTRUCTURE INVESTMENT HIGH QUALITY, RESILIENT, INCLUSIVE = BETTER GROWTH ENERG Y LAND USE CITIES WIDER ECONOMY
  • 6.
    CITIES: Rapidly growingurban areas are key drivers of economic growth and emissions Sources: Population split from 2011, GDP split estimate from Grubler et al 2007 cited in GEA 2012, Energy use split from GEA 2005, Emissions from World Energy Outlook 2006 60% of population 80% of GDP70% of energy consumption
  • 7.
    3C’s: New Modelof Urban Development 1. Compact urban growth 2. Connected infrastructure 3. Coordinated governance Managed expansion, mixed-use urban form, good quality urban design Smarter transport systems, smarter utilities, smart grids Integrated land use and transport authorities, integrated planning, PPPs
  • 8.
    A different modelof urban development is possible: Atlanta and Barcelona have similar populations and wealth levels but very different carbon productivities Atlanta’s built-up area Barcelona’s built-up area Population: 5.26 million Total area: 16,605 km2 Urban area: 7692 km2 Transport carbon emissions: 6.9 tonnes CO2 p.c. Population: 5 million Total area: 3263 km2 Urban area: 648 km2 Transport carbon emissions: 1.2 tonnes CO2 p.c. ATLANTA BARCELONA Source: LSE research, drawing on data from Atlanta Regional Commission (2014), Autoritat del Transport Metropolita (Area de Barcelona) (2013), GenCat (2013), UCSB (2014), D’Onofrio (2014), based on latest data.
  • 9.
    A range ofsmart transport systems have taken off in numerous cities worldwide since 2000 Source: Embarq 2013
  • 10.
    There are affordablemass transit solutions: BRT can be delivered at 15% of the cost of a metro Number of cities (Source: Wright 2007) Implementing smart transport infrastructures such as Bus Rapid Transit (BRT) has transformative effects Cities
  • 11.
    1995 201020001990 20142005 USD/MWh Currentfossil fuel range, indicative Solar PV, historical Best utility-scale project, 2014 Sources: Citi Research 2012; G. F Nemet, “Beyond the learning curve”, Energy Policy 34, 3218-3232 (2006) ENERGY: The cost of solar PV is dropping fast
  • 12.
    ENERGY: Wind turbineshave evolved to have 100 times more power generation capabilities than 30 years ago Sources: Cityfix.com, NY Times, LSE and NCE Cities – Paper 03 Accessibility in Cities: Transport and Urban Form, p 10-11
  • 13.
    Energy in Cities1.Building Sector: • Improved design • Insulation • Lighting and heating/cooling • Small scale renewables Leeds, UK • Payback < 3 years • Domestic sector emission reductions of 16% 2. Transport Sector: • Efficient vehicles • Cleaner fuels • Public Transport 3. Waste Management: • Recylcing • Landfill gas capture • Composting of waste Lima-Callao, Peru • Payback 2.6 years • Transport related emission reductions of 26% by 2025 Kolkata, India: • Payback 11.8 years • Waste related emission reductions of 41% by 2025
  • 14.
    INNOVATION: Google isbecoming one of the biggest “clean tech” companies on the planet Source: Google, Greentech Media
  • 15.
    Savings in globalinfrastructure spending to 2030 from more compact, connected urban development Source: New Climate Economy analysis. $3 trillion
  • 16.
    Recommendations of GlobalCommission • Make better planned urban development a central element of national economic development strategies 1. BETTER URBANISATION • Consider greater fiscal autonomy for cities to unleash investment in smarter urban infrastructure 2. FISCAL AUTONOMY • Eliminate fuel subsidies, congestion charging, land and development taxes, density bonuses 3. TAX REFORM • Minimum density standards, maximum parking requirements, growth boundaries 4. REGULATORY REFORM
  • 17.
    Recommendations of GlobalCommission • Redirect existing infrastructure funding towards more compact, connected and coordinated urban infrastructure, including MDB financing 5. REDIRECT INVESTMENT • Strengthen role of strategic planning at national, regional, and city levels including setting up integrated land use and transport authorities 6. PLANNING AND GOVERNANCE • Land Value Capture, enhancing own source revenue to boost creditworthiness, ‘city bonds’ 7. FINANCING MODELS
  • 18.

Editor's Notes

  • #4 THANK THE THREE GLOBAL COMMISSIONERS and CHINESE EAP MEMBER. Governor Chen Yuan – Vice Chairman CPPCC - Chinese People's Political Consultative Conference. (Global Commissioner) President Chen Jining – President of Tsinghua. Zhu Levin (Global Commissioner) Fan Gang – member of the Economics Advisory Panel. AND FAN GANG
  • #6 The Commission has focused on three drivers of growth that affect every sector of the economy: resource efficiency, infrastructure investment, and innovation. There are major opportunities in three socio-economic systems: cities, land use, and energy systems. These three systems are crucial to the economy and emissions and can unlock multiple economic, social, and environmental benefits. Note: Cities include urban transport. Land use includes forests. Innovations include economy-wide innovation
  • #7 The urban share of the global population is expected to rise to 70% by 2050, with 90% of this growth coming in developing countries. The way that this urbanisation takes place will disproportionately affect both the economy and climate. Globally, $3 tn could be saved through 2030 by developing more compact, connected, and coordinated cities.
  • #8 To summarise – what are the key elements?
  • #9 UPDATED GRAPH (10 December 2014) Comparing Atlanta and Barcelona demonstrates what is possible through compact, coordinated, and connected urban development. Uncoordinated sprawl leads to higher costs of infrastructure, public service delivery, and transport. Urban sprawl in the US alone adds about $400bn per year. Compact, connected urban development – higher densities, mixed-use neighbourhoods, and walkable/transit-oriented environments – can unlock more productive and climate-friendly cities.
  • #10 No underlying data
  • #12 Solar PV module prices have fallen 80% since 2008 and now cost half of what they did in 2010. At least 53 solar PV plants over 50 MW were operating by early 2014 in at least 13 countries; rooftop solar for homes is competitive with retail electricity prices in Australia, Brazil, Denmark, Germany, and Italy. Note: This chart shows indicative levelized costs for solar photovoltaics from 1990 to 2012, with the costs for the best utility-scale project in 2013-2014 indicated (Austin Energy in Texas). The precise level is indicative of typical costs for utility-scale projects in relatively sunny regions. Actual costs can vary up or down by at least 50% depending on solar resources, and even more with local cost of capital. Assuming 17% capacity factor, and 9.25% cost of capital.
  • #13 New materials have made wind turbines bigger, stronger, and more efficient. Today’s turbines produce more power per land area used and dollar invested. In 1990, wind power was 3-4x more expensive than fossil fuel electricity, but onshore wind is now on par with or lower than fossil fuels in Australia, Brazil, Mexico, South Africa, Turkey, and the US. Further innovations, such as digital technology that enables “smart wind” that can be more easily integrated into electric grids, make it even more feasible and attractive. Graph Source (tower added): http://www.forbes.com/sites/williampentland/2014/01/10/micro-windmills-may-one-day-power-your-smart-phone/
  • #14 This chart shows indicative levelized costs for solar photovoltaics from 1990 to 2012, with the costs for the best utility-scale project in 2013-2014 indicated (Austin Energy in Texas). The precise level is indicative of typical costs for utility-scale projects in relatively sunny regions. Actual costs can vary up or down by at least 50% depending on solar resources, and even more with local cost of capital. Assuming 17% capacity factor, and 9.25% cost of capital.
  • #15 Nest (top left) is an intelligent thermostat that learns your schedule and adjusts heating and cooling accordingly. Since October 2011, Nests have saved 2 billion kWh. Google is also driving energy efficient data centres and operations – their data centres use 50% less energy than the typical one. They have invested over $1 billion in renewable energy projects and are pioneering autonomous vehicles. http://www.google.com/about/datacenters/efficiency/internal/#temperature http://www.google.com/about/datacenters/efficiency/internal/#water-and-cooling