Downloaded 219 times


![Glaucoma Overview of the pathology
Symptoms ofglaucoma
Glaucoma doesn't usually have any
symptoms to begin with and is often
only picked up during a routine eye
test.
Many people don't realise they
have it because it develops slowly
over many years and tends to cause a
loss of peripheral vision (the edge of
your vision) at first. Without
treatment, it can eventually lead to
blindness
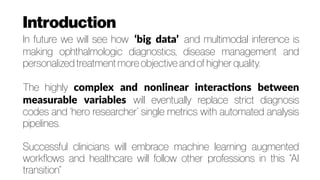
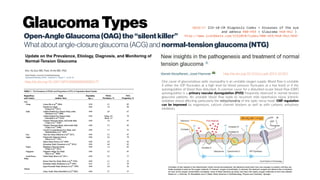
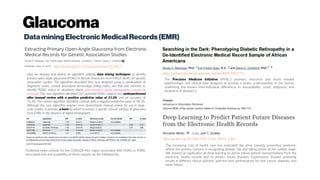
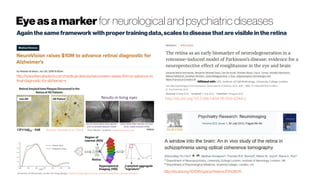
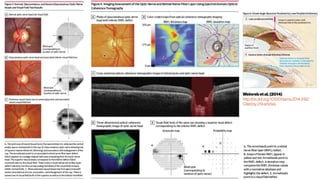
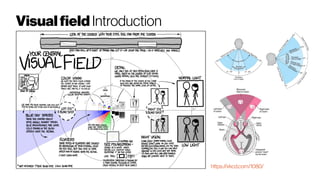
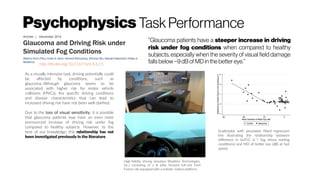
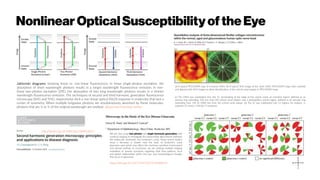
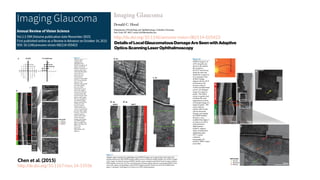
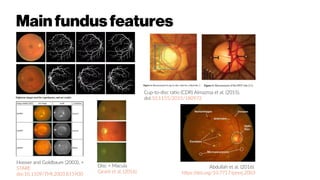
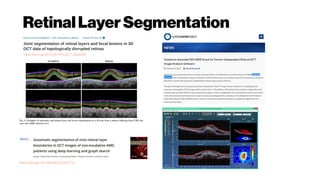
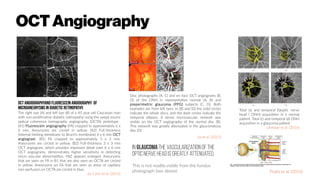
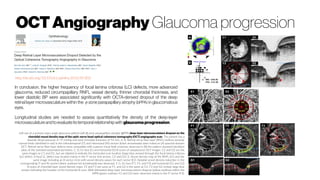
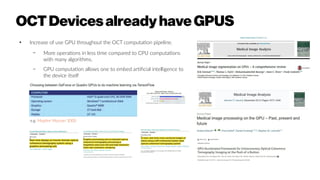
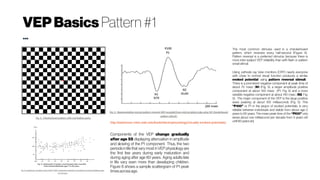
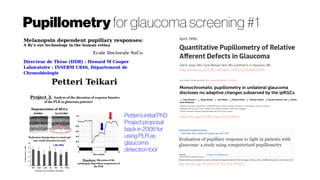
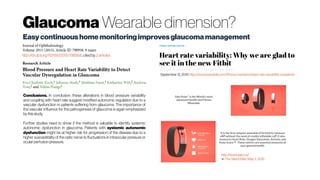
In glaucoma the vascularization of the
optic nerve head is greatly attenuated.
This is not readily visible from the fundus
photograph (left), whereas the OCT
angiography is a lot more expressive in
terms of distinguishing diseased retina
(PPG) from normal healthy retina
Jia et al. (2012).PPG-Pre-perimetricglaucoma
GlaucomaStatistics
UK
In England, about 480,000
people have chronic open-angle
glaucoma. [NERC]
USA
Over 4 million Americans have
glaucoma but only half of those
know they have it. [GRF]
WORLD
As the second most common cause of
blindness worldwide, Quigley and Broman
estimate that by 2020, 79.6 million people will
be inflicted with glaucoma worldwide, of
which 11.2 million will be predicted to be blind
bilaterally.2 There is no cost-effective
population-based screening program
available at present for detection of
glaucoma.1,4
GlaucomaCosts
UK
In 2008 sight loss cost at least £6.5 billion
[RNIB]
Eye health now accounts for 4.5m GP
consultations and costs the UK economy
£22bneach year. [gponline]
The mean cost of glaucoma treatment
over the lifetime of the patients was
£3001, with an annual mean cost per
patient of£475.[Rahmanet al. 2013]
USA
Glaucoma accounts for over 7 million
visitstophysicianseach year.
The cost to the U.S. government is
estimated to be over $1.5 billion annually.
[GRF]
In the USA, there is a fourfold increase in
average direct costs per patient (pp), with
the earliest stage of glaucoma costing US
$623pp (AUD $667/€482) and end stage
glaucoma/blindness costing US $2511pp
(AUD $2410/€1740). [Scheetz et al. 2016]](https://image.slidesharecdn.com/glaucomaoverview-170528154231/85/Glaucoma-4-320.jpg)


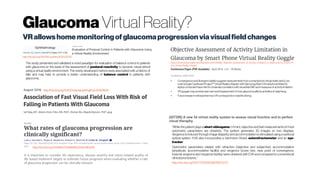
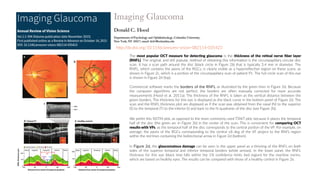
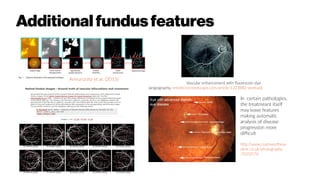
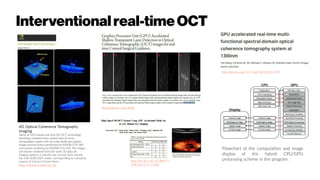
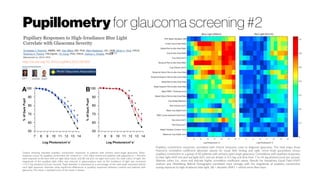
![Glaucoma
Geneticphenotype
Venturini, C; (2016) Doctoral thesis, UCL (University College
London).http://discovery.ucl.ac.uk/1474473/
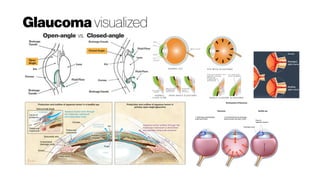
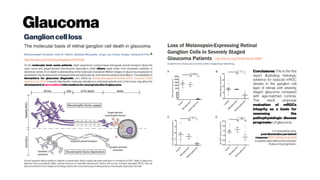
Weinreb et al.(2014): Several genes—including myocilin (MYOC, GLC1A)
(CCDS1297.1), optineurin (OPTN, GLC1E) (CCDS7094.1) and WD repeat domain
(GLC1G) (CCDS4102.1) —are associated with a monogenic, autosomal dominant trait;
however, these genes account for less than 10% of all glaucoma cases. (
Kwon etal.2009) A growing number of studies use genome-wide scans to look for
glaucoma susceptibility loci. The CAV1/CAV2 (HGNC:1527/HGNC: 1528) locus on
7q34 may be associated with primary open-angle glaucoma in European-derived
populations. This finding has been replicated by independent studies. These genes
encode proteins (caveolins) involved in the generation and function of caveola, which
are invaginations of the cell membrane involved in cell signaling and endocytosis. The
CDKN2BAS(HGNC:34341)locus on 9p21was shown toberelatedtoglaucomariskin
multiplecohorts. (Wiggsetal.2012)
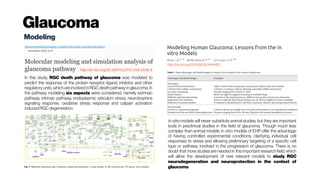
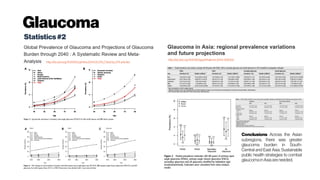
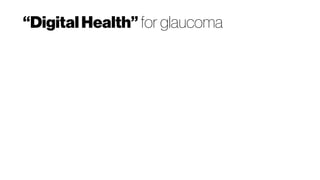
Retinal nerve fibre layer (RNFL)evaluation is a useful tool in early glaucoma diagnosis. Family history of
glaucoma is a risk factor for thinner RNFL. RNFL thickness has also been investigated as a possible bio-
marker in variousneurological conditions.
Interestingly, visual impairment is one of the earliest complaints in AD (Alzheimer’s Disease)
patients (Valenti 2010). Visual functions such as contrast sensitivity in lower spatial frequency, motion
perception, visual field and colour discrimination decreased in AD, showing a similarity with the visual deficits
in glaucoma. Patients with AD and glaucoma show a more rapid and aggressive glaucomatous visual field
loss (Bayer & Ferrari 2002). Both AD and glaucoma affect the visual pathway, but start in different
region along the neural pathway. AD might start in the visual association area (McKee et al. 2006) whereas
glaucoma has its initial damage in the optic nerve. In addition, AD treatments have been shown to have
animpact on glaucoma.
ChEI (cholinesterase inhibitors) treatment, commonly prescribed for AD, lowers IOP and seems to be
protective for retinal ganglion cells (Estermann et al. 20066). Memantine is a neuroprotective drug for AD
and also have implications for the visual system. Memantine has been investigated also for the treatment of
glaucoma and in monkeys with glaucoma and it slows down the progression of cell loss in lateral geniculate
nucleus(LGN)compared withthose animalsnot treated (Yücel et al. 2006).
Epidemiological studies have shown the link between the two diseases. Two groups whose 112 with AD
and 774 without have been compared and 25.9% of the people with AD developed also glaucoma, but only
5.2% of the group without AD (Bayer et al. 2002). Loss of nerve fibre layer tissue in the retina and optic nerve
may be an early biomarker for AD and may appear even before any hippocampus damage, which
isthe brainstructurethat impacts memory(Valenti2011).
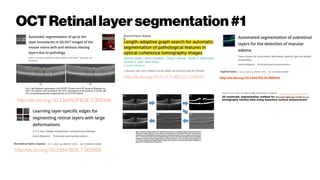
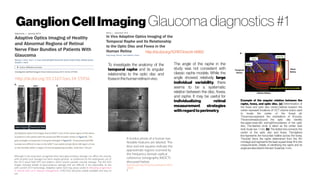
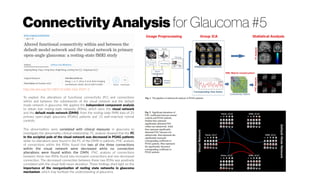
A study funded by the National Eye Institute (NEI) has discovered 3
more genes associated with primary open-angle glaucoma (POAG),
the most common type of glaucoma and a leading cause of blindness
worldwide (Bailey JC et al. Nature Gen. doi:10.1038/ng.3482
[published online January 11, 2016]). Previously, 12 genes have been
linked to glaucoma, which damages the optic nerve due to the
buildup of fluid and pressure in the eye.
http://dx.doi.org/10.1001/jama.2016.0559](https://image.slidesharecdn.com/glaucomaoverview-170528154231/85/Glaucoma-14-320.jpg)
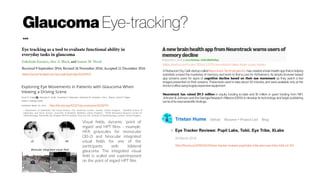
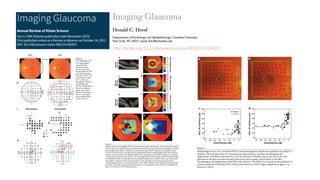
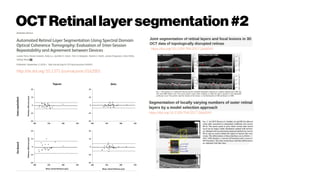
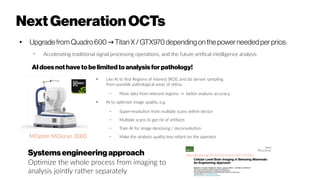
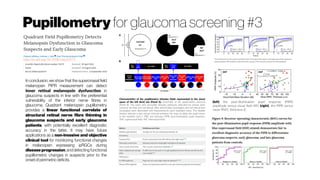
![Glaucoma
Amyloid-binvolvementandconnectiontootherneurodegenerativediseases#1
http://dx.doi.org/10.1007/s00018-016-2348-1
http://dx.doi.org/10.1007/s00018-016-2295-x
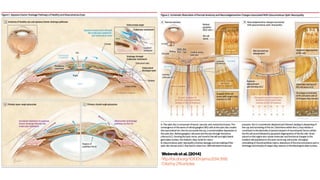
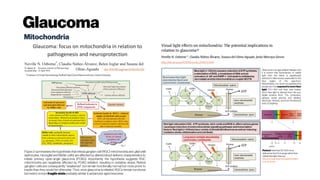
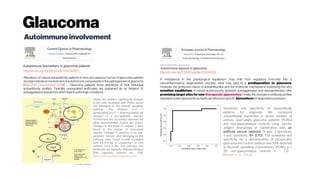
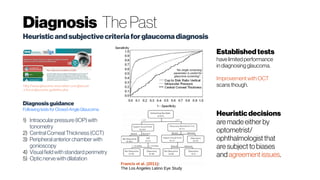
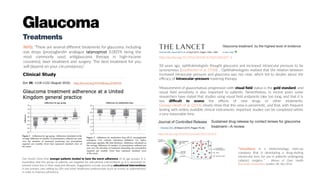
The retina arises as a neuro-ectodermal derivative of the forebrain duringdevelopment
and delineates several physiological, cellular and biochemical similarities with the brain
tissue. With the advancement in technology, subtle changes in both human and animal
retinas can be directly imaged and assessed in vivo and as such the retina is being
increasingly used as a model to study the neurodegenerative disorders of brain
particularly Alzheimer’s disease (AD, Guptaet al. 2016). Additionally, retinal
disorders such as age-related macular degeneration (AMD) and glaucoma
are chronic neurodegenerative conditions that affect vari- ous retinal neurons and lead
toprogressive and irreversible lossofthe vision.
All three diseases are multifactorial with distinct pathological and clinical
manifestations even though age remains the common primary risk factor and
people with family history are at higher risk. Although AMD and glaucoma are not
classified as amyloidogenic diseases, the last decade has seen many animal and
human studies featuring evidence of progressive accumulation of amyloid beta
fragments in the retina (Guptaet al. 2014). Therefore, retinal Ab accumulation can be
regarded asacommon feature ofthese three separatedisorders
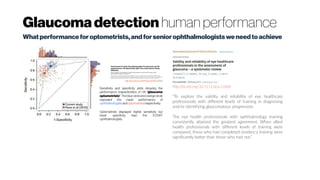
Analysing Ab characteristics including fragment size, oligomerisation and anatomical distribution within the retina holds ‘‘reasonable promise’’ to
provide unique retinal signatures and differentiate between various Ab associated disease conditions. For instance, AMD-associated Ab
deposition is more restricted to RPE and likely to be identified as complex with drusen (Anderson etal. 2004). In glaucoma, expression of Ab
could be found in the inner retina (Guo etal. 2007; Guptaetal. 2014)[5, 39] along with ON excavation. Retinal Ab deposition in AD is
geographically more wide spread and again associated with degenerative changes in the inner retina and ON (Gupta etal. 2016). Successful
identification of differences and similarities will drive drug development and mechanism based pathophysiological research.Imaging patterns of Ab
deposition in the eye could be of diagnostic and prognostic value when considered with other ocular or biochemical markers and play imperative
role in disease monitoring. Development of newer Ab imaging technologies will greatly accelerate research into mechanism based therapies
for these neurodegenerative disorders. Longitudinal studies in larger cohorts and rescue experiments will support the hypothesis that Ab
deposition does exert neurotoxic effects on the retina. Concluding, the significance of Ab depostion in mechanistic understanding of retinal
pathology, diseasediagnosis, prognosis or as a treatment target is highly relevant considering its known neurotoxic effects and the high incidenceof
thesediseasesinageing populations.
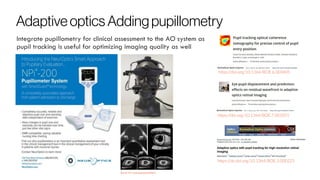
PhD Project: Multi-
spectral imaging for in
vivo imaging of oxygen
tension and β-amyloid
University Eye Clinic Maastricht](https://image.slidesharecdn.com/glaucomaoverview-170528154231/85/Glaucoma-19-320.jpg)
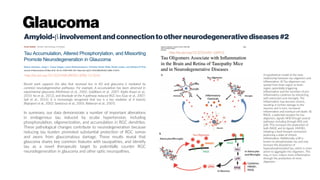


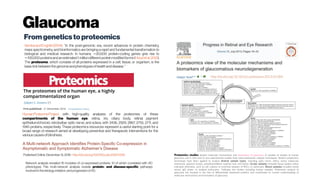
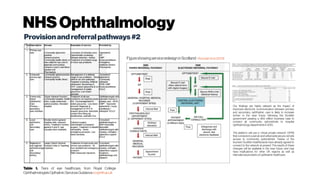
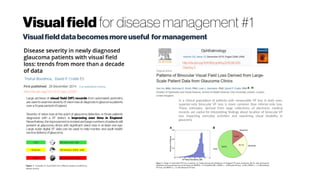
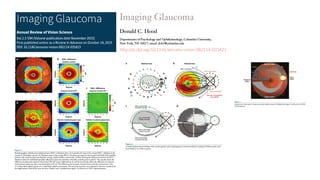
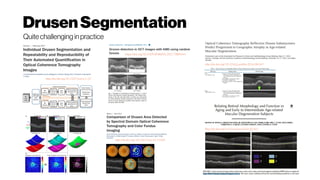
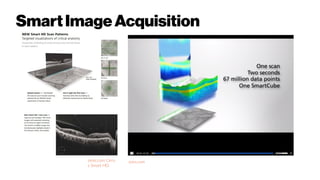
![NHSOphthalmology
Provisionandreferralpathways#1
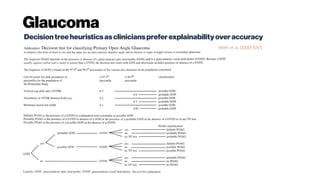
NHSOphthalmologycareprovisionandreferralpathways
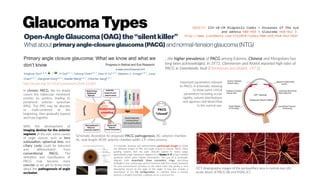
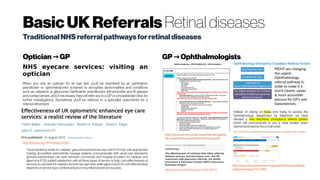
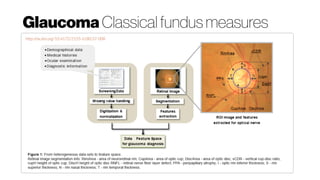
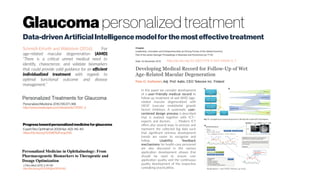
Recent guidance to the commissioners of eye care from the Royal College of Ophthalmologists has
outlined the need for improved non-specialist and out of hospital facilities for ophthalmology, as part
of aRight Care/QIPP vision of ‘hospital without walls’for ophthalmic care.1
Eye care flows from primary care (first presentation and basic conditions) to secondary care
(emergency or serious conditions requiring expert care). The primary care to specialist interface is a
keyorganisational taskfor manyhealth care systems.2
In the UK, Primary Care Ophthalmology is largely provided by optometrists 57% and GPs 43%.3 In
addition, the service is supported by GPs with special interest in ophthalmology (GPSI), a few
Ophthalmic Medical Practitioners (OMPs), Nurses and Nurse Practitioners and Orthoptists as well as
Ophthalmologists. Compared with other specialties, more primarycare in ophthalmology happensin
hospital rather than in general practice because of the lack of equipment, particularly slit lamps, and
lackof ophthalmicskillsand knowledge.4,5,6,7
Demand for ophthalmic services is increasing. From 2009 to 2010, there were 1.69 million first
attendances at English NHS ophthalmology departments, representing 28% of the total of 5.95
million ophthalmology attendances. [NHS information centre]. There has been a rise of 25% in
ophthalmology outpatients over 7 years and ophthalmology outpatients constitute 9% of all NHS
outpatientappointments(the second highest demand specialty).
Increasing detection and more expensive treatment of eye disease is stretching the NHS
ophthalmology budget and secondary care capacity is increasingly strained. To deal with this, the
RCO have proposed an emphasis on non-specialist, primary care ophthalmology to manage patient
flow and free capacity in the Hospital EyeService(HES).1,2
1) Stella Hornby.PrimaryCareOphthalmology –theRoyal CollegeofOphthalmologists. June2013.
2) Malik AN, Cassels-Brown A, Wormald R, Gray JM. Better valueeyecareforthe21stcentury: the population
approach. BritishJournal of Ophthalmology. 2013 Jan15:bjophthalmol-2012.
3) Pierscionek TJ, Moore JE, Pierscionek BK. Referralsto ophthalmology: optometric and general practice
comparison. Ophthalmicand Physiological Optics. 2009 Jan1;29(1):32-40.
4) Featherstone PI, James C, Hall MS, Williams A.General practitioners'confidenceindiagnosing and managing
eyeconditions: a surveyin south Devon.BrJGenPractice1992:42:21-
Summaryof reportfindingsfromRoyal Collegeof Ophthalmologists2013:
● Demographic changes and new treatments and investigations have caused
acute pressures and lack of capacity in secondary care (Hospital Eye Service
or HES).
● Managing the flow of new (as yet undiagnosed) patients to a department to
maximise potential to prevent sight loss but also to get maximum value for
money will become increasingly important in terms of the annual report and
budgetallocations.
● Many patients can be seen in the community if the necessary equipment is
available and increased value could be obtained by using community
optometrists to triage and manage GP referrals for external inflammatory
conditions.
● IT investment linking primary ophthalmic care and HES is key to achieving the
bestvaluemodelforophthalmiccare.
● Opportunistic surveillance for eye diseases such as glaucoma by optometrists
will prevent sight loss but the current provision does not provide equitable
access for everyone and poorer communities have lower take up of sight tests
andhigher ratesofvisualimpairment.
5) McDonnell PJ. Howdo general practitionersmanageeyediseaseinthecommunity? Br J Ophthalmol. 1988
Oct;72(10):733-6.
6) Sheldrick JH, Vernon SA, Wilson A, Read SJ. Demand incidenceand episoderatesof ophthalmicdisease in a
defined urban population. BrMedJ. 1992Oct17;305(6859):933-6.
7) Sheldrick JH, Wilson AD, Vernon SA, Sheldrick CM. Managementof ophthalmic diseaseingeneralpractice.. Br J
GenPract.1993 Nov;43(376):459-62.](https://image.slidesharecdn.com/glaucomaoverview-170528154231/85/Glaucoma-31-320.jpg)

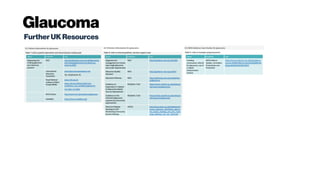
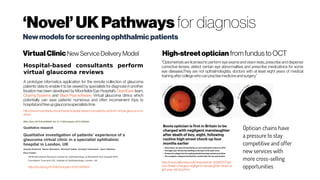


![Glaucoma Quality of Life
The quality-adjusted life year or quality-adjusted life-
year (QALY) is a generic measure of diseaseburden, including
both the quality and the quantity of life lived.[1][2] It is used in
economic evaluation to assess the value for money of medical
interventions. One QALY equates to one year in perfect health. If
an individual's health is below this maximum, QALYs are accrued
at a rate of less than 1 per year. To be dead is associated with 0
QALYs, and in some circumstances it is possible to accrue
negative QALYs to reflect health states deemed 'worse than
dead'.
The QALY is often used in cost-utilityanalysis in order to estimate the
cost-per-QALY associated with a health care intervention. This
incremental cost-effectivenessratio (ICER) can then be used toallocate
healthcare resources, often using a threshold approach.[3] In the
United Kingdom, the , which advises on the use of health technologies
within the National Health Service, has since at least 2013 used "£ per
QALY"toevaluate their utility.[4][5]
https://en.wikipedia.org/wiki/Quality-adjusted_life_year
http://dx.doi.org/10.1167/iovs.07-0559
Assessments of quality of life using different methodologies have been shown to produce different outcomes with low
intercorrelations between them. Only aminorityof patientswere prepared to trade time for areturn to normal vision. Conjoint
analysisshowed twosubgroupswith different priorities. Severityofglaucomainfluenced the relative importance of priorities.
http://dx.doi.org/10.1007/s12325-016-0333-6
The ultimate goal of glaucoma management is the preservation of patients’ visual function and quality of life
(QoL). The disease itself as well as the medical or surgical treatment can have an enormous impact on a
patient’s QoL. A better understanding of patient-reported QoL can improve patient–physician
interaction and enhance treatment adherence by customizing treatment options based on individual
patientprofile,thusoptimizing long-termprognosis.
Assessment of QoL with a questionnaire has several limitations. QoL assessment is subjective: patients with
similar disability may rate their QoL differently. An inherent limitation of QoL assessment is that self-reported
visual ability evaluated by any questionnaire can be impaired, at least to some extent, by other visual and
systemic morbidity or psychosocial constraints. Conceivably, even when perimetric indices such as MD are
comparable, different determinants such as spatial distribution and depth of VF scotomas or speed of
perimetricdeteriorationmayaffectpatientswithdissimilarlifestylesandexpectations](https://image.slidesharecdn.com/glaucomaoverview-170528154231/85/Glaucoma-42-320.jpg)


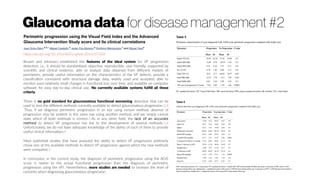
![Glaucoma Health Economics Intro #2
[Scheetz et al. 2016]: The burden of glaucoma increases as disease severity
worsens; especially the financial burden. In the USA, there is a fourfold
increase in average direct costs per patient (pp), with the earliest stage of
glaucoma costing US $623pp and end stage glaucoma/blindness costing
US $2511pp (Lee et al. 2006). There have been similar findings in Europe with
early stages of glaucoma having direct costs of US $588pp and end stage
costing US $1253 per person per year (Traverso et al. 2005).
The indirect costs of glaucoma can be difficult to quantify. In Australia, the
prevalence of POAG in 2005 was 208,000 and is expected to rise to 379,000
by 2025 (Dirani et al. 2011). This increase will see the total estimated costs of
treating those with POAG (healthcare costs, indirect costs such as loss of
productivity and loss of well-being measured as disability adjusted life years
rise from US $1.77 billion in 2005 to US $4.01 billion in 2025 (
Dirani et al. 2011).
A European study by Poulsen estimates the average cost per person for
community services (including equipment, residential care, household and
guide dogs) to be US $7885 and patient and family (household and
transportation) to be US $11,149 annually (Poulsen et al. 2005).
These increases in prevalence pose a significant burden on eye healthcare
professionals; especially ophthalmologists as a large number of patients are
unable to be discharged as the condition will require lifelong monitoring and
treatment (Spry et al. 1999).](https://image.slidesharecdn.com/glaucomaoverview-170528154231/85/Glaucoma-47-320.jpg)
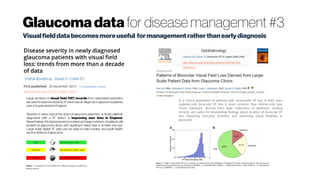
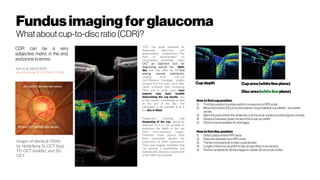
![Blindness Health Economics Ireland
http://dx.doi.org/10.1155/2016/4691276
The direct costs of visual impairment and blindness in the Republic of Ireland have
previously been calculated by Deloitte Access Economics (DAE) [3]. It was estimated that in
2010 the total direct costs (hospital, prescription, general ophthalmic services, and capital and
noncapital expenditure costs) of treating visual impairment as a whole were 116,754,168. This
was projected to increase to 127.4 million in 2015 and reach 136.8 million in 2020. The
proportion of these costs that could be attributed specifically to blindness was not analysed.
Sensitivity analysis 2010–
2020. The table illustrates the
upper (+20%) and lower (−20%)
limits around each point
estimate. For informal care
costs, 21.79 (average hourly
wage in 2010) is used as the
higher estimate and 8.65
(minimum hourly wage in 2010)
is used as the lower estimate of
the cost per hour of informal
care provided. The effect of
reducing deadweight welfare
losses to 9% gives the lower
estimate for this parameter. This
table thus provides a range and
a mean or “likely” figure for the
costs associated with blindness.](https://image.slidesharecdn.com/glaucomaoverview-170528154231/85/Glaucoma-48-320.jpg)


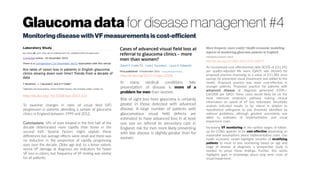
![Glaucoma Health Economics USA#3
http://dx.doi.org/10.1097/IJG.0b013e3180575202
The highest category of baseline IOP (>35 mm Hg) was
associated with the highest costs, especially in the United
States [US$11,409 in the United States and 3670€ (US$4341)
inEurope].
Although these studies examined cost by stage of disease,
cost per person-year could be estimated in each country as
follows: France 497€ (US$588), Germany 669€ (US$791),
Italy 417€ (US$493), the UK 660€ (US$781), and the US $1659
(1402€). Although a direct comparison of these estimates to
other published studies is not possible due to methodological
differences, several studies have shown the notable impact that
glaucomamanagementcosthasonhealthcareresources.](https://image.slidesharecdn.com/glaucomaoverview-170528154231/85/Glaucoma-61-320.jpg)


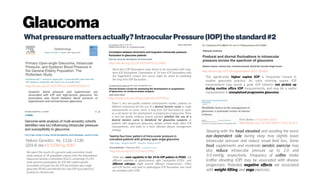
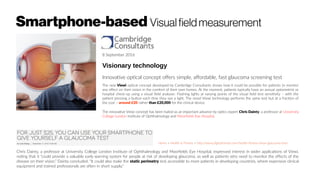
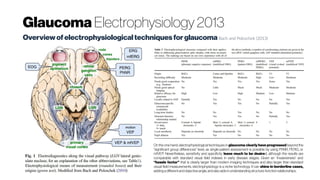
![IOP
Whatpressuremattersactually?IntraocularPressure(IOP)thestandard#1
Boucard et al. 2016: “The classic view of glaucomab
is that of an eye disease in which elevated intraocular pressure (IOP)
mechanically damages the optic nerve (ON) causing the death of retinal ganglion cells (RGCs). Indeed, in high-pressure glaucoma
(HPG, the most common form of glaucoma), RGC and ON damage are associated with an elevated IOP (>21 mmHg).[1]
However,
this view cannot be complete as glaucoma with normal levels of IOP is commonly reported as well. In such normal-pressure
glaucoma (NPG), damage occurs to the ON without the eye pressure exceeding the normal range. By definition, NPG only differs
from HPG in that the IOP is consistently below 22 mmHG.[1]
Moreover, rather than being a disease restricted to the eye, damage
of the RCGs extends to the axons that form the primary visual pathways.c
https://www.youtube.com/watch?v=sgKeXb3PvBs
https://www.reviewofoptometry.com/article/the-dos-and-donts-of-measuring-iop](https://image.slidesharecdn.com/glaucomaoverview-170528154231/85/Glaucoma-66-320.jpg)
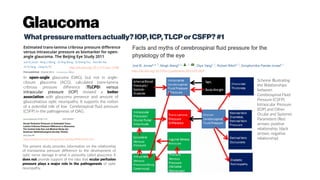
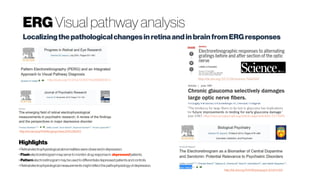
![Glaucoma
Whatpressuremattersactually?IOP,ICP,TLCPorCSFP?#2
http://dx.doi.org/10.1016/j.taml.2016.03.002 http://dx.doi.org/10.1097/WNO.0000000000000378
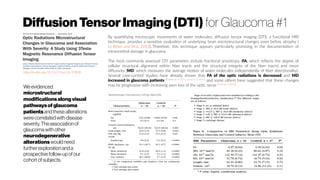
In the course of developing glaucoma, the difference between the
intraocular pressure (IOP) and the intracranial pressure (ICP) plays a key
role. It is this difference that exerts on the primary site of glaucoma—the
lamina cribrosa (LC), then results in the irreversible deformation of LC, and
finally induces the damage of the optic nerves passing through LC, thus
triggers the visual field defect, which is medically considered to be the main
pathological mechanism of glaucoma [2] and [3].
The relations
between IOP and
ICP. Thebroken line
standsfor Eq. (1), the
solid lineexpresses
Eq. (3), and different
figuratepoints
indicate the different
experimental data
from Refs. [6], [7], [8]
and [9].
http://dx.doi.org/10.1097/WNO.0000000000000295
The potential relationship between intracranial pressure (ICP) and glaucoma has
raised more questions to be answered. Published data are very suggestive that low
ICP is a risk factor for glaucoma. This may help explain the higher frequency of
glaucoma seen in older populations. Low ICP may, in part, explain normal tension
glaucoma. Low ICP may be responsible for the increased incidence of glaucoma
observed in patients with Normal pressure hydrocephalus (NPH). High ICP may be
protective in some patients with ocular hypertension. Structural alteration of the
lamina cribrosa (LC), has been documented with changes in the TPG. Distortion
and perhaps instability in LC structure may contribute to the development of
glaucoma. Other possible mechanisms include ICP-related alteration in axoplasm
and blood flow, which hypothetically could be primary or secondary to observed
structural changes. An association between ICP and glaucoma seems likely given
the present data, and further investigation of these associations is expected to
enhance our understanding of the pathophysiology of glaucoma.](https://image.slidesharecdn.com/glaucomaoverview-170528154231/85/Glaucoma-69-320.jpg)
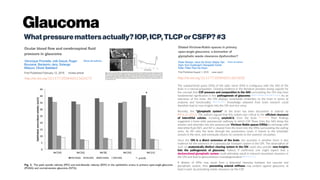

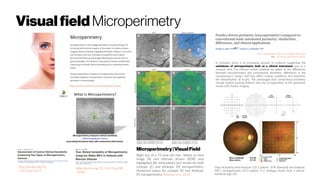
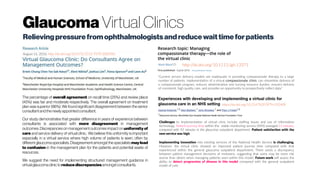
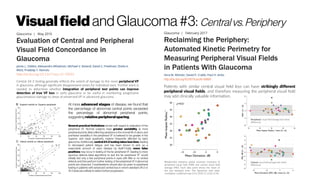
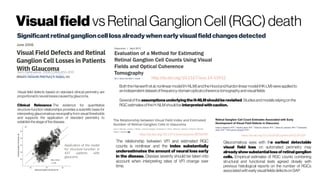
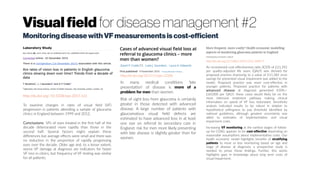
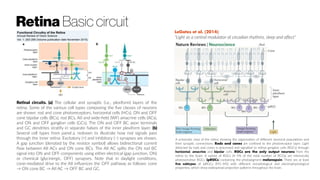
![Visualfield andGlaucoma#2
Lakkis(2014): “Approximately 40 per cent of ganglion cells
need to be lost before an early glaucomatous threshold
visual field defect is manifested (Quigleyetal.,1989,
Citedby 1096 ), and the typically slow progression in optic
nerve head changes makes structural glaucoma detection
difficultuntilsignificantrimtissueislost.”
http://dx.doi.org/10.1167/iovs.14-15577
Although previous studies have evaluated rates of change in monocular visual fields for monitoring
glaucoma, very little is known about rates of change in binocular visual fields (BVF). Recent
studies have shown that functional losses measured by BVFs show a better relationship with
patient-reported quality of vision compared with losses measured by monocular
fields. Therefore, evaluation of rates of change using BVFs could provide a better method for
assessmentoftherisk of functionalimpairmentin glaucoma.
In conclusion, our results demonstrated that the rate of change in BVFs was significantly faster
than that in the visual fields of the slower-changing eyes and slower than that in the visual fields of the
faster-changing eyes. Weexpect that our findings will have significant implications for studies related to
qualityoflife,monitoringofglaucoma, andprovidingtherapeutic guidance.
http://dx.doi.org/10.1371/journal.pone.0083595
A novel approach for simulating VFs is introduced. A better understanding
of VF variability will help clinicians to differentiate real VF progression
from measurement variability. Visual field variability leads to false-positive
diagnoses of progression when patients actually have stable glaucoma, which
may lead to needless treatment changes and costs to both patient and
healthcare provider [32]. Conversely, glaucomatous progression may be
missed if clinicians deem any change is due to inherent measurement noise.
This study highlights that, overall, MD variability increases as the level of
damage increases, but variability is highly dependent on the pattern of VF
damage. Future research, using VF simulations, could be employed to
provide benchmarks for measuring the performance of VF progression
detection algorithms and developing new strategies for measuring VF
progression.
http://dx.doi.org/10.1016/j.preteyeres.2016.10.001](https://image.slidesharecdn.com/glaucomaoverview-170528154231/85/Glaucoma-77-320.jpg)
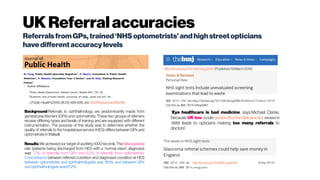
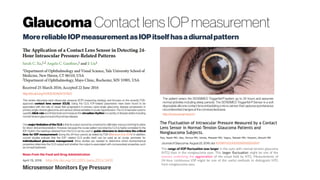
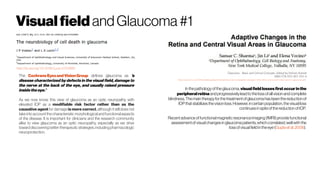
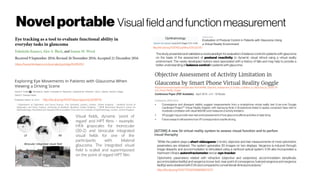
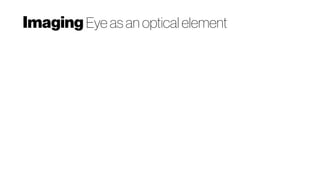
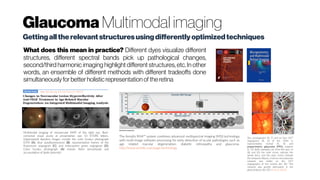
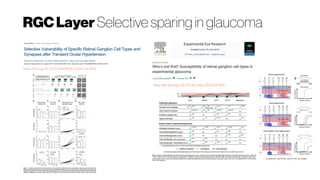
![Visualfield Sensitivityofmethods
https://www.ncbi.nlm.nih.gov/pubmed/10845599
To compare short-wavelength automated perimetry, frequency-doubling
technology perimetry, and motion-automated perimetry, each of which
assesses different aspects of visual function, in eyes with glaucomatous
optic neuropathy and ocular hypertension.
Conclusions. For detection of functional loss standard visual field testing is
not optimum; a combination of two or more tests may improve detection of
functional loss in these eyes; in an individual, the same retinal location is
damaged, regardless of visual function under test; glaucomatous optic
neuropathy identified on stereo photographs may precede currently
measurable function loss in some eyes; conversely, function loss with specific
tests may precede detection of abnormality by stereo photograph review; and
short-wavelength automated perimetry, frequency-doubling perimetry, and
motion-automated perimetry continue to show promise as early indicators
of function loss in glaucoma.
http://dx.doi.org/10.1371/journal.pone.0128681
Tests of temporal contrast sensitivity i.e. flicker perimetry have been used
in a battery of tests for glaucoma [6,19,23–24] and inspired the
development of the frequency doubling technology (FDT) perimeter [25].
Temporal contrast sensitivity is considered more resistant to the effects of
lens opacities [26–28]. Yet, it has been suggested recently that the high
temporal frequency stimuli in FDT render this more susceptible to reduced
retinal illumination when light is attenuated in opacified or older lenses [29].
A lack of spatial frequency dependent selective loss in glaucoma has been
described for gratings presented in the fovea both continuously [8,10] or
transiently [7,10] under both photopic and mesopic conditions [10].
These findings indicate that both spatial and temporal contrast sensitivity
tests are suitable for distinguishing between vision loss as a consequence of
glaucoma and vision loss caused by cataract only. The correlation between
glare factor and GPS suggests that there may be an increase in intraocular
stray light in glaucoma. Glare from excessive light scatter reduces retinal
image quality and manifests as a decrease in contrast sensitivity [68]. A
possible explanation for increased glare in subjects with glaucoma could be
the effect of cell shrinkage that has been found in experimental glaucoma [
69].](https://image.slidesharecdn.com/glaucomaoverview-170528154231/85/Glaucoma-79-320.jpg)
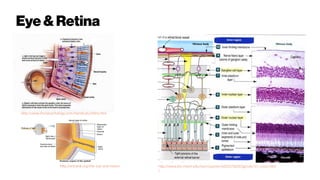
![Glaucoma data for disease management #1
http://dx.doi.org/10.1007/s40135-014-0038-4
A recent systematic review disclosed that in all Cochrane reviews and protocols related to glaucoma
interventions, visual field progression or change was reported in 13 different ways [1]. Moreover, it
is well known that there is only fair agreement among some of the various methods for the
determinationofvisualfieldprogression[2, 3, 4, 5].
Even the best of efforts to detect subtle progression can be confounded by factors including
suboptimal and variable patient reliability, progressive media opacity and the long-term fluctuation that
is an inherent aspect of visual psychophysics. Glaucoma experts themselves often disagree on the
determinationofprogressionwhen presentedwiththesameVFseries[6]..
In thisarticle, wewillreview someofthese majoradvances in ourunderstandingof fluctuationasa
confounding factor in thedetection of visualfield progression, theimportanceofmonitoring thecentral
visual field, the use of the size V stimulus in advanced glaucoma, novel enhancements of pointwise
linear regression analysis, frequency-doubling technology perimetry, the visual field index and the
concept of combining structural and functional assessments in the detection of glaucoma
progression.
In general terms, there are two broad approaches to the analysis
of visual field data that are used to detect progression: (1) event-
basedmethodsand(2)trend-basedmethods
Guided Progression Analysis (GPA; Carl Zeiss Meditec, Inc.,
Dublin, CA) is the most important example of an event-based
system in widespread clinical use. GPA uses essentially the
same criteria used to define progression in the Early Manifest
GlaucomaTrial(EMGT)[11].
Examplesof trend-basedanalyses includelinear regression
of the mean deviation (MD) or visual field index (VFI).
Regression analysis of MD, for example, relates visual function
to time by means of a straight-line equation, but is limited
because it does not distinguish between focal and diffuse
changefromeither glaucomaprogressionormediaopacity.
The detection of visual field progression continues to be a
challenging area of glaucoma management. Increasingly, it is
clear that rates of change are very important; therefore, the use of
trend-based analyses will likely be more heavily utilized in
conjunction with event-based methods. Of equal importance is the
concept that techniques that combine structural and
functional measures of progression are more powerful and yield
more accurate determinations of progression across a spectrum of
diseaseseverity.](https://image.slidesharecdn.com/glaucomaoverview-170528154231/85/Glaucoma-83-320.jpg)


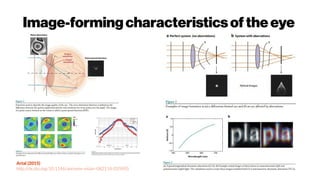

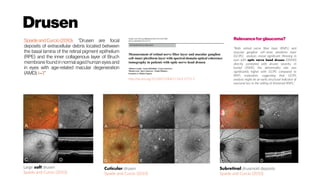


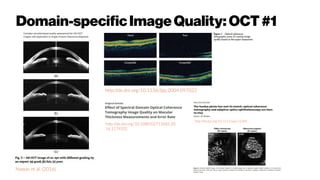

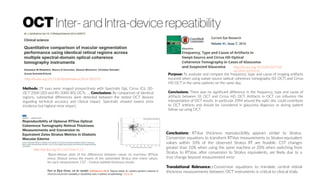


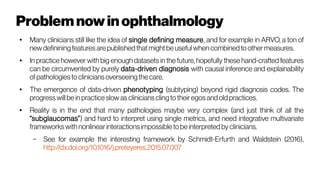
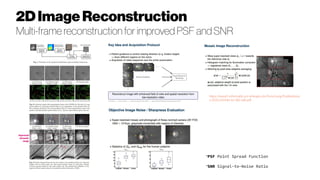
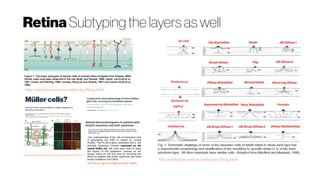
![Polarization-sensitiveOCT
Features of Retinal Pigment Epithelium (RPE) evaluated on PS-OCT.
Color fundus photographs (1a–4a); PS-OCT RPE thickness maps (1b–
4b); and PS-OCT RPE segmentation B-scans (1c–4c) corresponding to
the yellow horizontal lines in the en-face images. Images illustrate
examples of RPE atrophy ([1a–c], dashed white line); RPE thickening
([2a–c], yellow circle); RPE skip lesion ([3a–c], white arrow) and RPE
aggregations ([4a–c]: yellow arrows). Roberts et al. (2016)
Color fundus photography (a), late phase fluorescein angiography (b), PS-OCT
imaging (c–j), and conventional SD-OCT imaging (k–o) of the right eye of a patient
with subretinal fibrosis secondary to neovascular AMD. Roberts et al. (2016)b](https://image.slidesharecdn.com/glaucomaoverview-170528154231/85/Glaucoma-151-320.jpg)
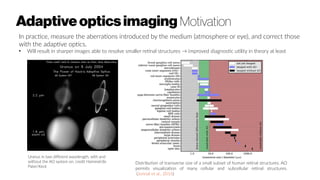
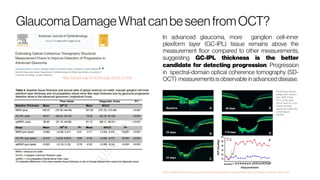
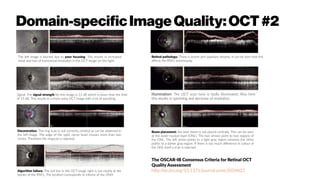
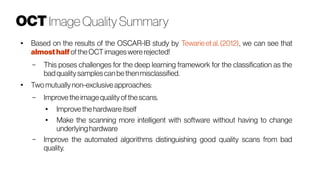
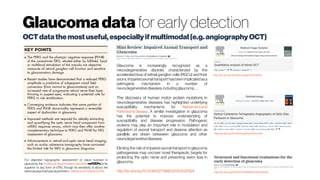
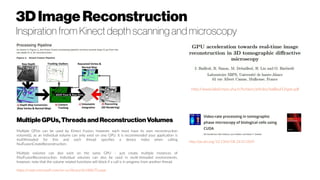
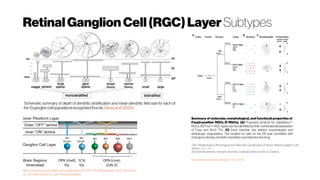
![Ganglion CellImaging Glaucoma diagnostics
http://dx.doi.org/10.1073/pnas.1613445114
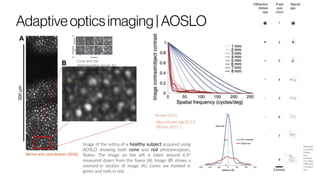
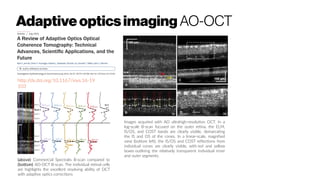
Here we show that the individual somas of neurons within the retinal ganglion cell (RGC) layer can
be imaged with a modification of confocal adaptive optics scanning light
ophthalmoscopy (AOSLO), in both monkeys and humans. Human images of RGC layer neurons
did not match the quality of monkey images for several reasons, including safety concerns that
limited the light levels permissible for human imaging.
Measurement of somal size in populations of RGC layer neurons may be advantageous for studying
glaucoma pathogenesis and response to treatment, as mean RGC area has been shown to decrease
in glaucoma before cell death (Weber et al. 1998). Subcellular resolution could also reveal in vivo the
substantial changes that subcellular structures undergo during apoptosis in glaucoma (
Quigley et al. 1995).
http://dx.doi.org/10.1016/j.exer.2015.06.001
In reviewing the application of these and other imaging modalities to study glaucomatous optic
neuropathy, this article is organized into three major sections: 1) imaging the optic nerve head, 2)
imaging the retinal nerve fiber layer and 3) imaging retinal ganglion cell soma and dendrites.
The article concludeswith abrief sectionon possible future directions.
http://dx.doi.org/10.1038/eye.2015.154
Ocular biomarkers of glaucoma Biomarkers are endogenous anatomic,
physiological, biochemical indicators that are associated with specific disease
states [Heaton et al. (2015); Bhattacharya et al. (2013); Agnifili et al. (2015)]. They
provide an objective measurement, via laboratory assays or imaging techniques,
to detect disease early and monitor therapeutic efficacy. The optimal biomarker is
specific, sensitive, and reproducible, as well as inexpensive and non-invasive. A
biomarker for glaucoma should indicate the rate of RGC loss and the number of
remaining or apoptotic RGCs with high sensitivity.](https://image.slidesharecdn.com/glaucomaoverview-170528154231/85/Glaucoma-159-320.jpg)


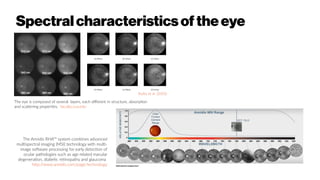
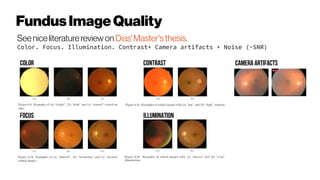
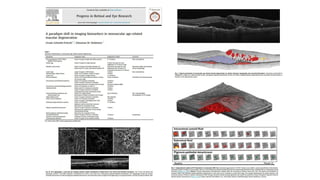
![Retina spectral characteristics
SPECTRAL PROPERTIES
Teikari thesis (2012)
Enezi et al. 2011.
Stockmann And Sharpe (2000), CVRL
Govardovskii et al. 2000
van de Kraats and van Norren 2007
Walraven 2003 CIE Report
“For environmental light”
“At retinal level
if you would not have
ocular media”
The absorbance spectrum of an exemplary vertebrate rhodopsin (lmax ~ 500
nm), considered as a sum of absorbance bands, indicated by alpha (a), beta (b),
gamma (g), sigma (s) and epsilon (e) normalized to the peak absorbance of the
alpha-band (after Stavenga and van Barneveld 1975, from Stavenga 2010).
The sidelobe on the
short-wave side come
from the beta band
(see template from
Govardovskii et al. 2000)
Self-screening effect changes the width/peak of the
absorption spectrum. (A) Percentage absorption spectra of various
concentrations of photopigment (OD - optical density in log units). (B) An
illustration of self-screening in at various photoreceptor lengths. Human rod
photoreceptor is ~25 mm, (Pugh and Lamb 2000) and the cone photoreceptor
13 mm (Baylor et al. 1984). The longest known photoreceptor has been found
in dragonfly, the length being 1,100 mm (Labhart and Nilsson 1995).
“Human crystalline lens
strongly absorb blue light
and UV”
V'(l) is the spectral sensitivity for night vision, and V(l) for
daytime vision. Not shown is mesopic vision VM(l) that is a
nonlinear combination of daytime and night vision operating on
dim light color vision.
Quantally defined daytime sensitivity
(2º central vision, Sharpe et al., 2005):
V*(l) = [1.891·l(l) + m(l)]/2.80361
Where l is long-wavelength ('red') cone sensitivity,
and m medium-wavelength (green) cone sensitivity
Note!
Melanopsin and
Scones do not seem
to contribute to
central vision
luminance perception
vs.
RGB Luminance
Stockman, A., & Sharpe, L. T. (2008).
Spectral sensitivity In The Senses: A
Comprehensive Reference, Volume 2:
Vision II (pp. 87-100)
Goodeve et al., 1942
Without the
crystalline
lens
(aphakic
eye), visual
sensitivity
would
extend to
ultraviolet](https://image.slidesharecdn.com/glaucomaoverview-170528154231/85/Glaucoma-191-320.jpg)

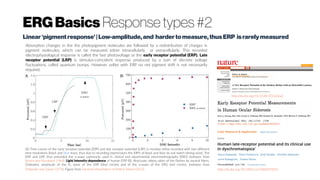
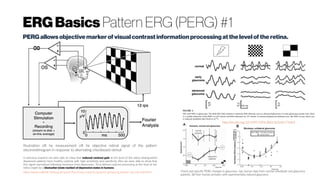
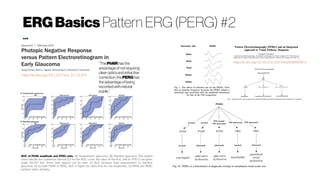
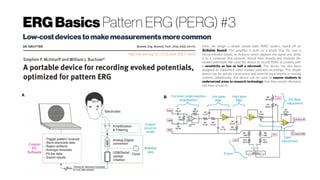
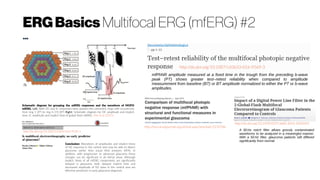
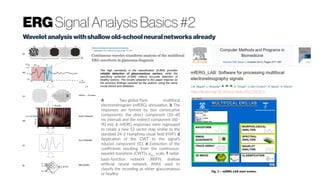
![ERGBasics Response types
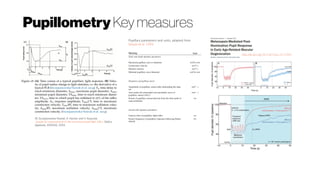
...
ERG Photopic Response. Two main components in ERG responses are the a-
wave and b-wave. The a-wave is the first negative wave and the b-wave is
the positive wave which directly follows the a-wave and usually has a high
positive amplitude. Both components are essential in ERG testing as they are
usually measured in amplitude and time to determine retinal status [6].
Following these two components, i-wave and photopic negative response
(PhNR) are also shown, however these two components are not always
present. The Oscillatory Potentials (OPs) are formed by the Amacrine cells in
the inner retina. They are the potentials following the b-wave, usually they are
at a higher frequency than all other ERG components and less in amplitude.
In conclusion, a-wave and b-wave have only been explored in time domain and their features are defined in
terms of amplitudes and implicit times. OPs are explored in the literature and are extracted by filtering the ERG
response. The exact definition of i-wave and PhNR noticeably varies in the literature, which makes the related
research to i-wave and PhNR very limited and this thesis will apply different processing methods that can help
make a contribution in the regard of PhNR and i-wave components. Frequency domain characteristics of ERG
components have not been explored in details. In Table 1, a summary of photopic ERG components is presented.
Alaql, Abdulrahman Mohammad, "Analysis and Processing of Human Electroretinogram" (2016).
Graduate Theses and Dissertations. http://scholarcommons.usf.edu/etd/6059](https://image.slidesharecdn.com/glaucomaoverview-170528154231/85/Glaucoma-196-320.jpg)
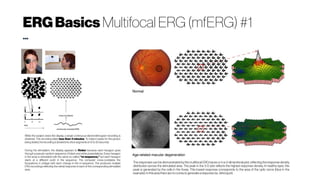
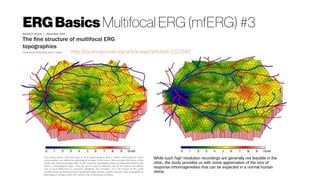
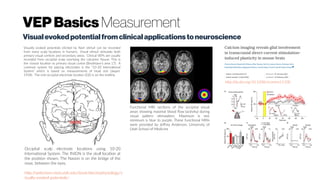
![ERGBasics mfERG ‘M-sequence’
...
http://dx.doi.org/10.1016/S0042-6989(01)00078-5
The multifocal m-sequence technique is a versatile set of tools for
visual electrophysiology designed to provide access to the complex
dynamic interplay of converging signals in the central nervous system. Here,
a number of uses for the technique are demonstrated, with examples from
humanelectroretinography.
The basic theory behind the multifocal m-sequence technique has
been previously presentedand versatile software and hardware tools for
many applications have been commercially available in the VERIS™
(Electrodiagnostic Imaging Inc., San Mateo, San Francisco, CA) for some
time. For many usersofthe technique,the representation of the resultsin the
formofbinarykernelshasbeen intimidating,an obstacle toprogressandthe
sourceofnumerousmisunderstandings.
http://dx.doi.org/10.1371/journal.pone.0169842
Directly determine how the response depends on different correlations in the input, an approach known as
nonlinear systems identification [2]. In this approach, the nonlinear response can be approximated to low order by
the second-order Wiener kernel of the system [2, 3], which is closely related to spike-triggered covariance (STC)
methods [4–9]. These second-order analyses have been used to characterize photoreceptors [11, 12], retinal
ganglion cells [6, 13–17], electroretinograms [31, 32], and functional magnetic resonance imaging [33, 34]
Calculating second-order filters can require trillions of mathematical operations per filter. To date, second-order
kernels have been extracted using standard libraries on central processing units (CPUs) [44]. In our own research,
we were computing and assessing the significance of second-order Wiener kernels for thousands of 2-photon
calcium imaging traces, each with more than 10,000 samples in time [22]. In order to speed up these
computations, we wrote code to extract response-weighted stimulus covariance matrices (Wiener kernels) using
GPUs. Our code speeds up such analyses by factors of over 100 relative to current methods that utilize central
processing units (CPUs). All data and code used in this paper are available at
https://github.com/ClarkLabCode/GPUFilterExtraction.
http://dx.doi.org/10.116/16.1.15](https://image.slidesharecdn.com/glaucomaoverview-170528154231/85/Glaucoma-205-320.jpg)
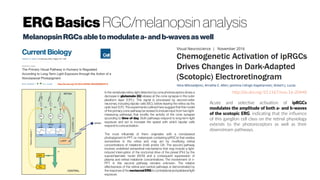
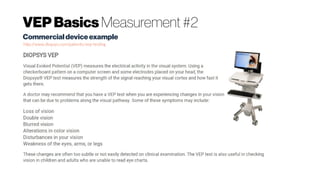


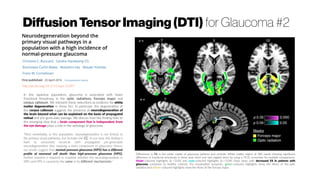
![Brainimaging for Visual Deficits
http://dx.doi.org/10.1111/opo.12293
Collectively, using MRI to investigate the effects on the visual pathway following
disease and dysfunction has revealed a rich pattern of results allowing for better
characterisation of disease. In the future MRI will likely play an important role in
assessing the impact of eye disease on the visual pathway and how it progresses over
time.
Approximately 20% of cortex in the human brain is dedicated
to visual processing, spanning the occipital lobe and extending
into temporal and parietal regions[1]
. MRI can reveal associated
changes in the brain, particularly in the visual pathways, to a
number of visual disorders, including anophthalmia, glaucoma
and age-related macular degeneration (AMD).
One of the earliest MRI studies in glaucoma was conducted
by Kashiwagi et al.,[48]
who found glaucoma patients (of either
primary open-angle or normal tension subtypes) had a
significant smaller optic nerve diameter and optic chiasm
height compared to healthy controls. More recent studies have
also shown smaller optic nerve and chiasm dimensions in both
primary open-angle glaucoma[49]
and normal tension subtypes.[50]
The LGN has also been shown to be smaller in glaucoma
patients using a similar method.[51
] These changes are predicted
on the basis of ganglion cell death, but evidence (reviewed
below) also indicates significant anatomical changes beyond the
LGN.
Another potential use for MRI techniques is as a screening method to guide medical
management, whereby cortical structural abnormalities could indicate the severity of visual
disease or indeed catch it in its earliest stages. Along these lines, a study by El-Rafei et al.[85]
attempted to define a detection mechanism within glaucoma using a classification system
constructed from DTI structural data in the optic radiations. The system was able to
discriminate between glaucoma patients and controls with 94.1% accuracy and between
normal-tension and open-angle glaucoma subtypes with 92.8% accuracy. This approach
therefore opens up the intriguing possibility of a high performance MRI detection system that
could accurately detect the presence of visual disease and possibly replace retinal-based
methodology.
However, El-Rafei did not report the severity of glaucoma patients used; structural differences
may only be capable of detecting severe cases, and may only be useful in confirming what
ophthalmological techniques had already established, although at a significantly higher
monetary cost. Indeed, very few glaucoma studies identified differences between healthy
controls and level 0 stage glaucoma (increased intra-ocular pressure but no visual loss), although
some did find structural differences between controls and level 1 (early-stage glaucoma).[55]
Therefore, while structural MRI may be suitable for assessing severity, it may be unsuitable for
early detection of visual diseases, at least for glaucoma.](https://image.slidesharecdn.com/glaucomaoverview-170528154231/85/Glaucoma-229-320.jpg)
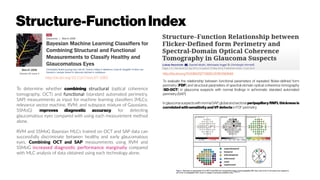
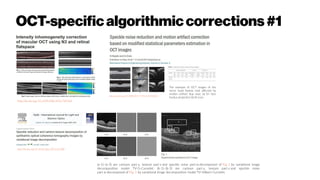
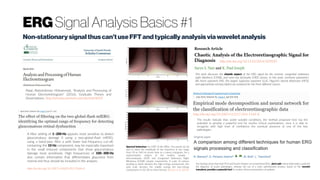
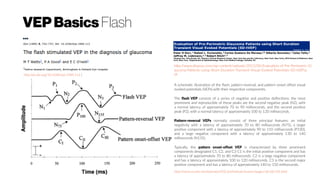
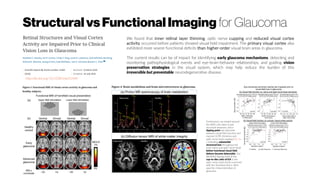
![Structural Imaging for Glaucoma #1
http://dx.doi.org/10.1371/journal.pone.0073208
POAG patients showed significant
bilateral cortical thinning in the
anterior half of the visual cortex
around the calcarine sulci (left BA 17
and BA 18, right BA17) and in some
smaller regions located in the left
middle temporal gyrus (BA37) and
fusiform gyrus (BA19). The thickness
of the visual cortex correlated
positively with RNFL thickness
Conclusion Our findings indicate that
cortical thickness analysis may be
sufficiently sensitive to detect cortical
alterations in POAG and that the
measurement has great potential for
clinical application.
Cortical thinning in POAG patients compare to normal controls.
Differences in cortical thickness are superimposed on a hemisphere-
unbiased iterative surface template. Color represents the regions of
cortical atrophy in patients with POAG.
Several MRI studies on the structural brain
changes that occur in POAG have used
voxel-based morphometry (VBM), which
provides a probabilistic measure of local
gray matter (GM) concentration[15]
. These
studies have demonstrated decreases or
increases in GM volume or density in POAG
in a number of different focal brain regions,
most consistently in the visual cortex[9–11,16]
.
However, results from other cortical
regions are inconsistent. For example, the
GM of the middle temporal gyrus was found
to be decreased[10]
, increased[11]
, or
unchanged[9]
. Measurement of cortical
thickness provides a more direct index of
cortical morphology that is less susceptible
to positional variance because the extraction
of the cortex adheres to the GM surface
despite local variations in position[17,18]
. To
the authors’ knowledge, no other study has
used cortical thickness analysis to assess the
human brain changes in POAG. Additionally,
it remains unclear whether the thickness of
visual cortex is correlated with RNFL
thickness in patients with POAG.](https://image.slidesharecdn.com/glaucomaoverview-170528154231/85/Glaucoma-231-320.jpg)
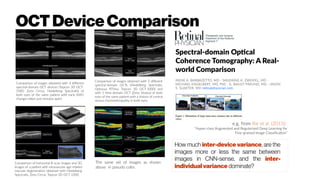
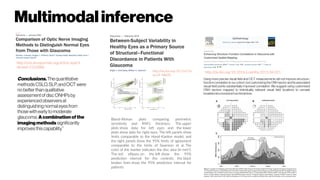
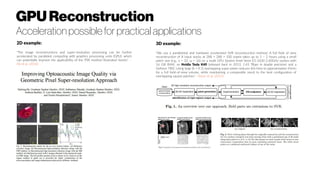
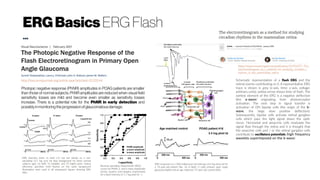
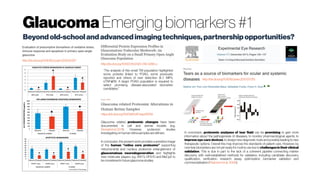
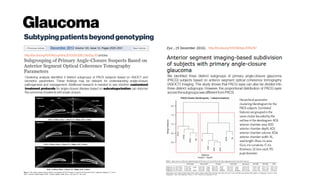
![ProtonMagneticResonance Spectroscopy for Glaucoma
http://dx.doi.org/10.1007/s00330-016-4279-5
Conclusion
Our findings show no significant alteration of metabolite
concentration associated with neurodegeneration that could be
measured by single-voxel 1H-MRS in optic radiation among
glaucoma patients.
Key Points
• Glaucoma disease has a neurodegenerative component.
• Metabolite changes have been observed in the
neurodegenerative process in the brain.
• Using Single-Voxel Spectroscopy (SVS), no metabolite changes
in optic radiation were attributed to glaucoma.
To the best of our knowledge, only a few studies on
the changes in metabolite concentrations in the
visual pathway related to glaucoma disease have been
previously published, and these studies demonstrated
various findings [16–19]
. Boucard et al. published the
earliest findings on metabolite changes in seven
glaucoma and seven age-related macular
degeneration patients compared with 12 healthy
subjects. They found no significant metabolite
changes for NAA/Cr, Cho/Cr, and Glx/Cr in the
occipital lobe of each subject using the single-voxel
1H-MRS technique [16]
.
By contrast, Doganay et al. studied single-voxel 1H-
MRS on the LGB and corpus vitreous of 29 glaucoma
patients and 13 healthy subjects [17]
. They found
statistically significant reduction of Glx/Cr ratio in
both vitreous body and LGB, but no metabolite
alteration in NAA/Cr and Cho/Cr ratios in the LGB.
Additionally, they found a lactate peak in the vitreous
body of 11 glaucoma patients.
In the most recent study conducted by Yan Zhang et
al., changes in metabolite concentration were found in
primary glaucoma using multi-voxel 1H-MRS at the
geniculocalcarine tract (GCT) and striate areas [18]
.
They studied 20 glaucoma patients who were age-
and gender-matched to 20 healthy volunteers.
Significant reductions in NAA/Cr and Cho/Cr were
found in the geniculocalcarine and striate areas of
glaucoma subjects compared with healthy subjects [18]
.
Using an experimental rat model, Kevin et al.
conducted a 1H-MRS study on glaucoma and found a
significant Cho/Cr reduction in the left visual cortex
side of induced glaucoma as compared with the right
side. No significant difference was observed in other
metabolites, including NAA and Glx [19]
.
Boxplot illustrating concentration ratios of tNAA, tCho, and Glx to
tCr for the healthy subjects and the mild and severe glaucoma
groups in terms of optic radiations (based on per-metabolite basis)](https://image.slidesharecdn.com/glaucomaoverview-170528154231/85/Glaucoma-235-320.jpg)
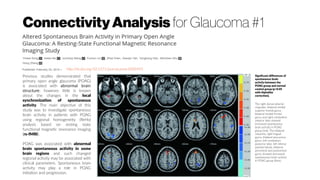
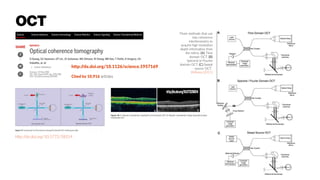
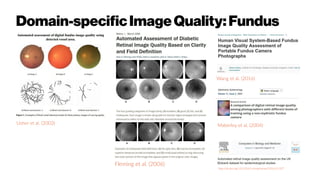
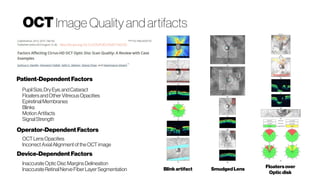
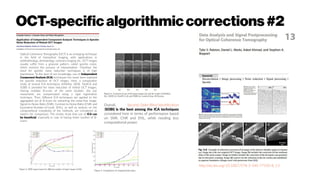
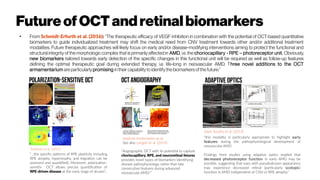
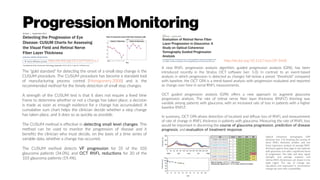
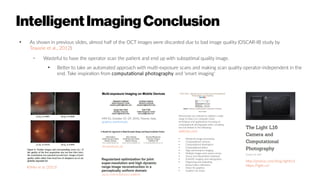
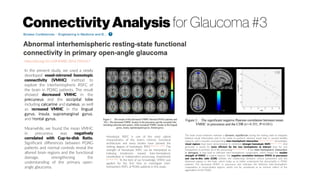
![ConnectivityAnalysis for Glaucoma #2a
http://dx.doi.org/10.1371/journal.pone.0141389
Using voxel-wise degree centrality (DC),
as measured by resting-state fMRI, we
aimed to study alterations in the brain
functional networks in patients with
primary angle-closure glaucoma (PACG)
and to reveal the plastic trajectories of
surgery.
Our results suggest that PACG may
contribute to decreased functional
centrality in the visual system and to
increased degree centrality in cognition-
emotional processing regions. Alterations
in visual areas seem to parallel the cup
to disc ratio, but not the duration of
angle closure. The changes of functional
centrality in PACG patients after
operation may reveal the plasticity or
degeneration of the visual-associated
brain areas. Our findings may provide
further understanding of the
pathophysiology of PACG.
Voxel-wise comparison of DC between Post- and Pre-PACG patients. Areas of
significant (p < 0.05, GRF corrected) DC difference between Post- and Pre-PACG
patients. Hot (cool) color represents higher (lower) DC in the Post-PACG group
compared with the Pre-PACG group. a) Axial view and b) DC values of significant
different clusters (left MOG and right cuneus and left precentral gyrus) between Post-
and Pre-PACG patients. Abbreviation: MOG, middle occipital gyrus.
Degree centrality (DC) can be considered the ability for information
integration, and high DC may serve as a hub for the traffic operation of
functional networks, superior information propagation and may thus
contribute to efficient information flow[23,37]
. In this framework, the decreased
DC of the bilateral visual cortices observed in our study may be an
expression of decreased visual sensory information input and degenerative
“hubness” associated with PACG. Vision loss or eye conditions related to
changes in cortical thickness[12,40,41]
, density, and volume[11,42,43]
have been
observed in humans associated with both POAG and blindness.
In addition to decreased DC in the visual cortex, we found significant
increased DC in the anterior cingulate cortex (ACC) and caudate. Because of
a lack of mood ratings, this finding suggests the necessity for assessing the
mood scale for use as covariates when investigating brain alterations in
glaucomatous populations, as previous research has suggested a higher
prevalence of anxiety and depression in primary glaucoma patients,
especially in PACG patients in China[52,53]
. The caudate, along with the
putamen and globus pallidus, makes up the basal ganglia and is implicated in a
range of functions, including the regulation of cortical excitability and sensory
processing[54]
. Glaucoma patients are frequently reported to have impaired
proprioception under somatosensory perturbations[55,56,57]
.
Interestingly, we tentatively examined the postoperative transformation of
DC to test the neuroplastic trajectories of surgery over 3 months and found
heightened DC in the visual cortex and primary sensory and
supplementary motor areas. This postoperative enhancement, accompanied
by postoperatively lower IOP and ease of symptoms, may indicate that the
postoperative plasticity of functional network centrality in the visual cortex
occurs and that this neuroplasticity underlies improved behaviors. Whereas
the glaucomatous changes in the visual pathway are generally considered
transsynaptic/anterograde degeneration[2,13]
, one possible explanation for
this result may be the restoration process. Carefully screening the patients,
we found six of the follow-up post-PACG patients had a sudden onset of
total angle closure; thus, there was not enough time to change profoundly.](https://image.slidesharecdn.com/glaucomaoverview-170528154231/85/Glaucoma-238-320.jpg)
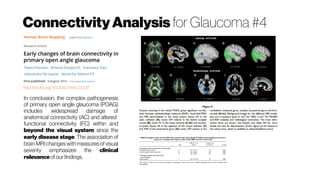
![ConnectivityAnalysis for Glaucoma #2b
http://dx.doi.org/10.1371/journal.pone.0170598
This study characterized the iFC of V1 in
patients with PACG. The primary findings
indicated decreased visual information
integration in the left V1-V2 pathway and
visual activity (VA)-related functional
compensation in multimodal processing and
visual-cognition regions in the pre-PACG
patients, generating further evidence of
functional restoration in post-PACG
patients.
These findings provide insight for increasing
the understanding of the underlying
pathological and compensatory mechanisms
in the central nervous system in PACG patients
beforeandaftersurgery.
In Asia and China, however, the most common type is primary angle-closure glaucoma (PACG) [1,
16,17], which is probably the leading cause of glaucomatous blindness in both eyes [16]. The pattern
of visual field loss tends to differ between PACG and POAG [18], for instance, the peripapillary
atrophy in PACG has a different relationship with the structural and functional optic disk changes
than that in POAG [19]. Compared with POAG, fewer retinal nerve fiber layer sectors have
significant structure-function correlations in PACG [20], suggesting differences in the
pathophysiology of optic nerve damage and even the whole visual pathway between PACG and
POAG. In patients with PACG, our group has reported decreased functional centrality in the visual
system and increased degree centrality (DC) in cognitive-emotional processing regions [21].
However, DC is a measure of the topology of the architecture of the brain functional connectome [
22], but it does not reflect the temporal correlation between spatially remote neurophysiological
events. Intrinsic functional connectivity (iFC) which is amenable to simple and straightforward
interpretation, allows for measurement of connectivity between brain regions that share functional
properties [23].](https://image.slidesharecdn.com/glaucomaoverview-170528154231/85/Glaucoma-239-320.jpg)


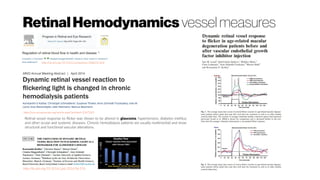
The document discusses glaucoma, a common cause of blindness, highlighting its symptoms, prevalence, and the challenges in diagnosis and treatment. It emphasizes the importance of early detection through regular screenings, particularly for those over 40, and notes the escalating costs associated with glaucoma care both in the UK and the USA. Additionally, it reviews factors affecting the disease's progression, potential genetic links, and the need for personalized treatment approaches.


