Download as PDF, PPTX

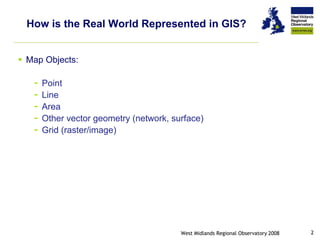
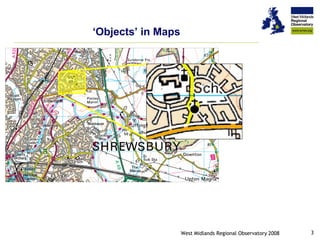
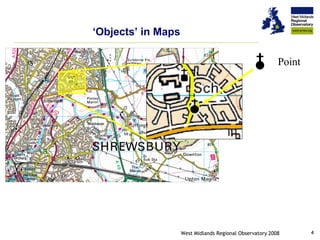
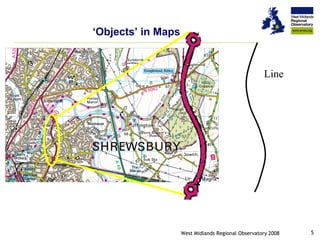
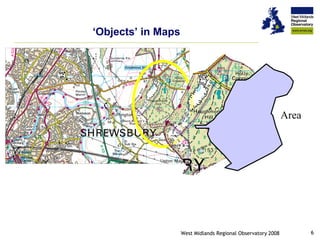
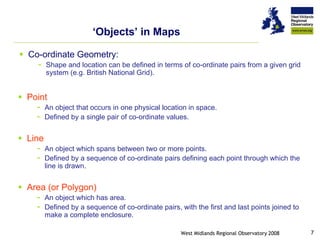
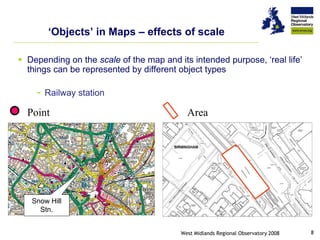
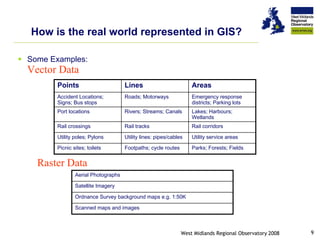

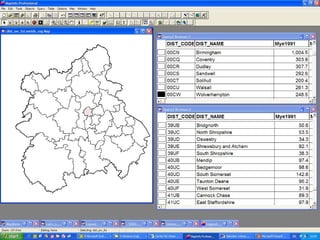
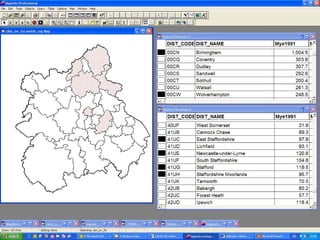


The document explains how the real world is represented in Geographic Information Systems (GIS) through various map objects, such as points, lines, and areas, and details their coordinate geometry. It discusses sources of data used in GIS, including satellite imagery and direct data capture methods, as well as the importance of linking existing data to GIS for effective analysis. The document also highlights the challenges in obtaining digital geographic data and the layering of GIS for enhanced display and analysis.