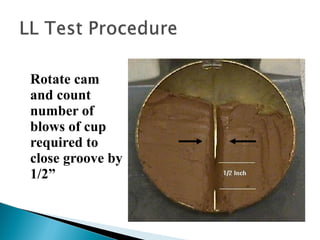
Downloaded 28 times


![20
Passing No.200 86%
LL=70, PI=32
LL-30=40 > PI=32
[ ]
3347.33
)10PI)(15F(01.0
)40LL(005.02.0)35F(GI
200
200
≅=
−−+
−+−=
Round off A-7-5(33)
Passing No.200 86%
LL=70, PI=32
LL-30=40 > PI=32](https://image.slidesharecdn.com/2-170517111602/85/Soil-classification-1-20-320.jpg)
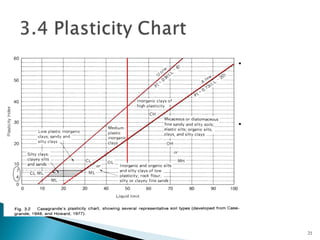

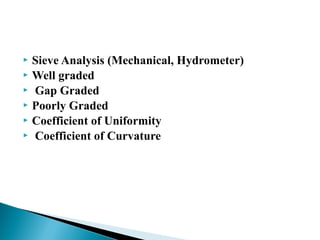
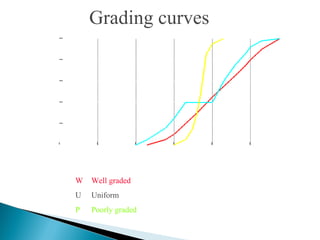
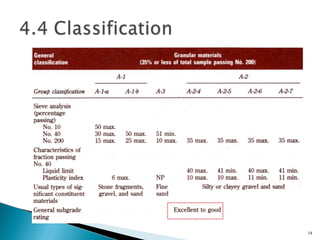
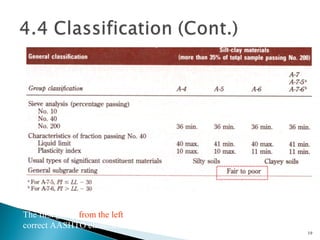
The document discusses various soil classification systems including engineering, agronomic, and geological classifications. It covers concepts such as particle size distribution curves, coefficients of uniformity and curvature, Atterberg limits, and classification charts used in systems like AASHTO and USCS to classify soils based on grain size and plasticity. The document also provides examples of classifying soils based on laboratory test results like sieve analyses, liquid limit, plastic limit, and natural water content.


![Geotechnical Engineering-I [Lec #11: USCS & AASHTO]](https://cdn.slidesharecdn.com/ss_thumbnails/11-180923183816-thumbnail.jpg?width=640&height=640&fit=bounds)