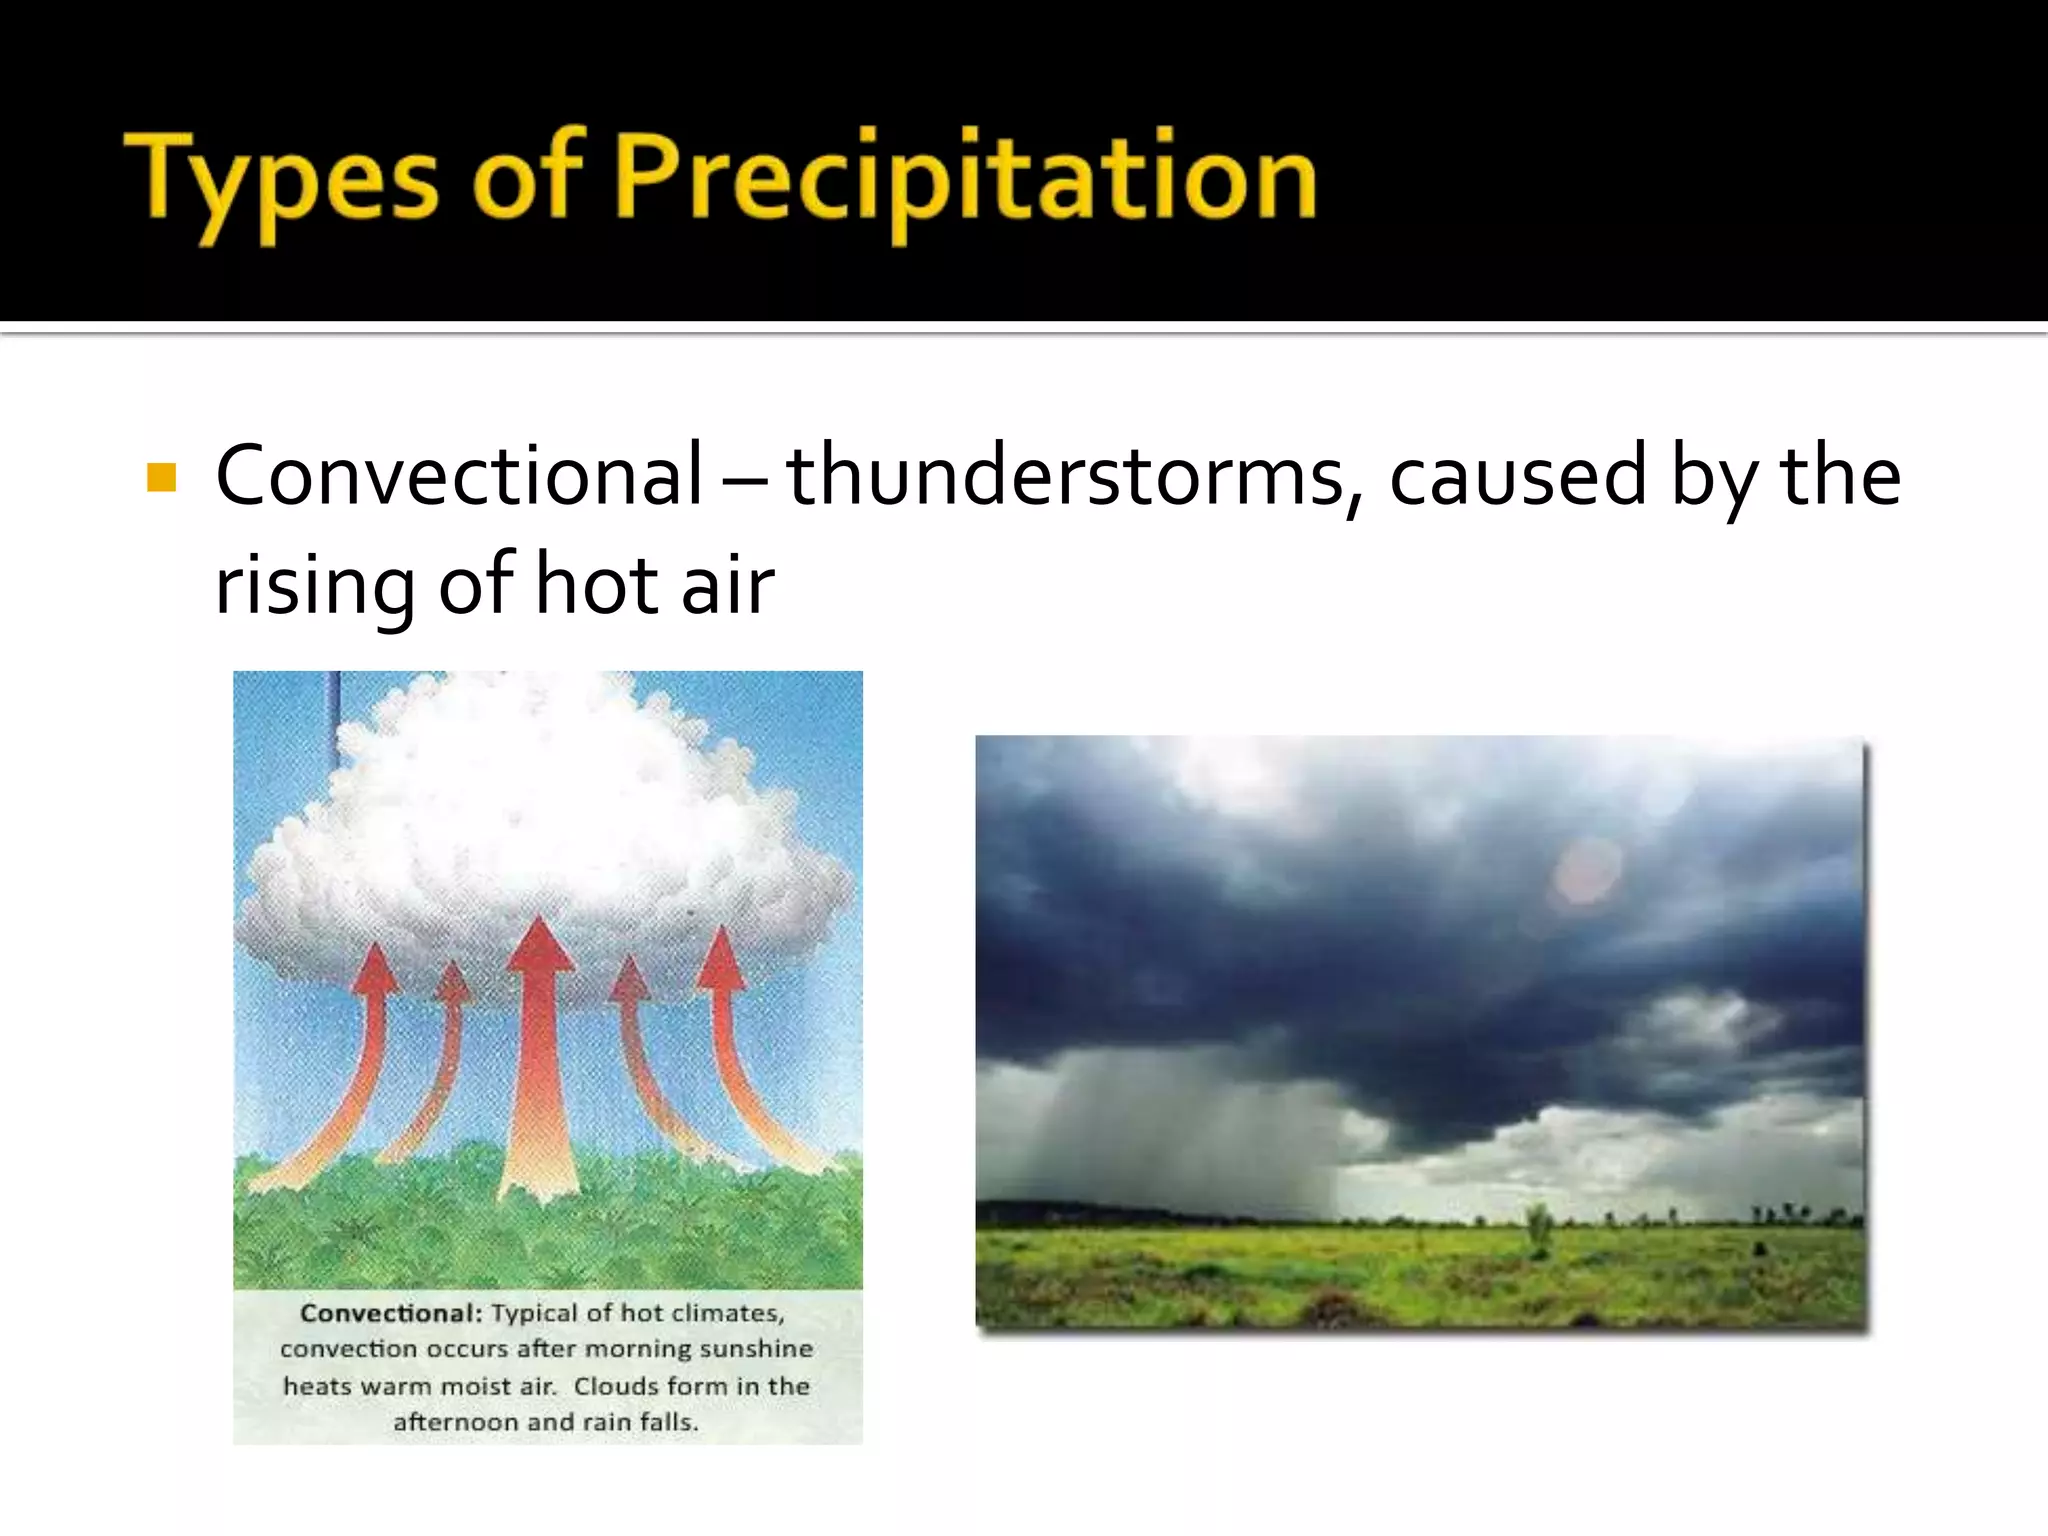
Downloaded 265 times
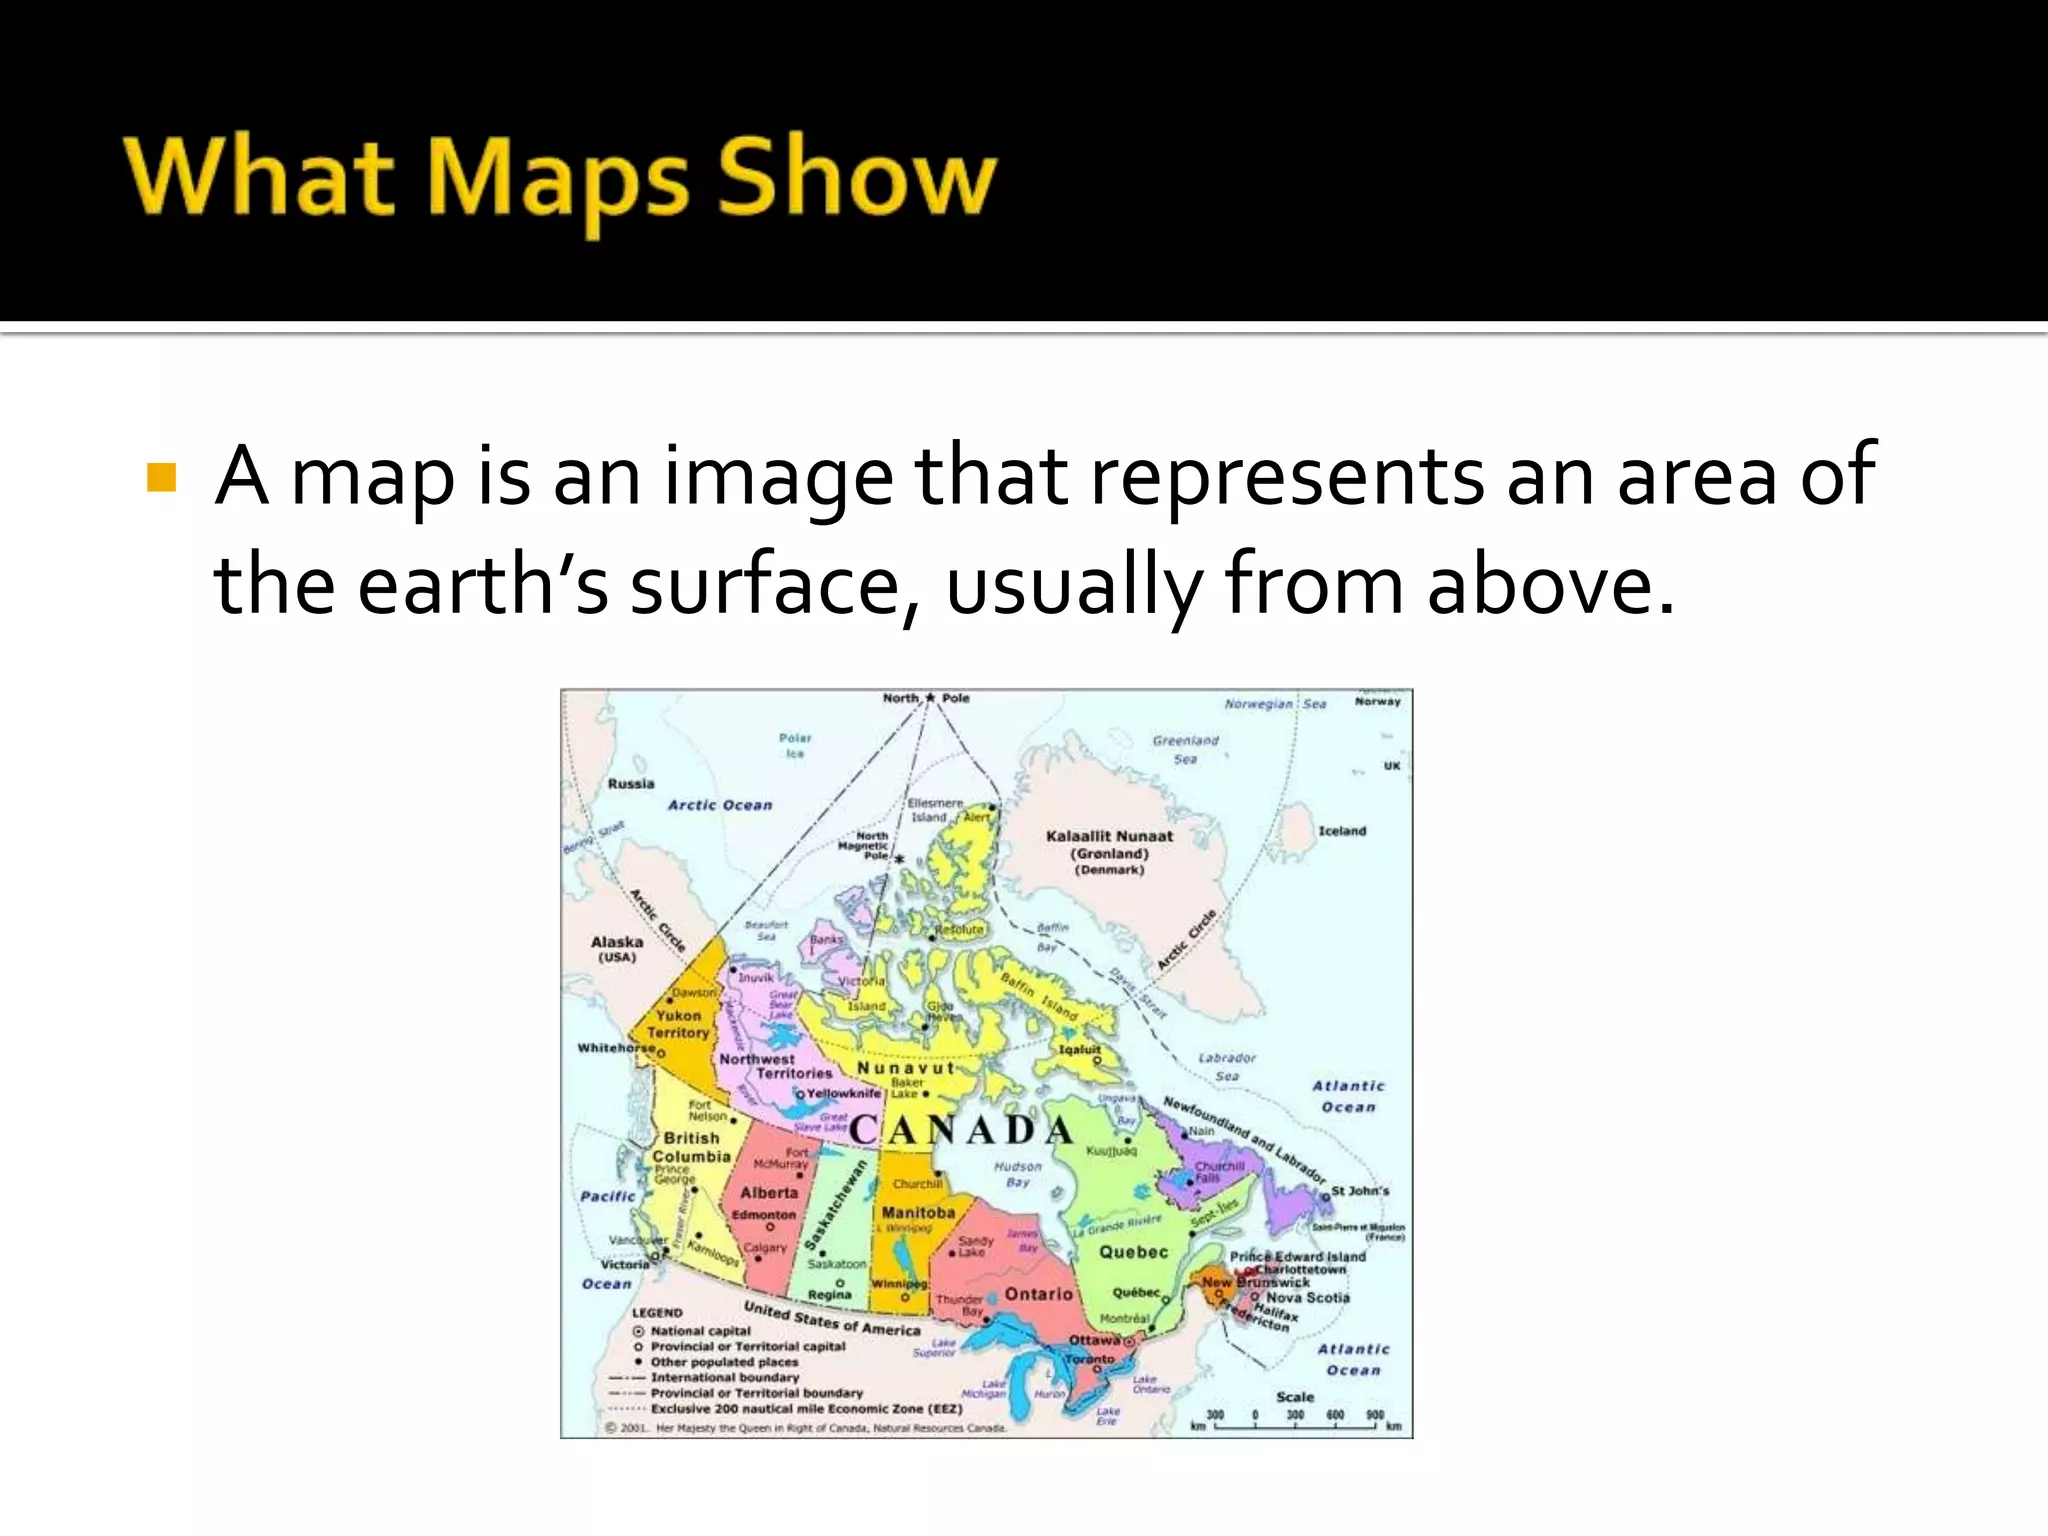
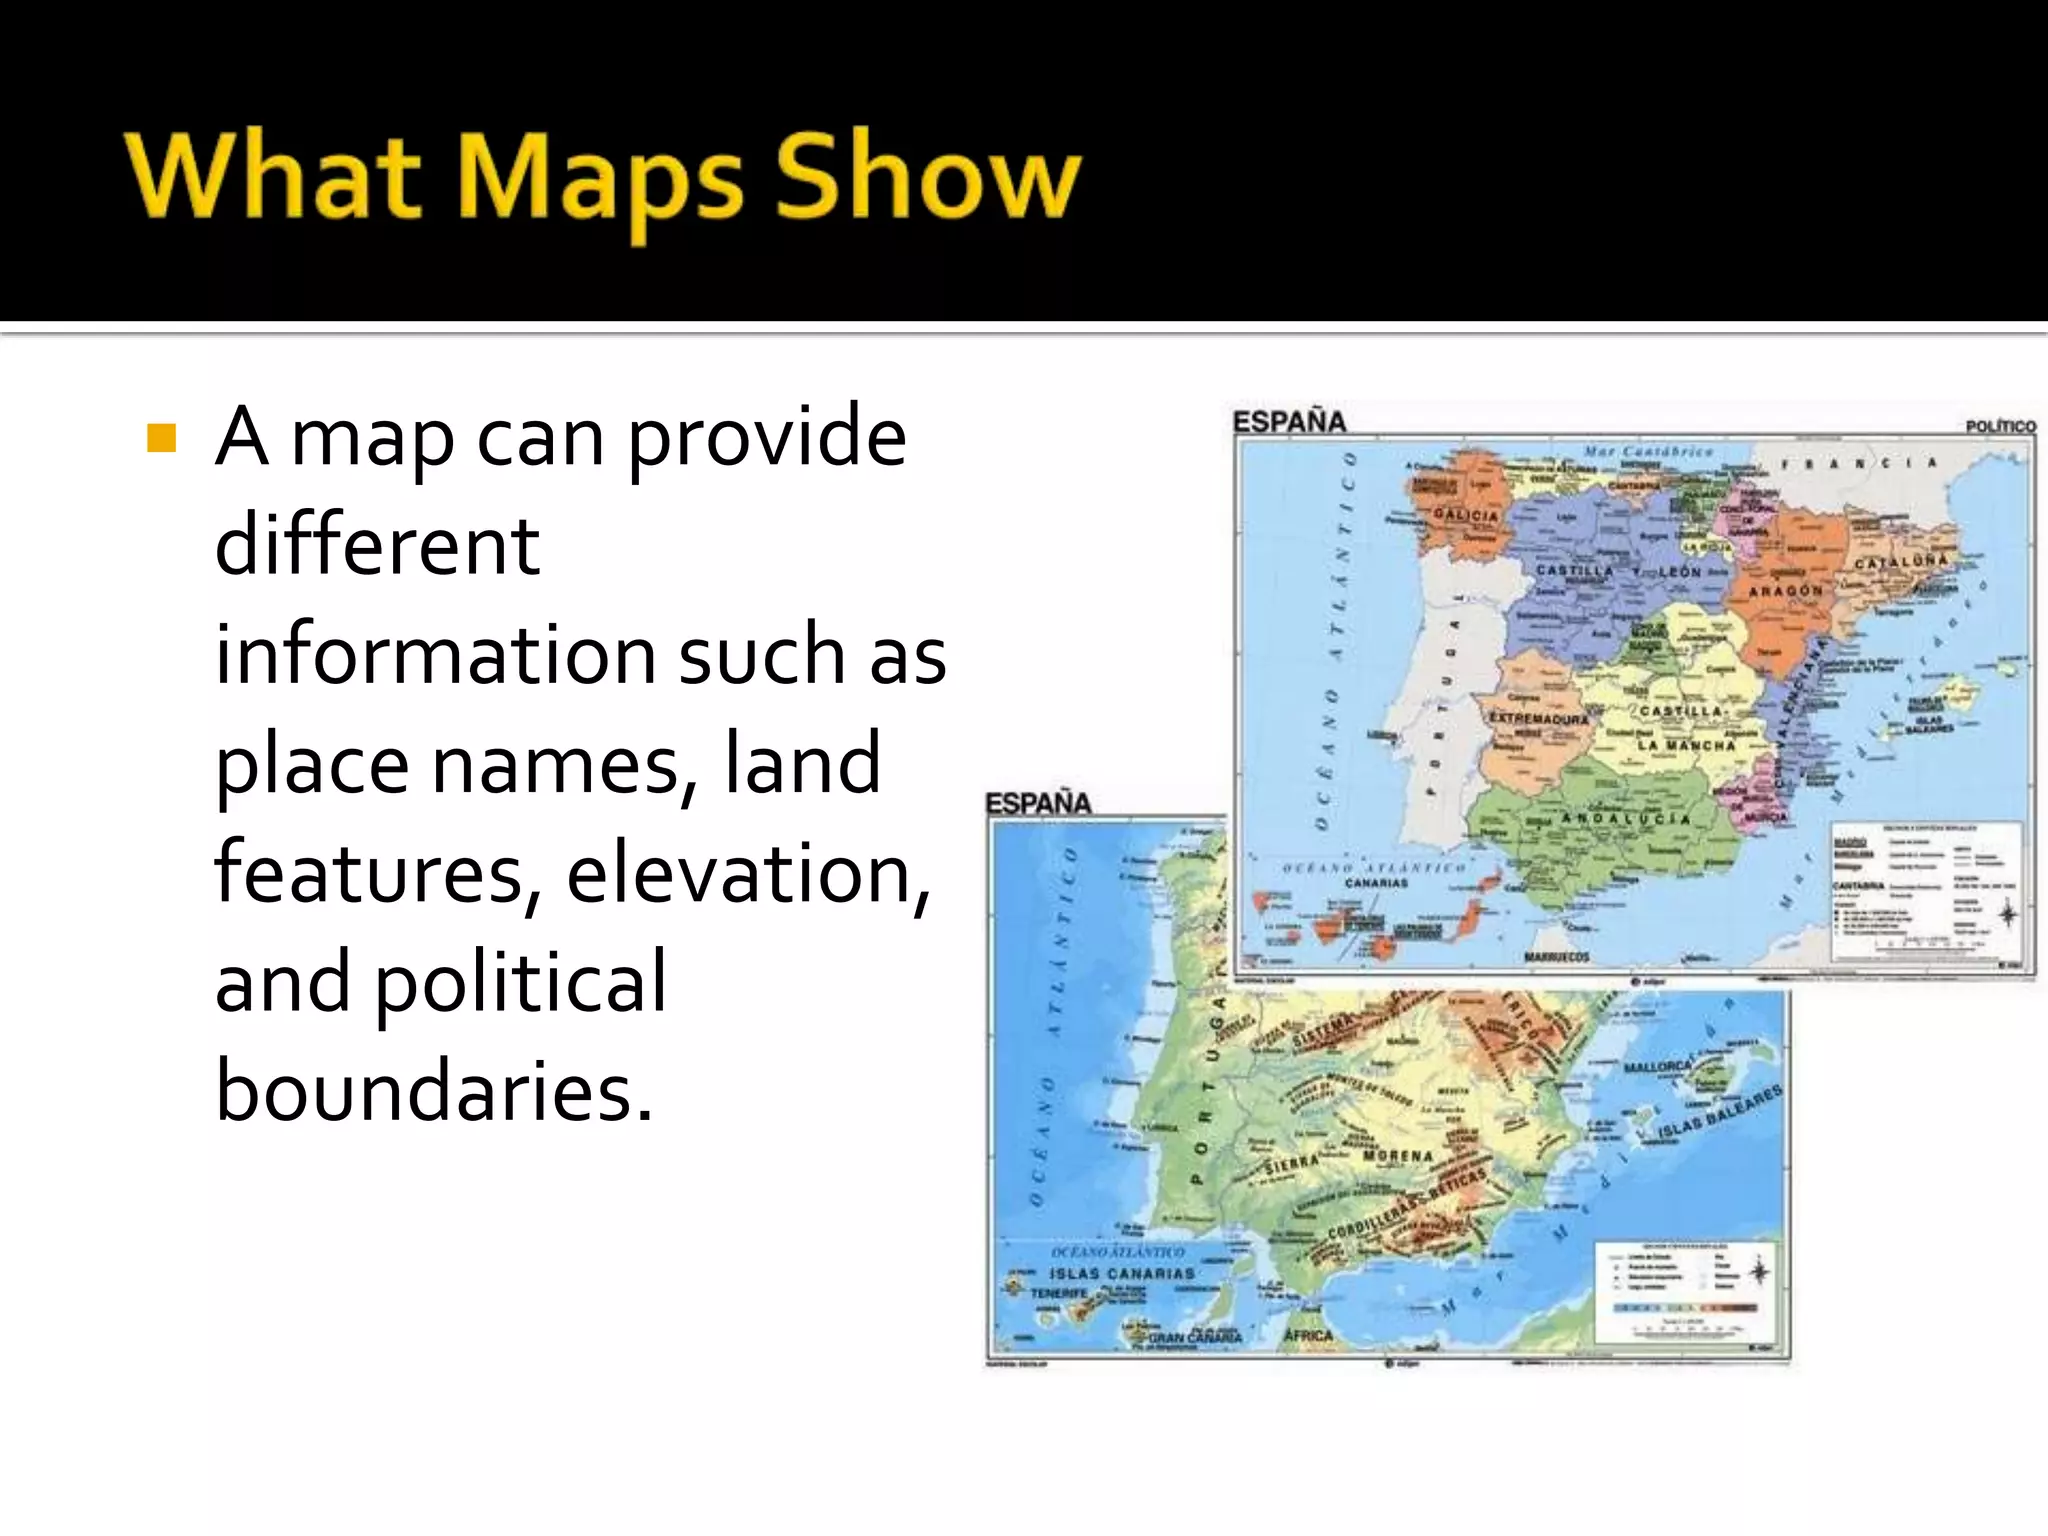
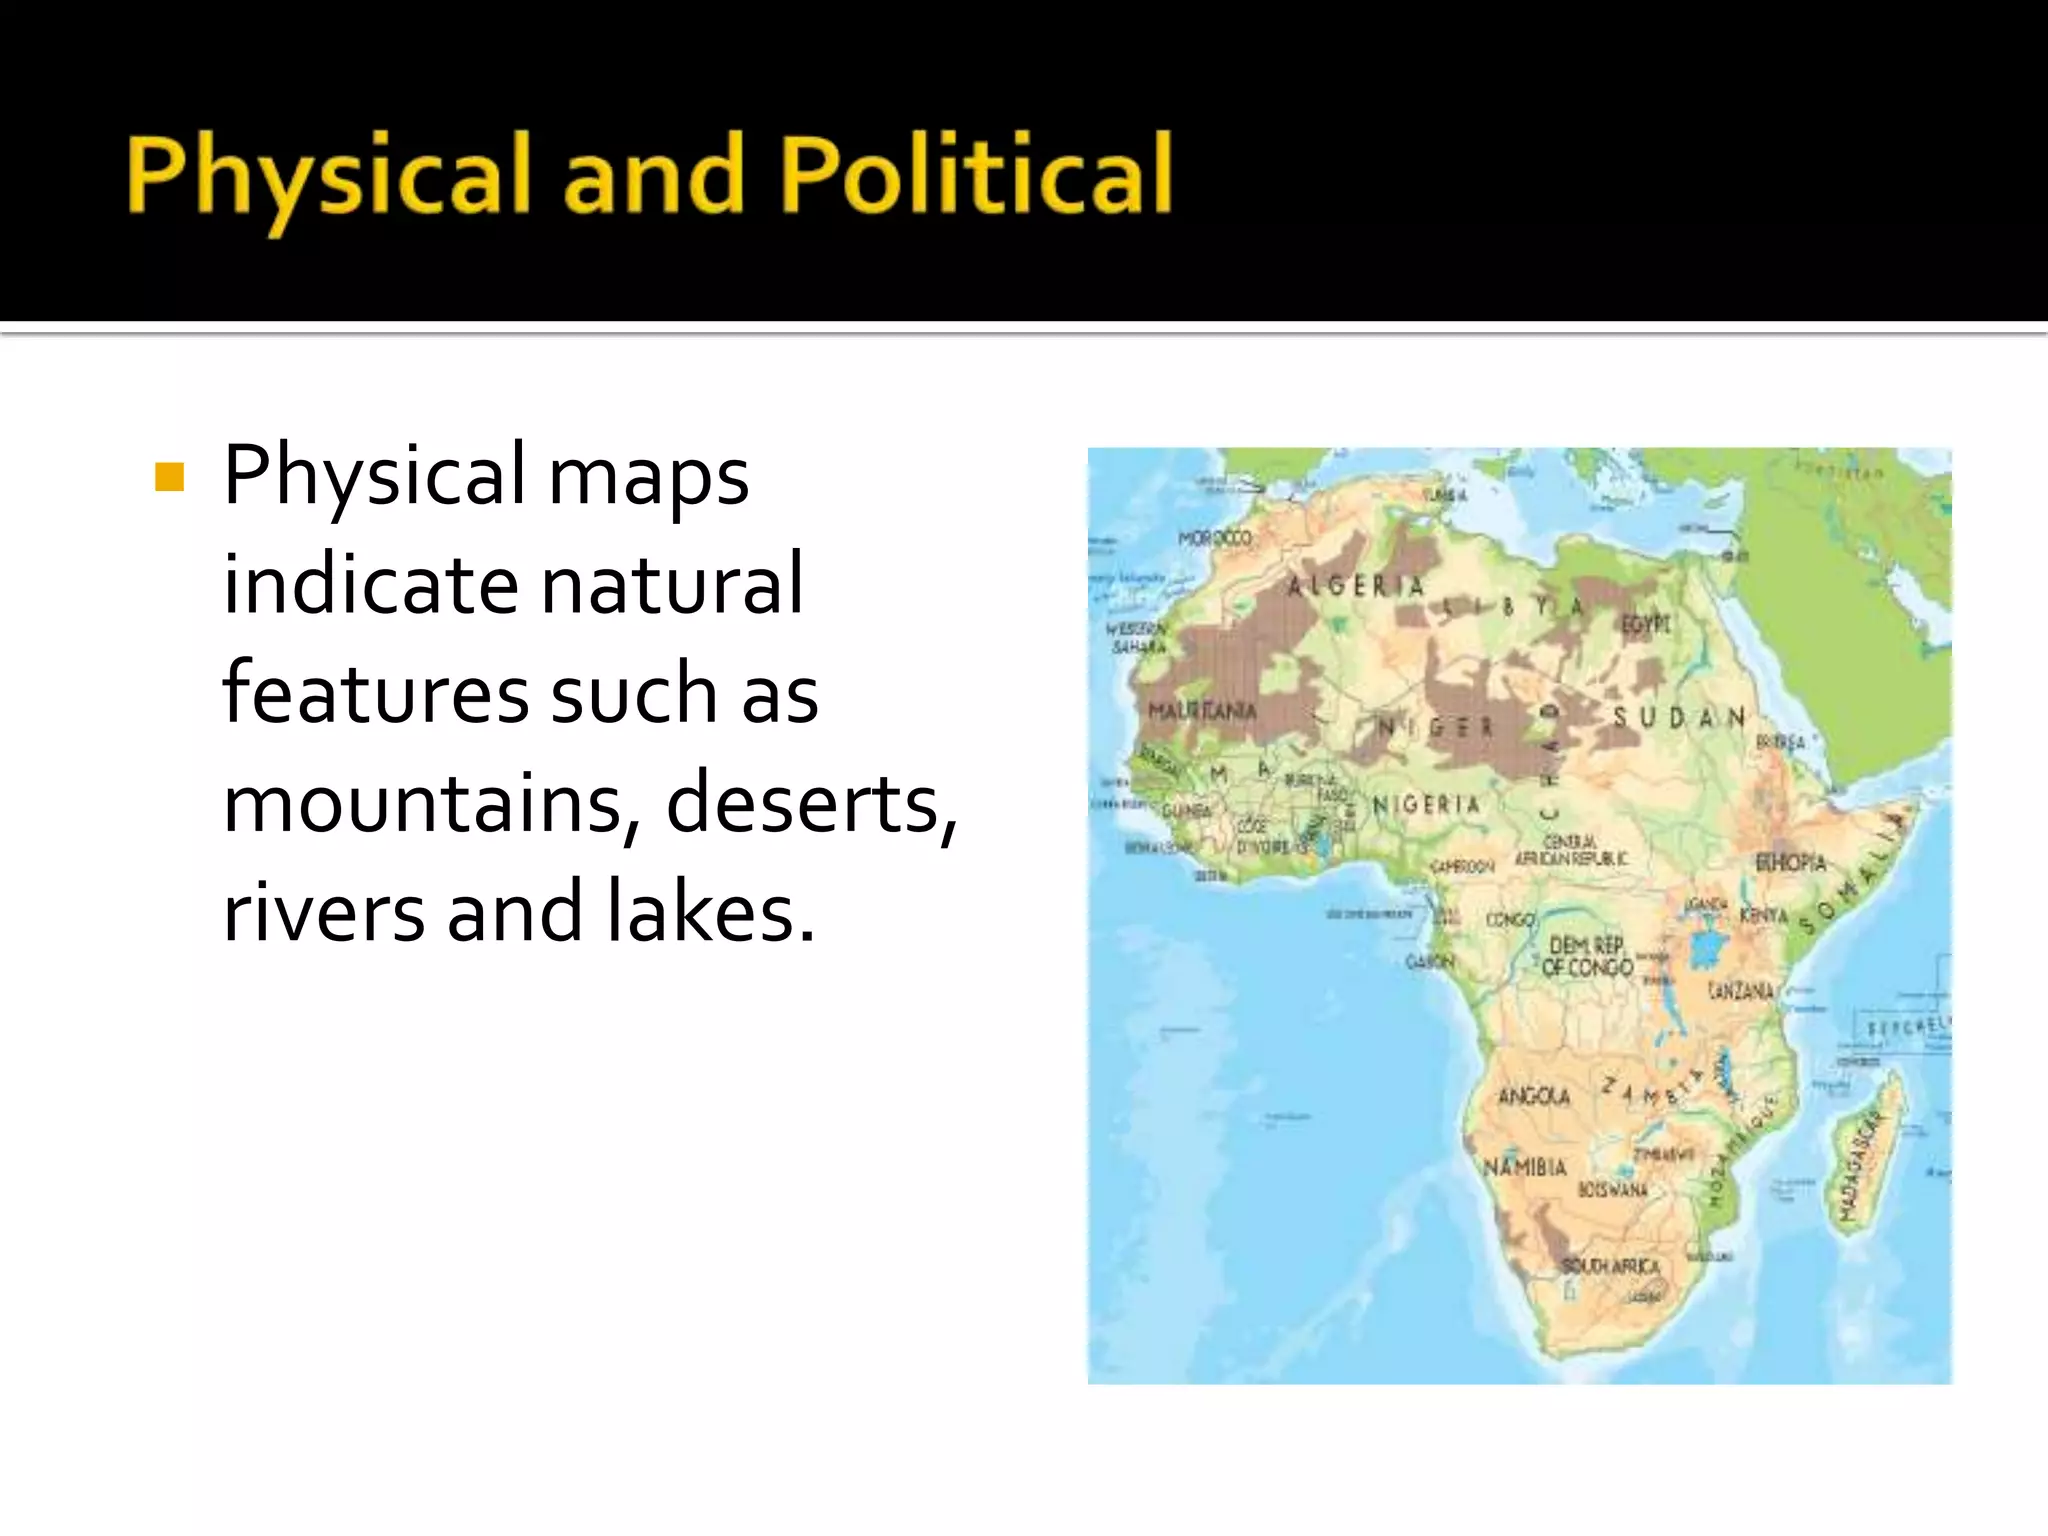
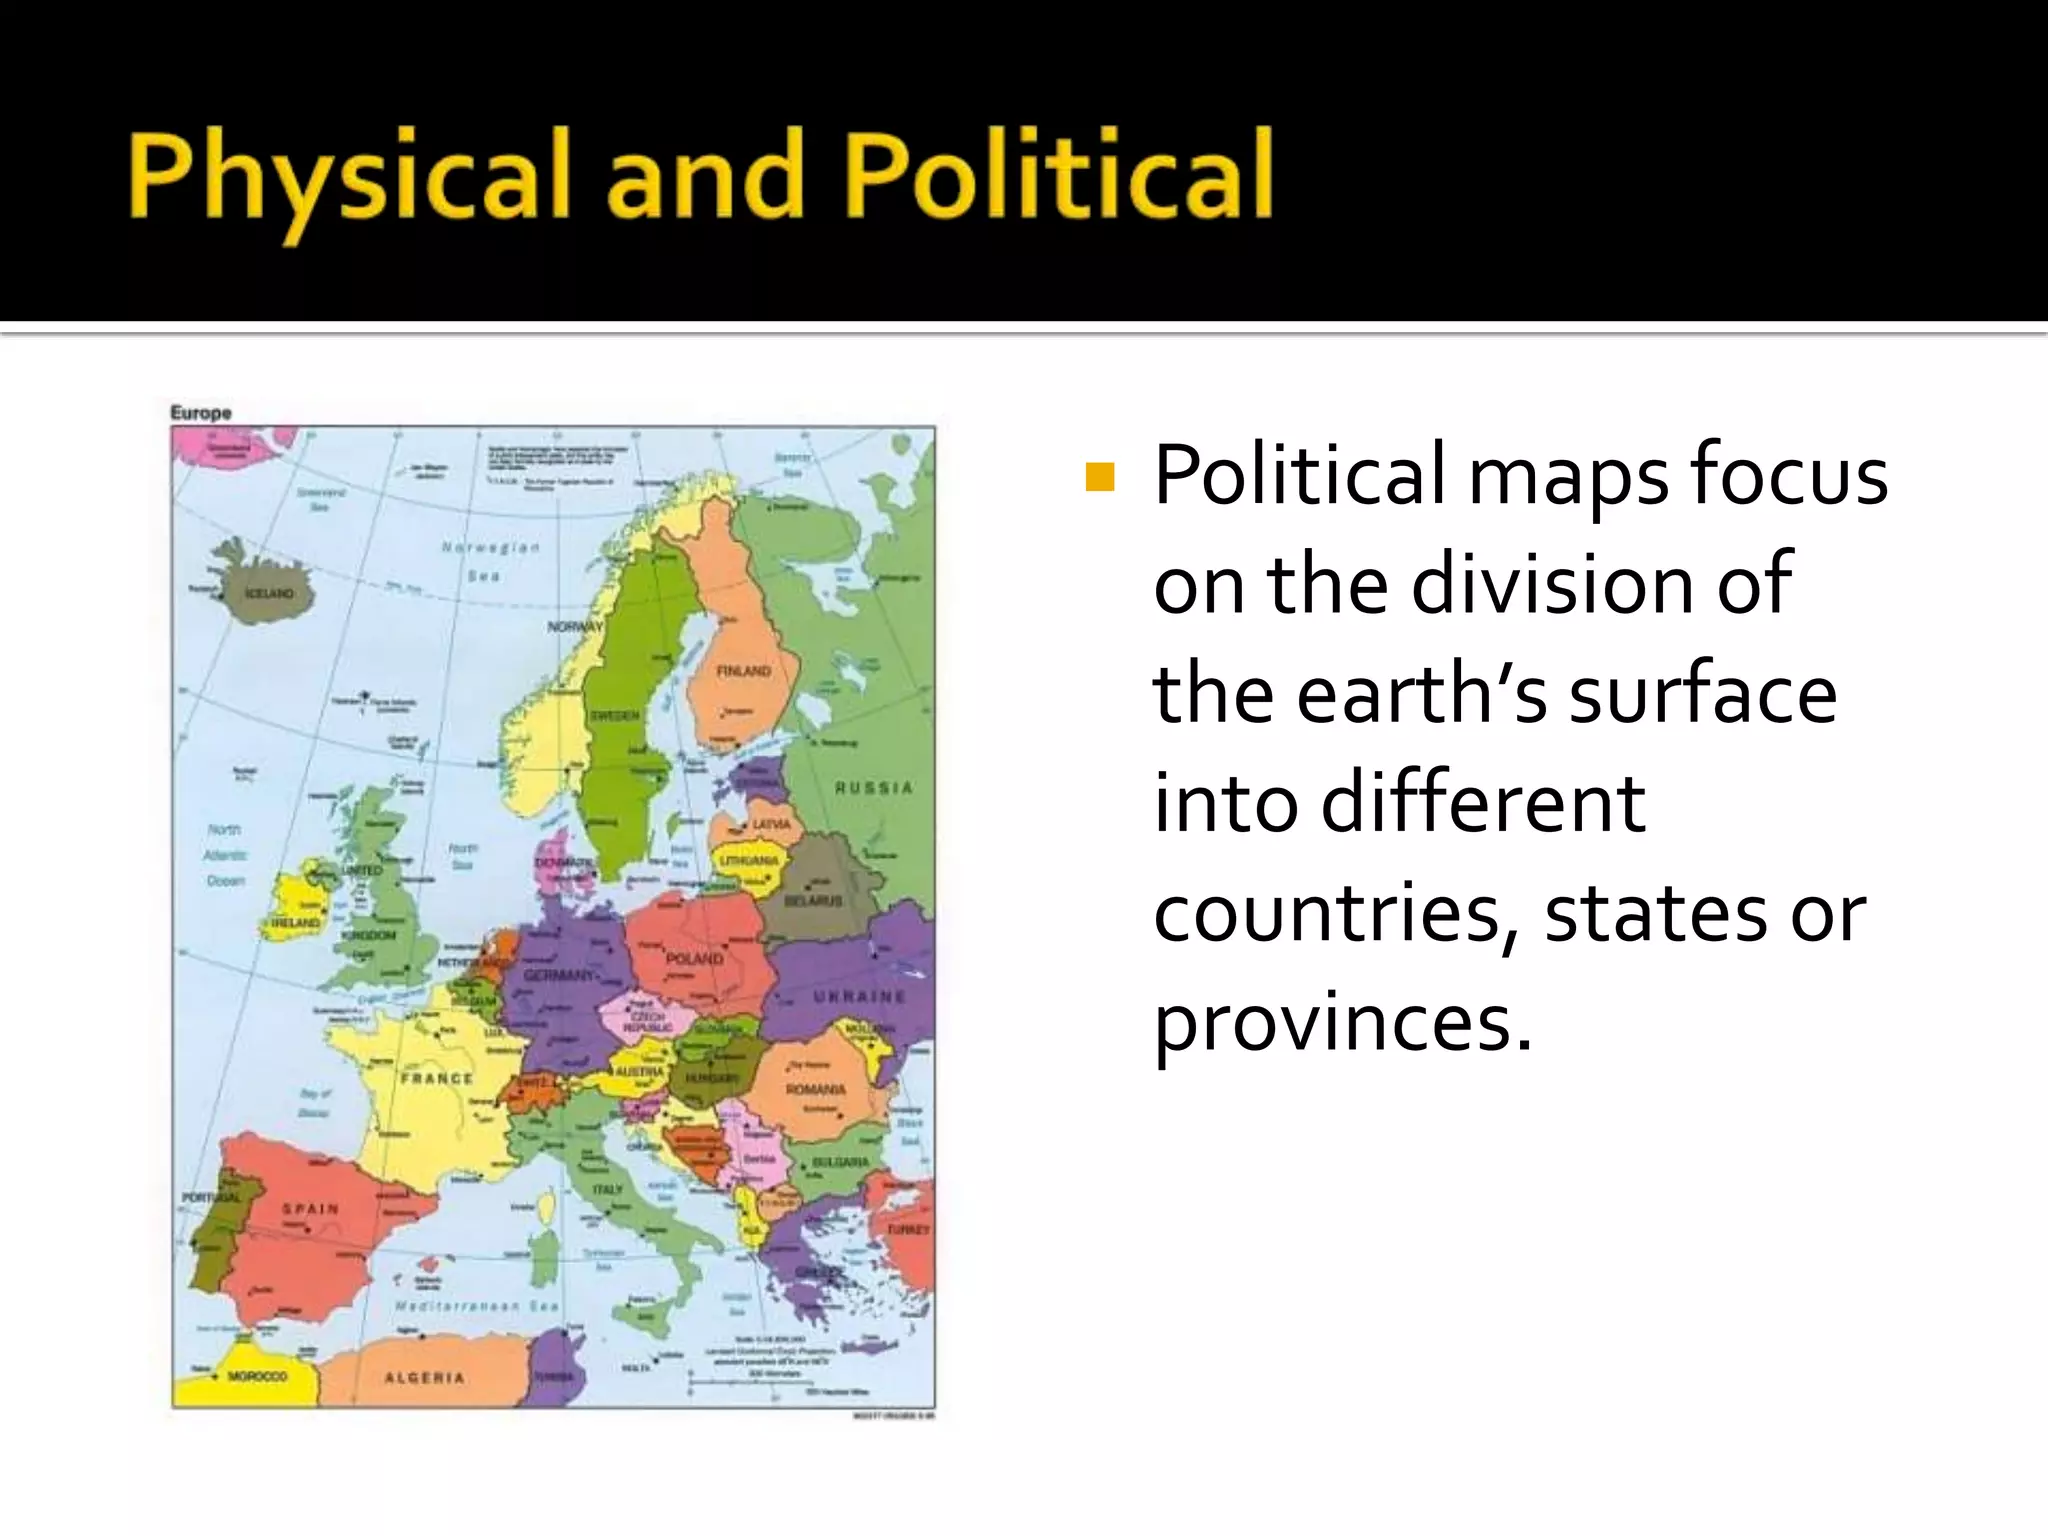
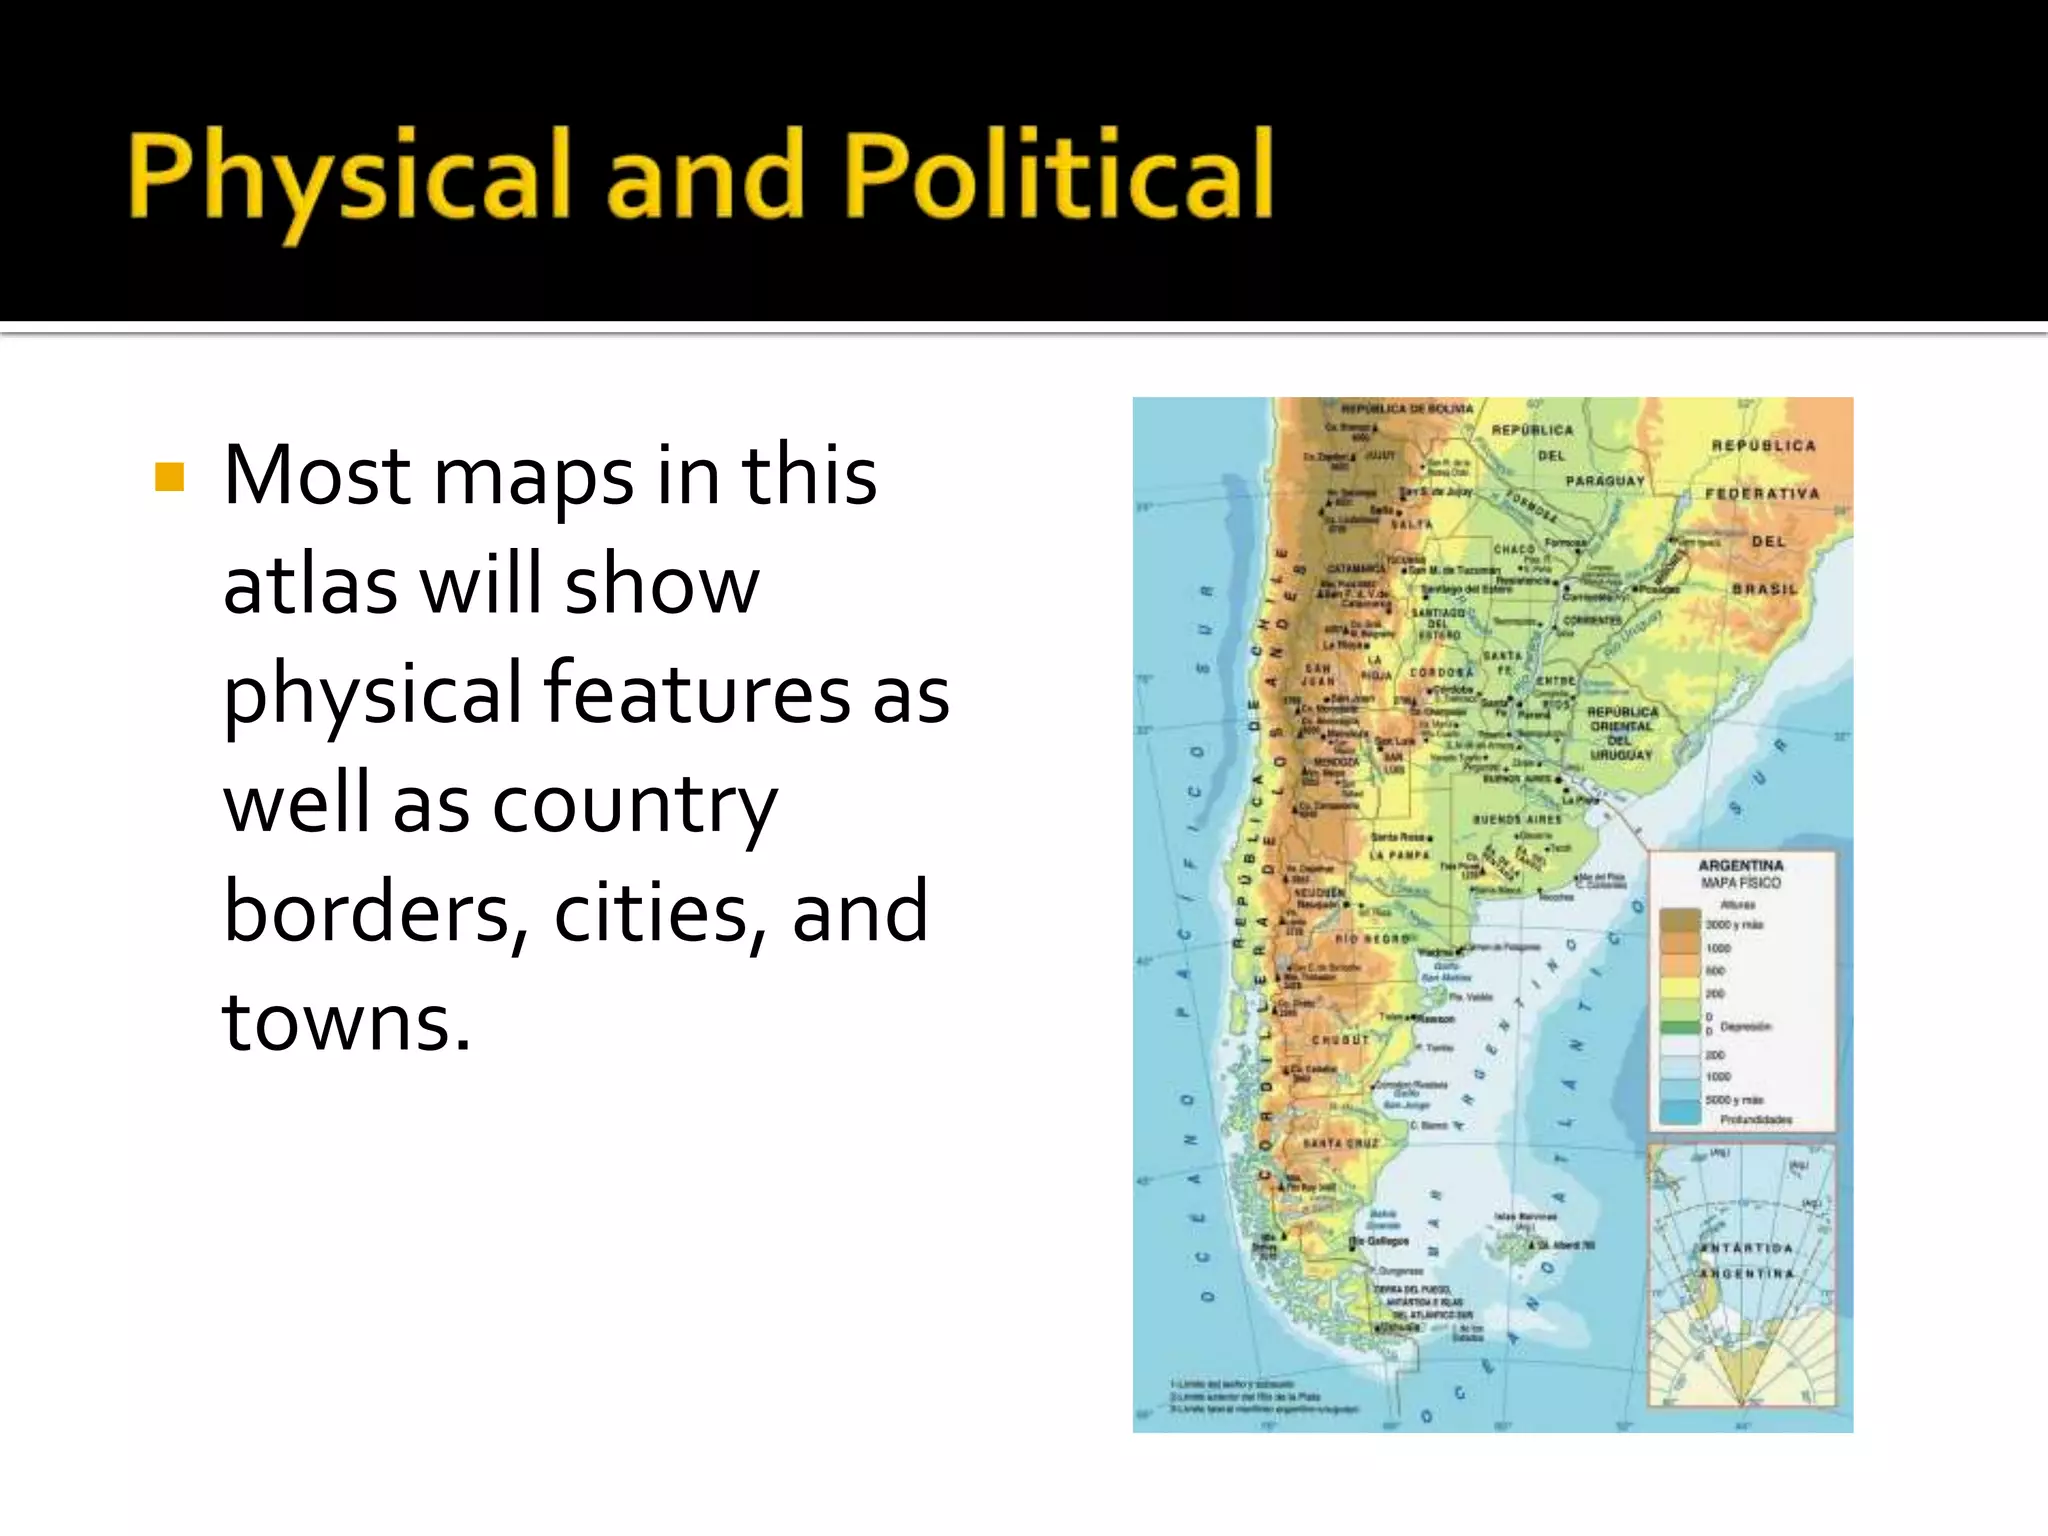
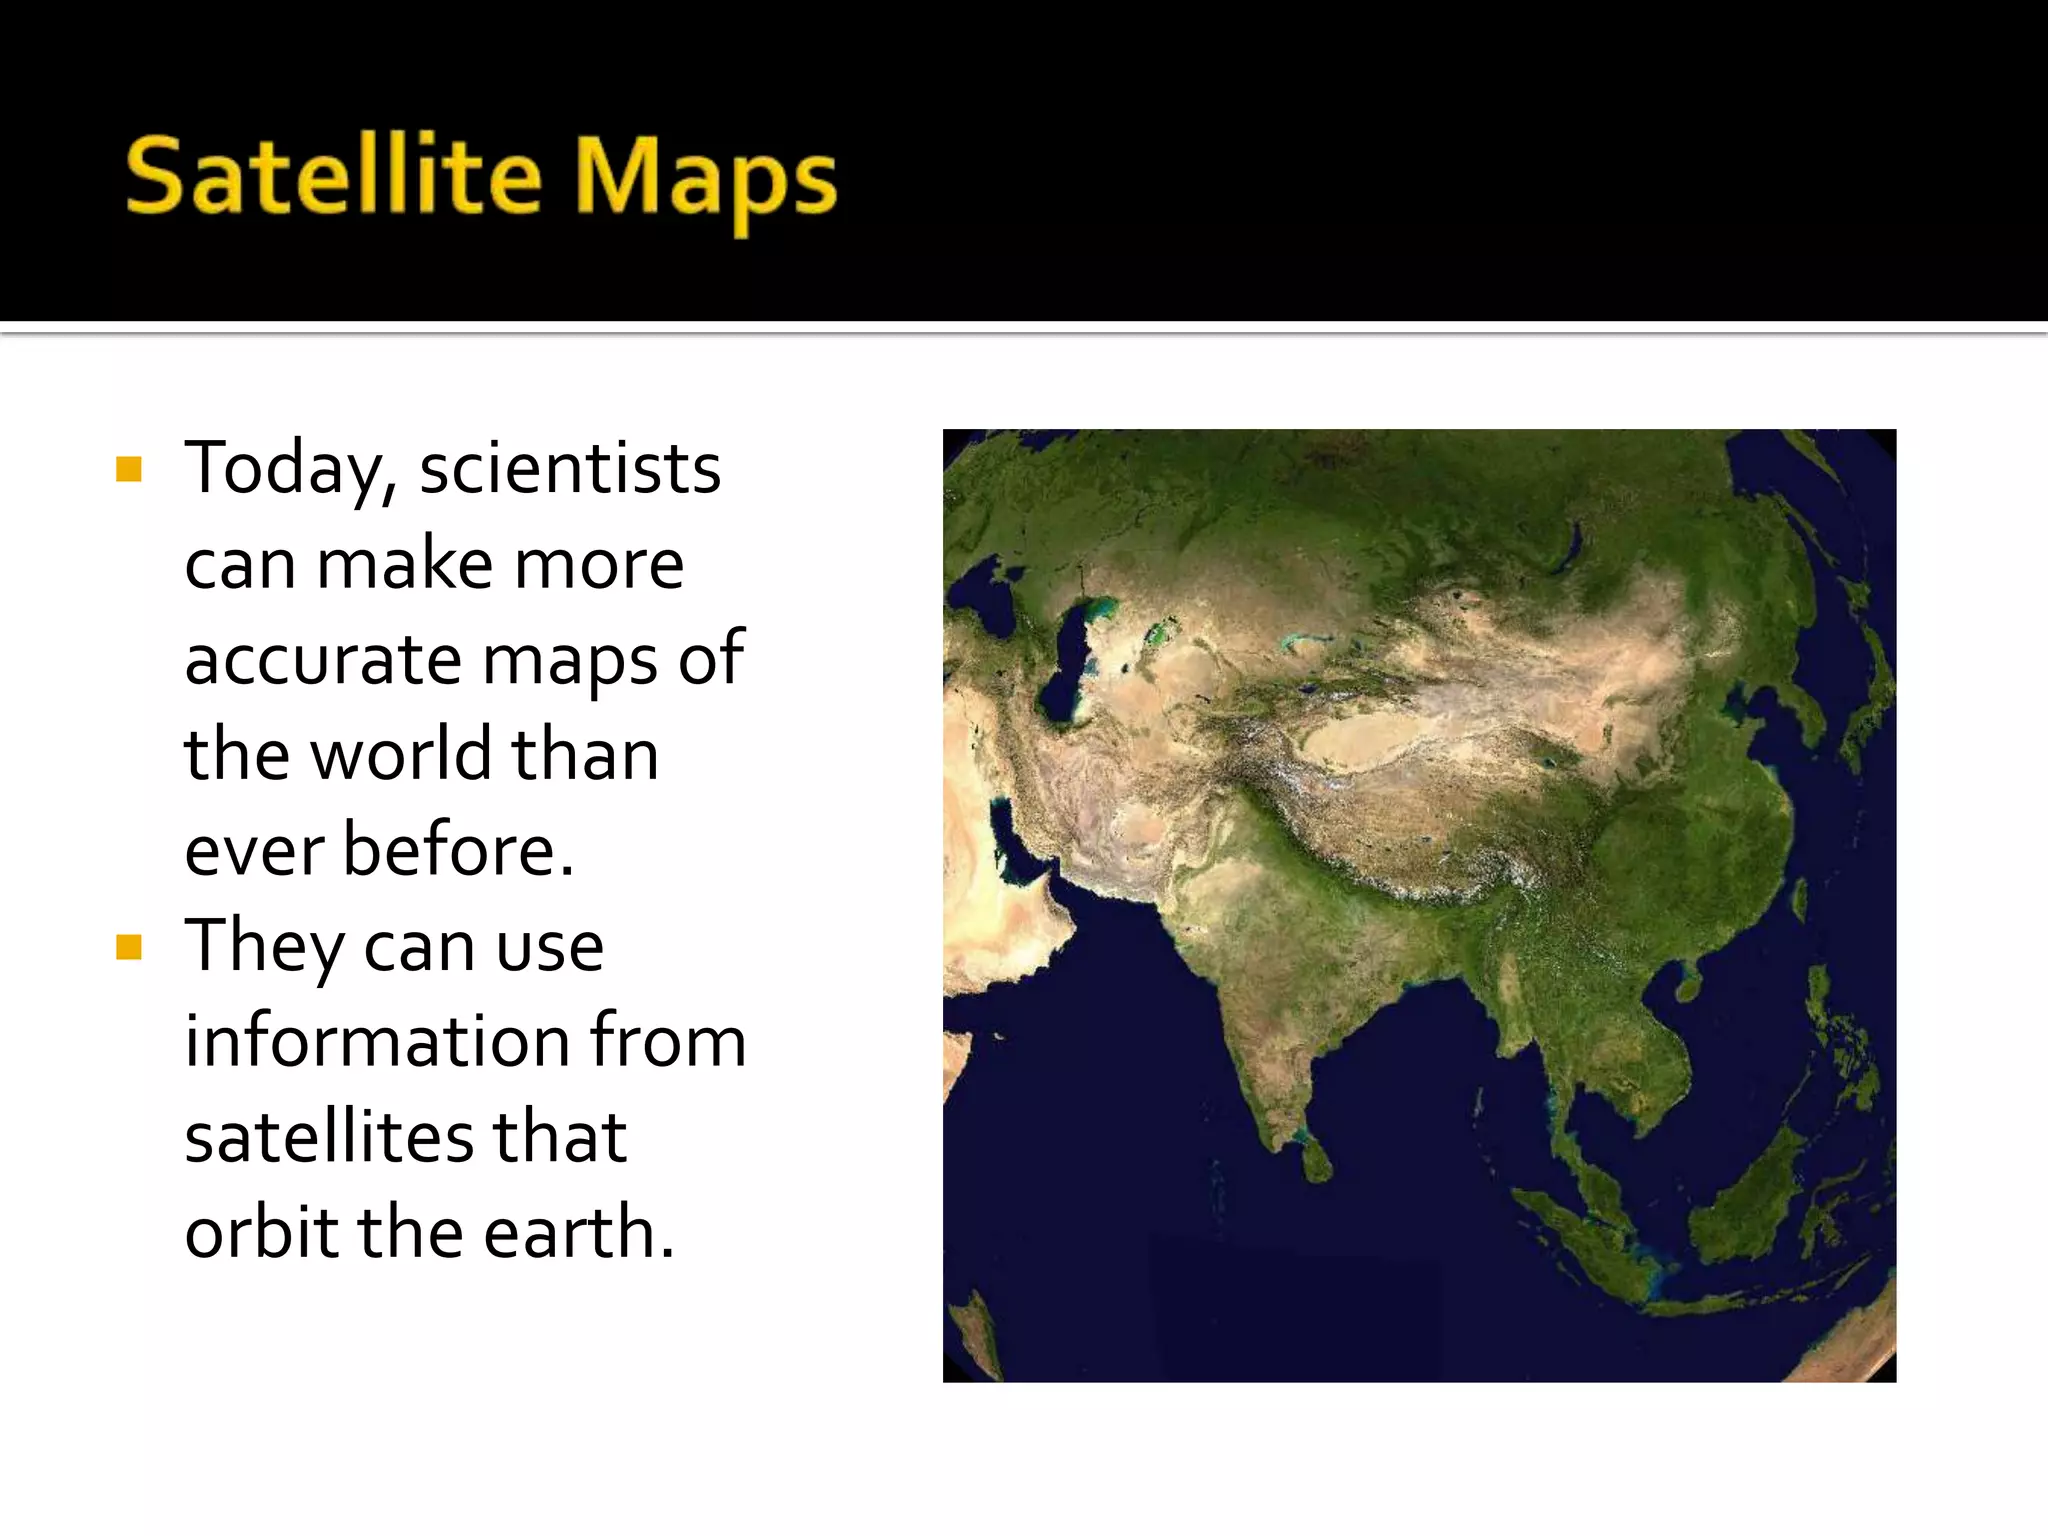
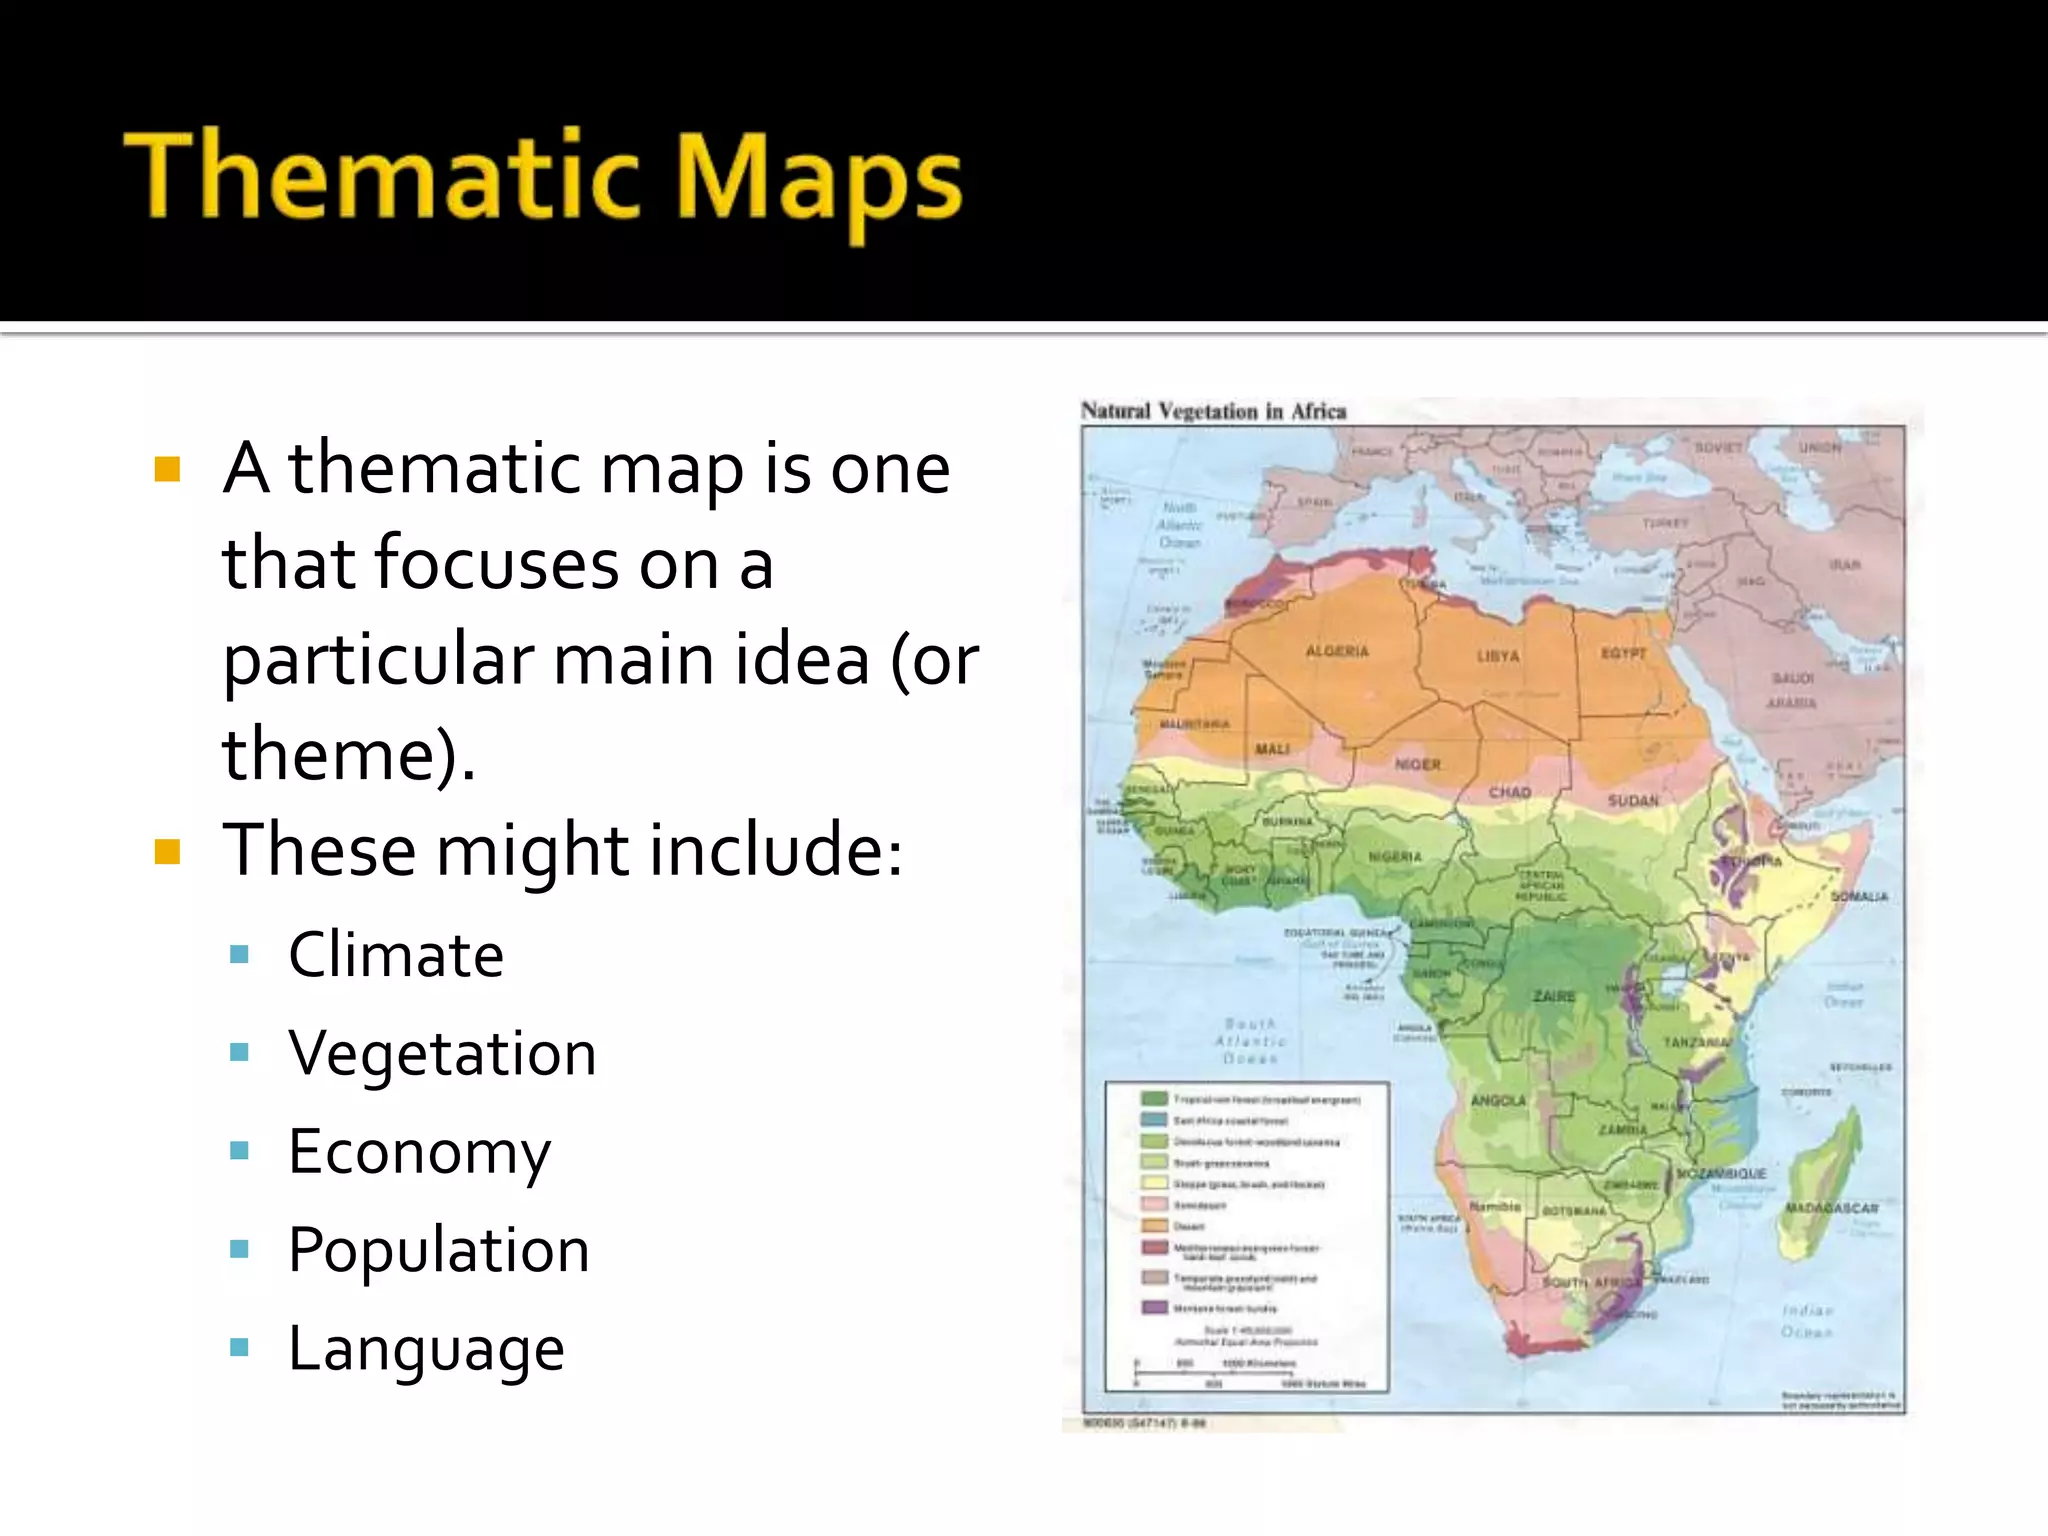
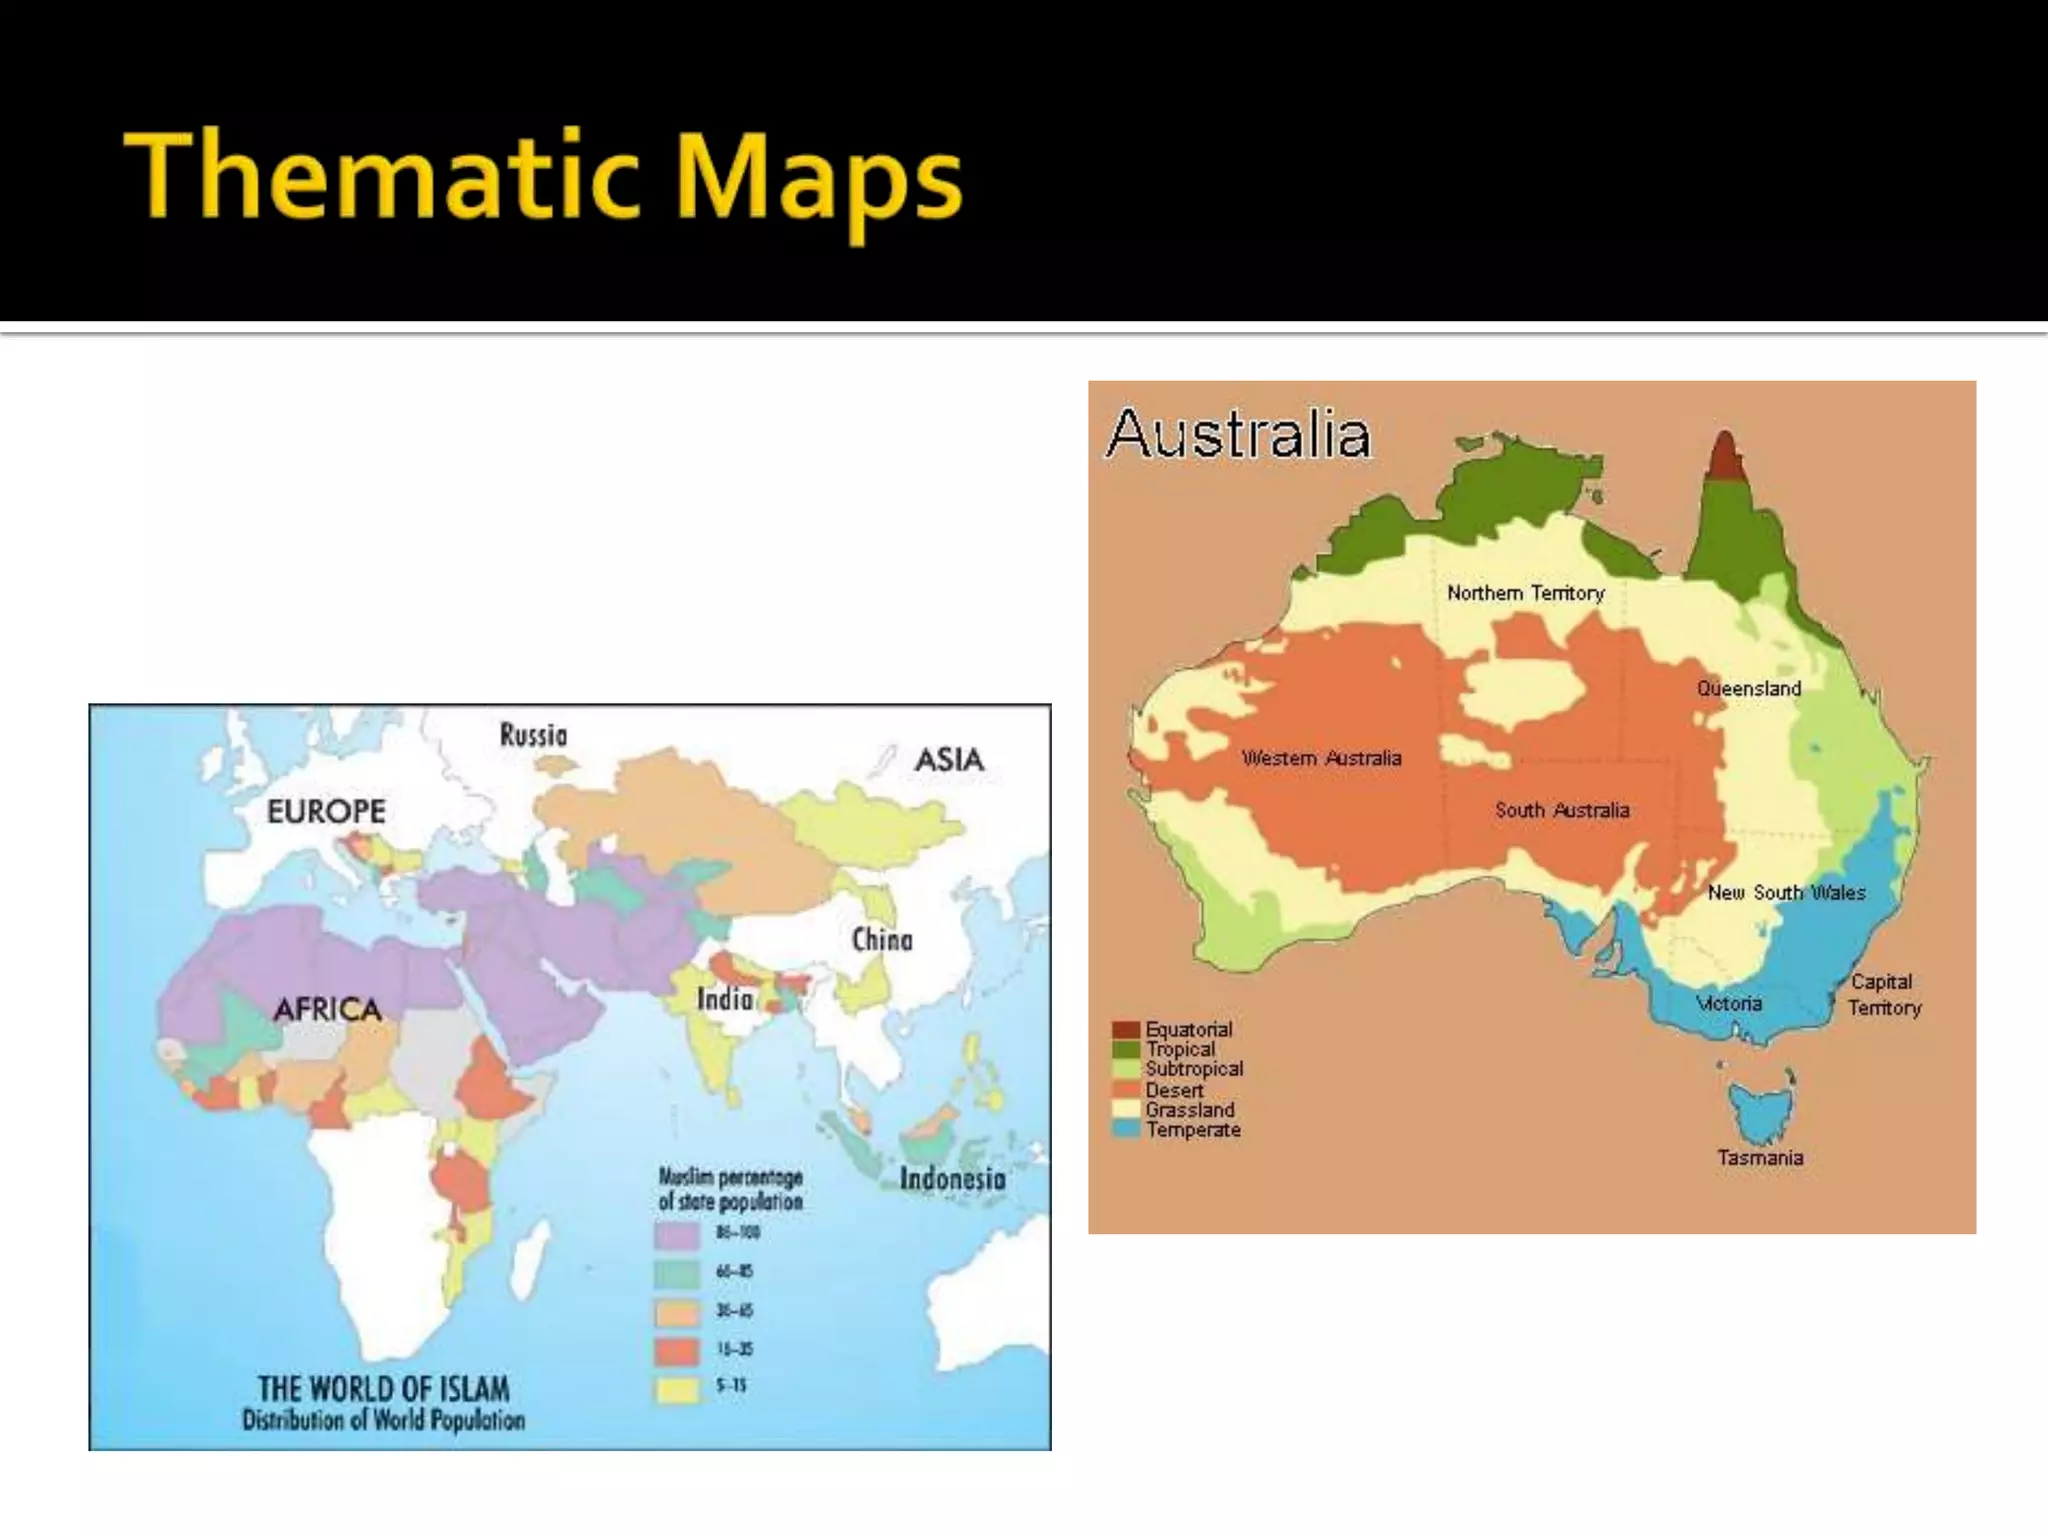
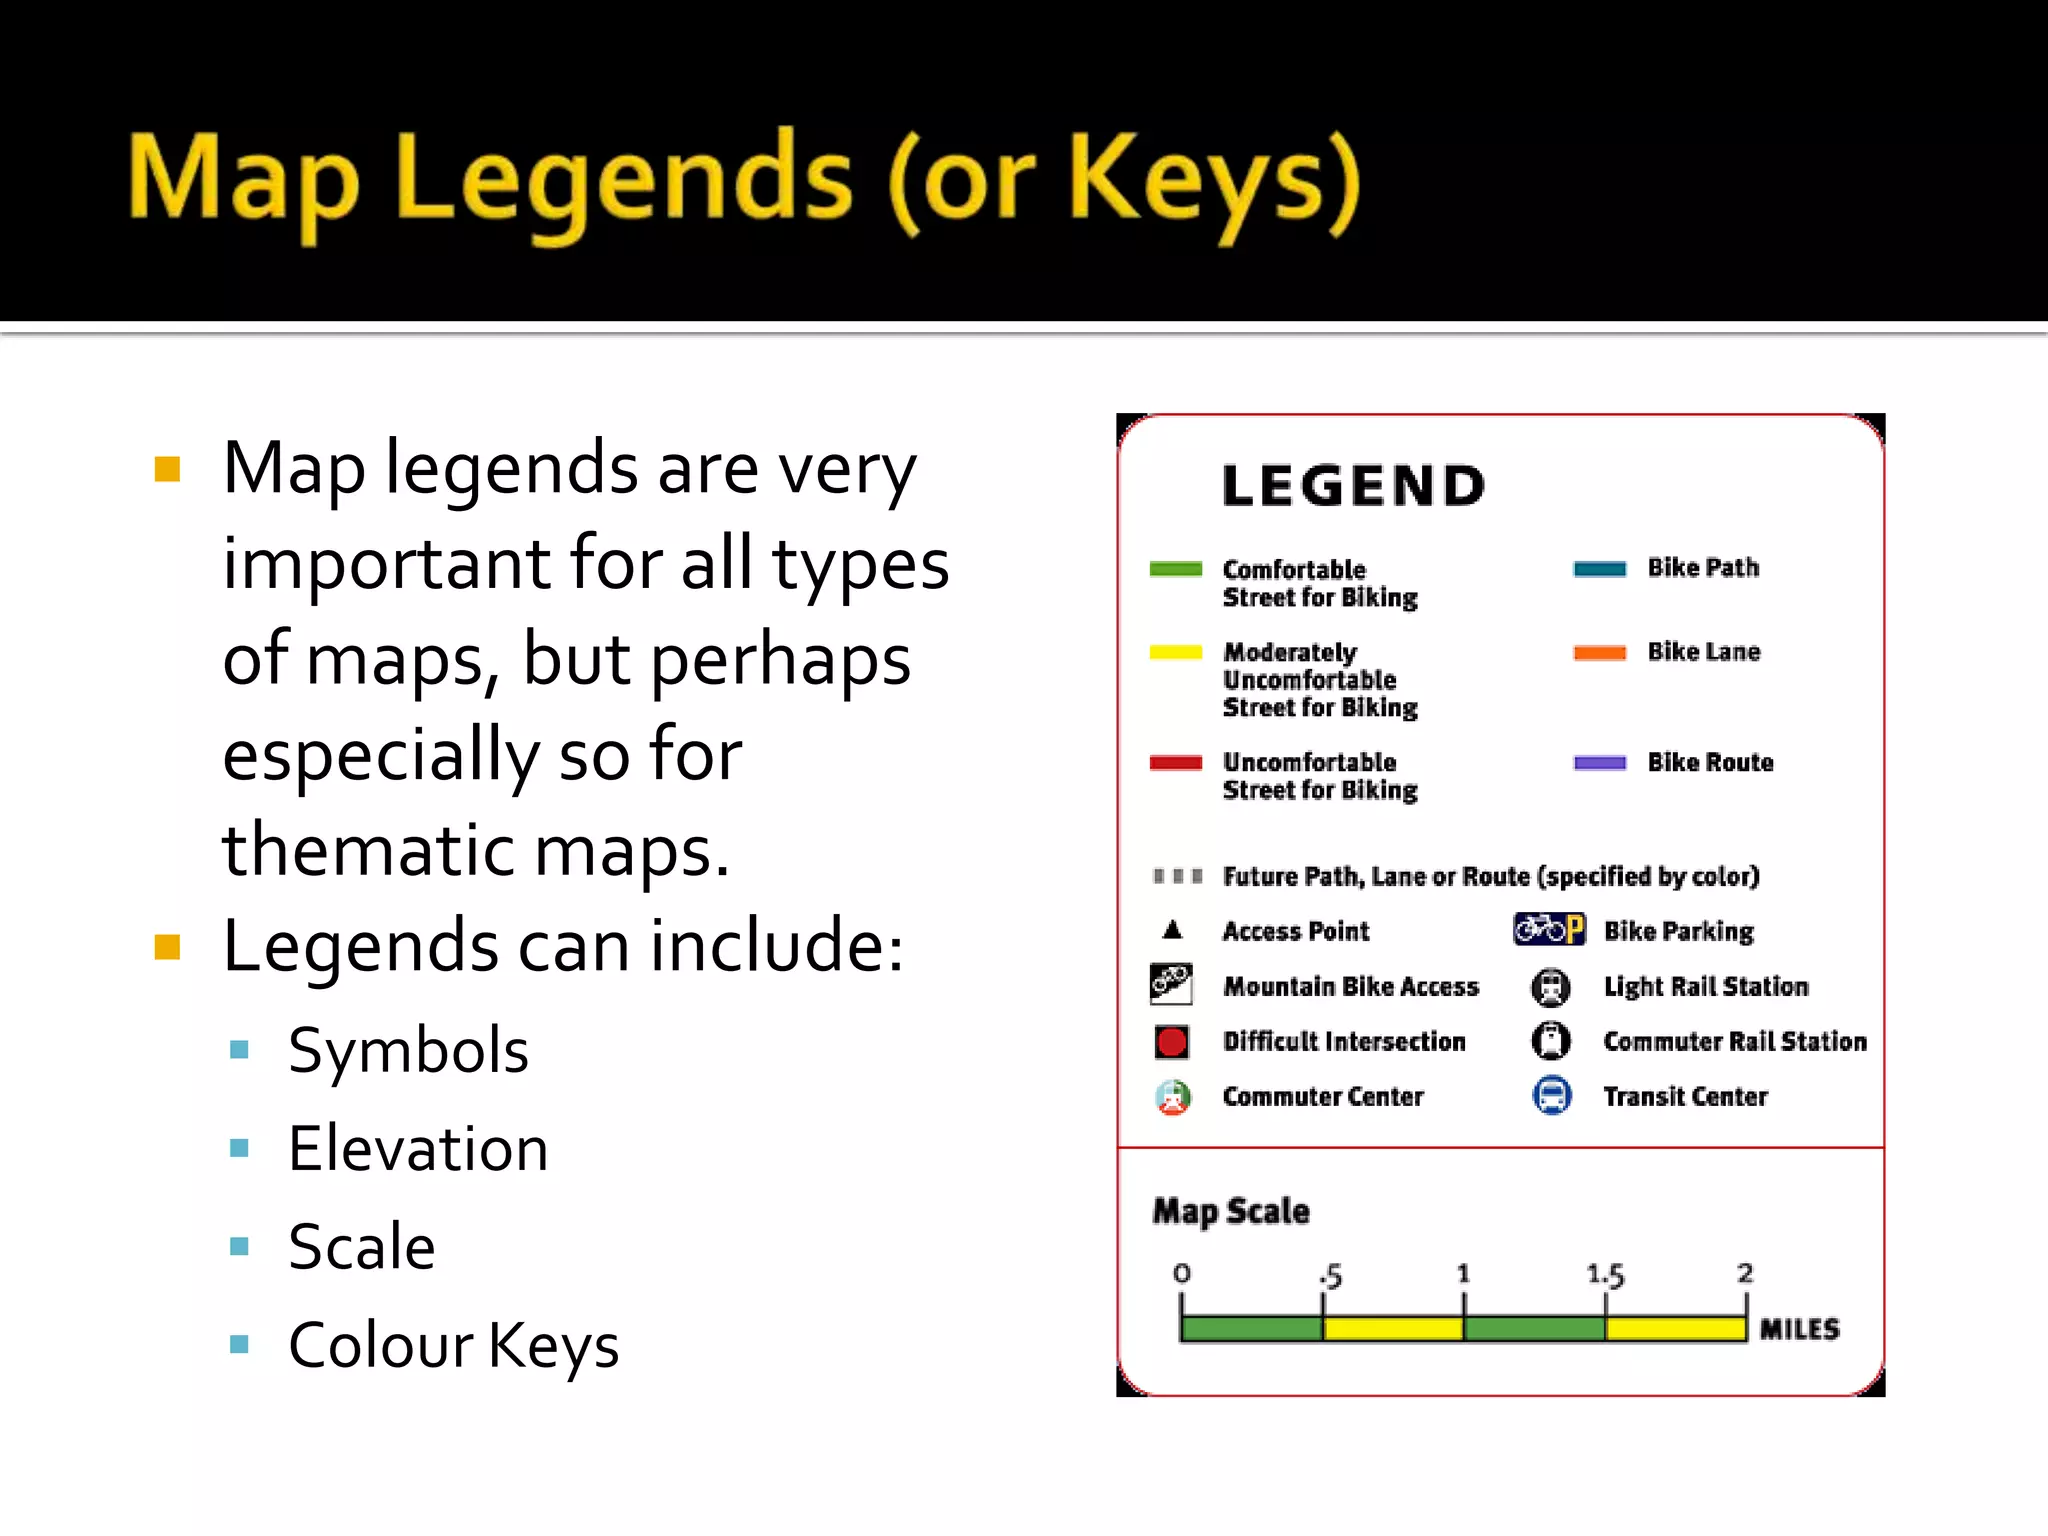
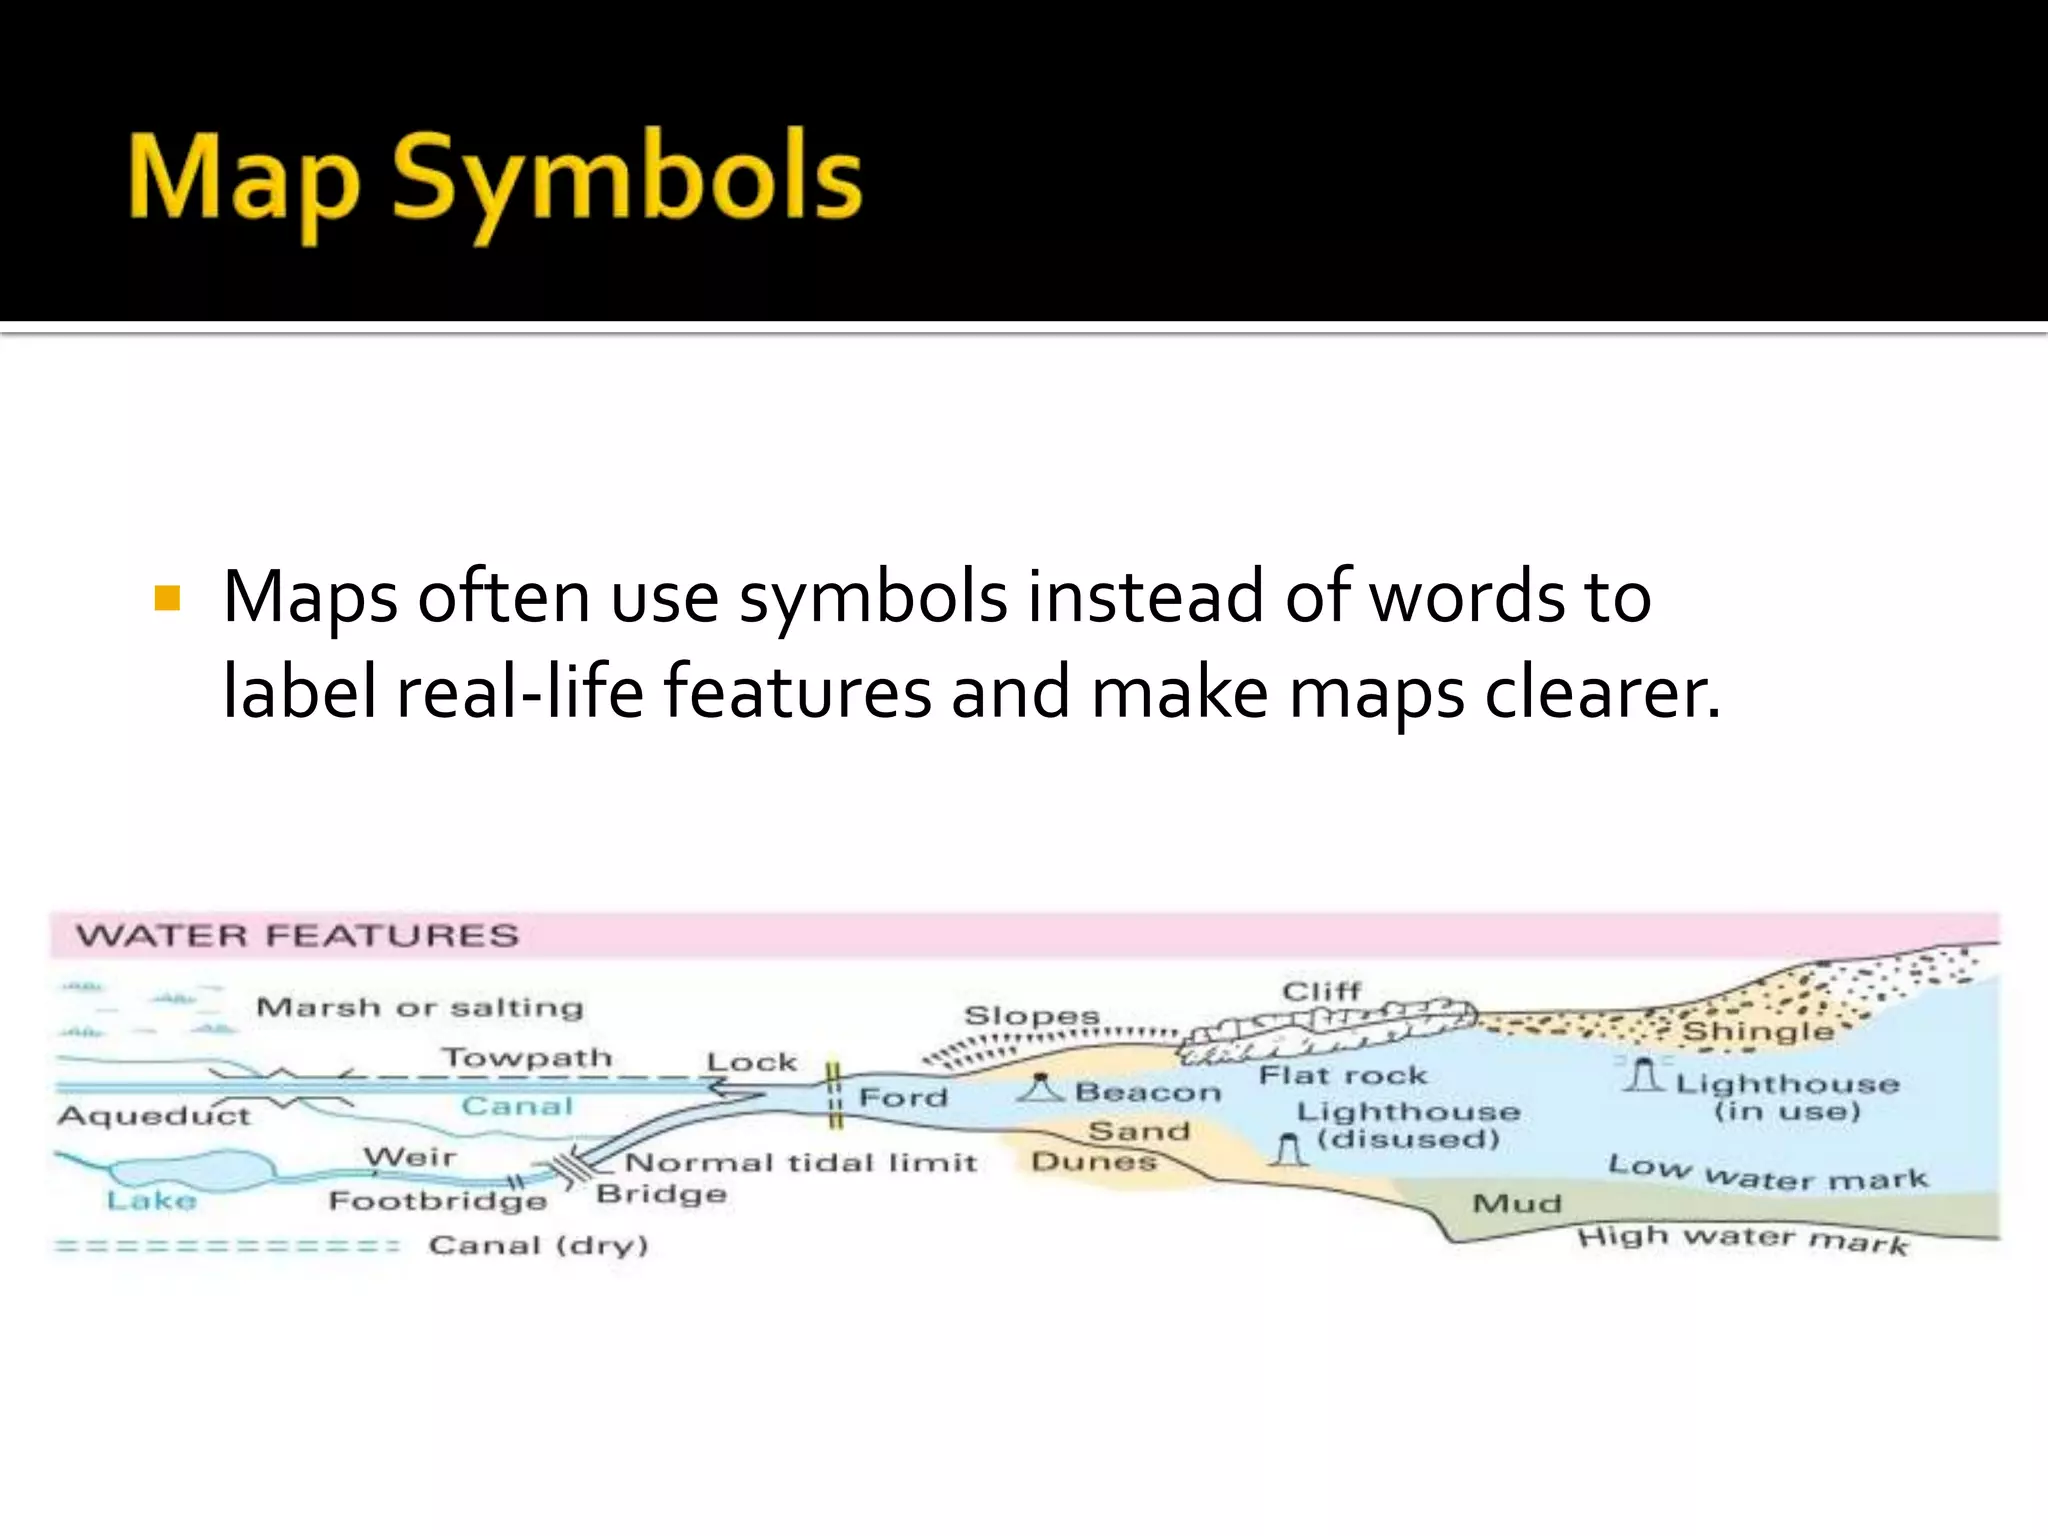
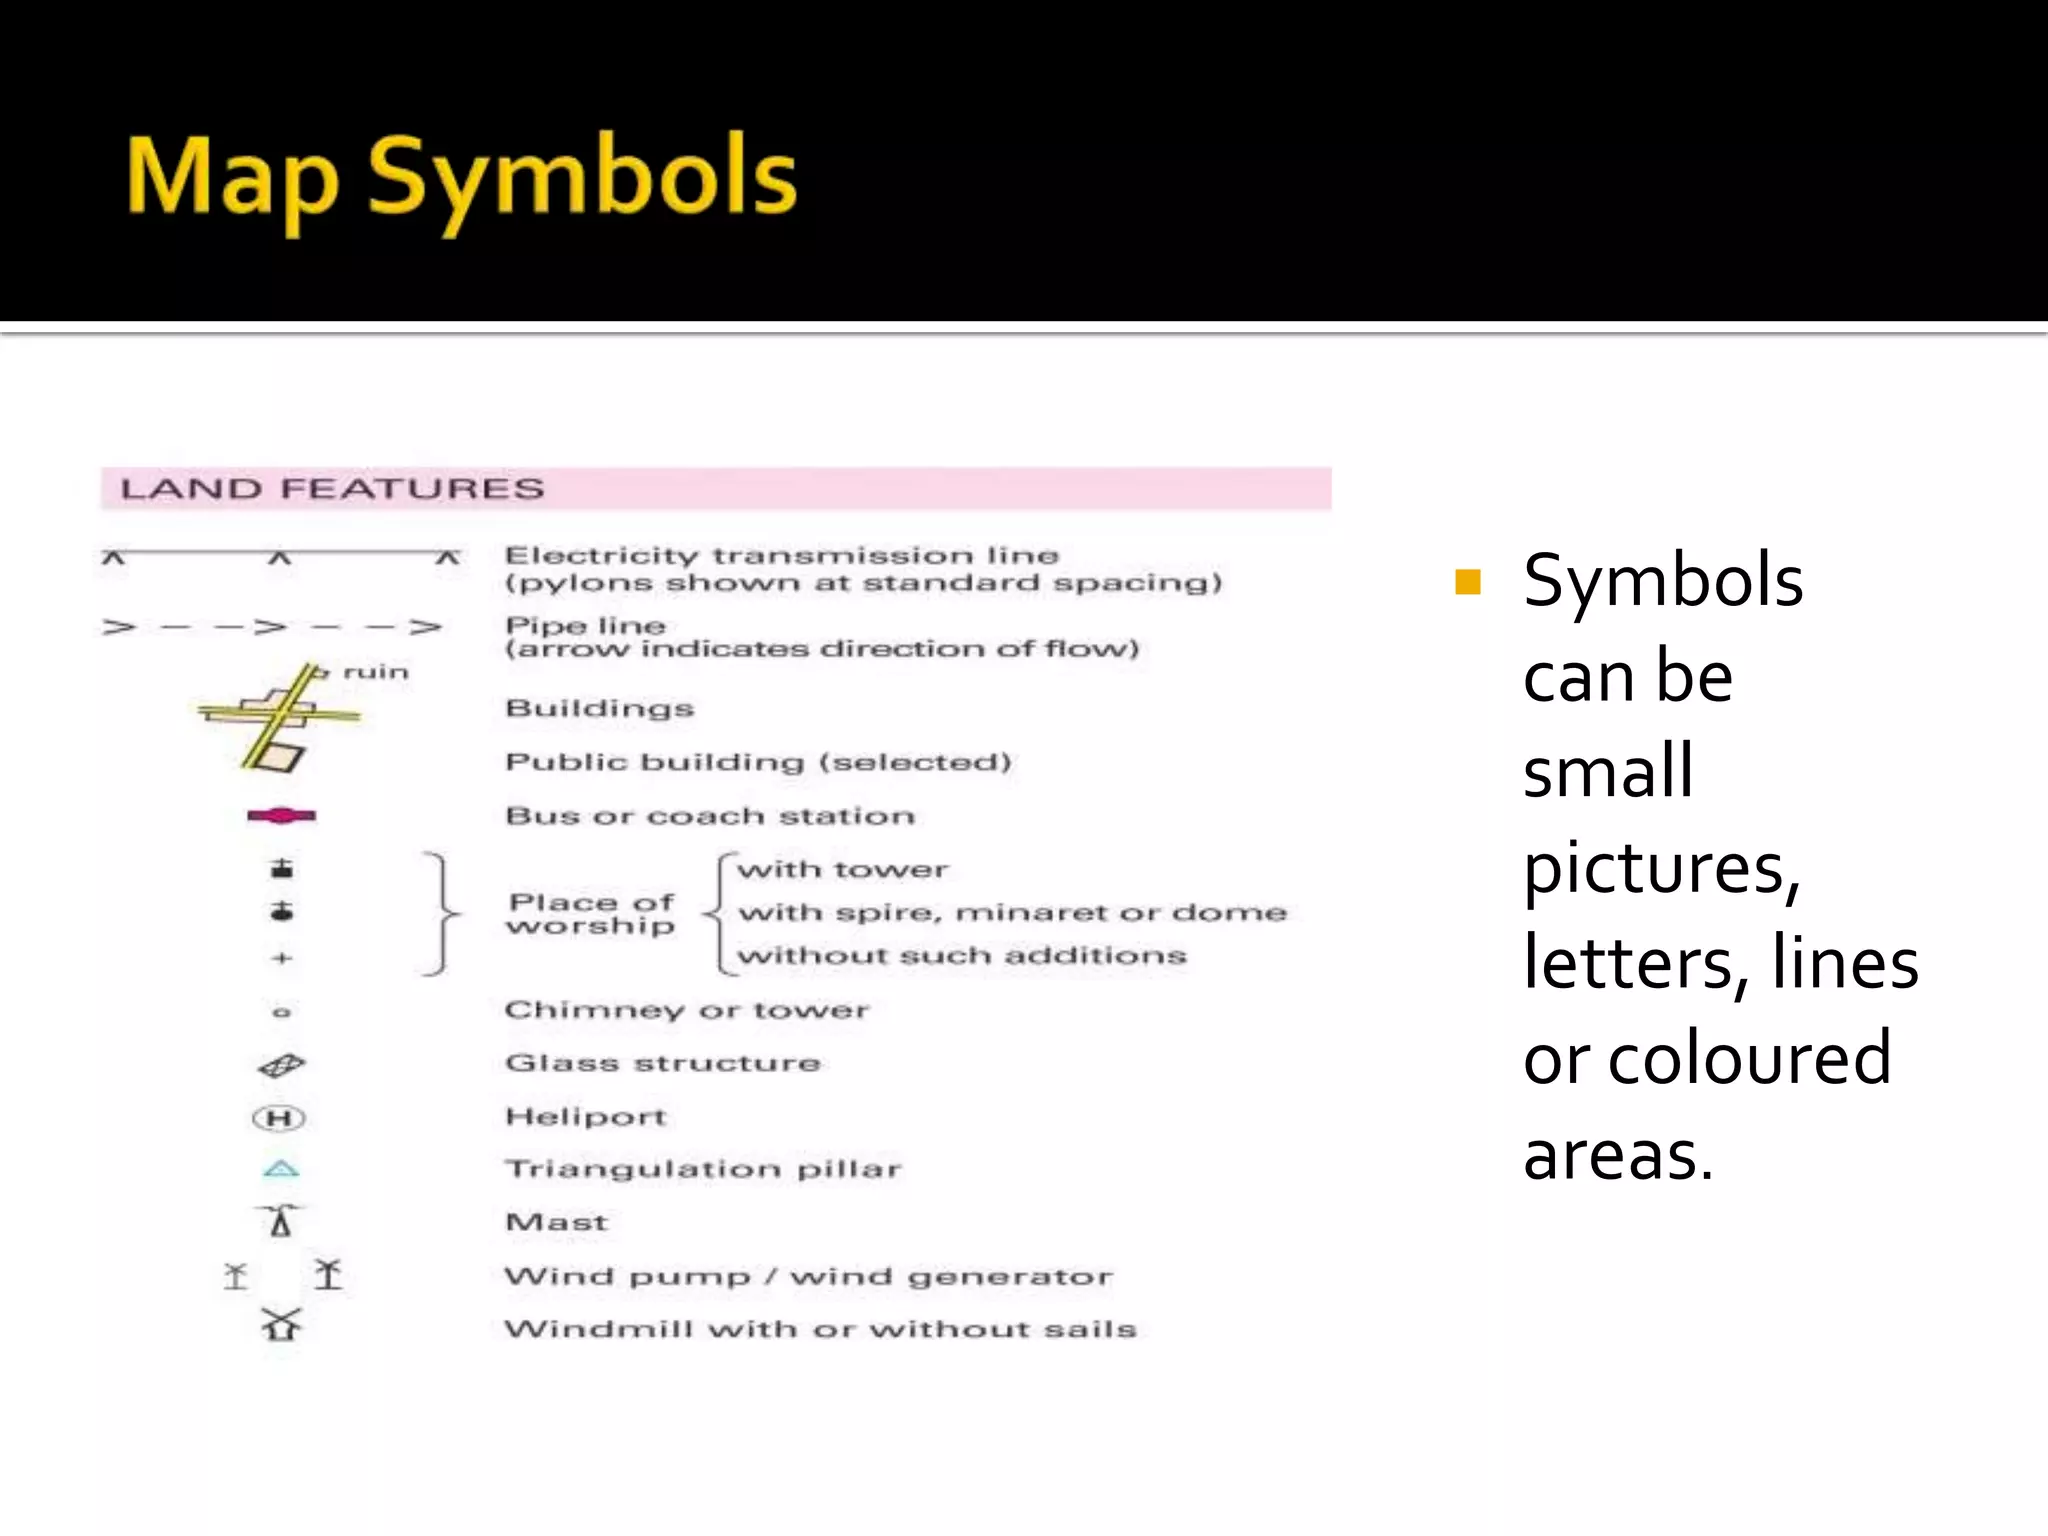
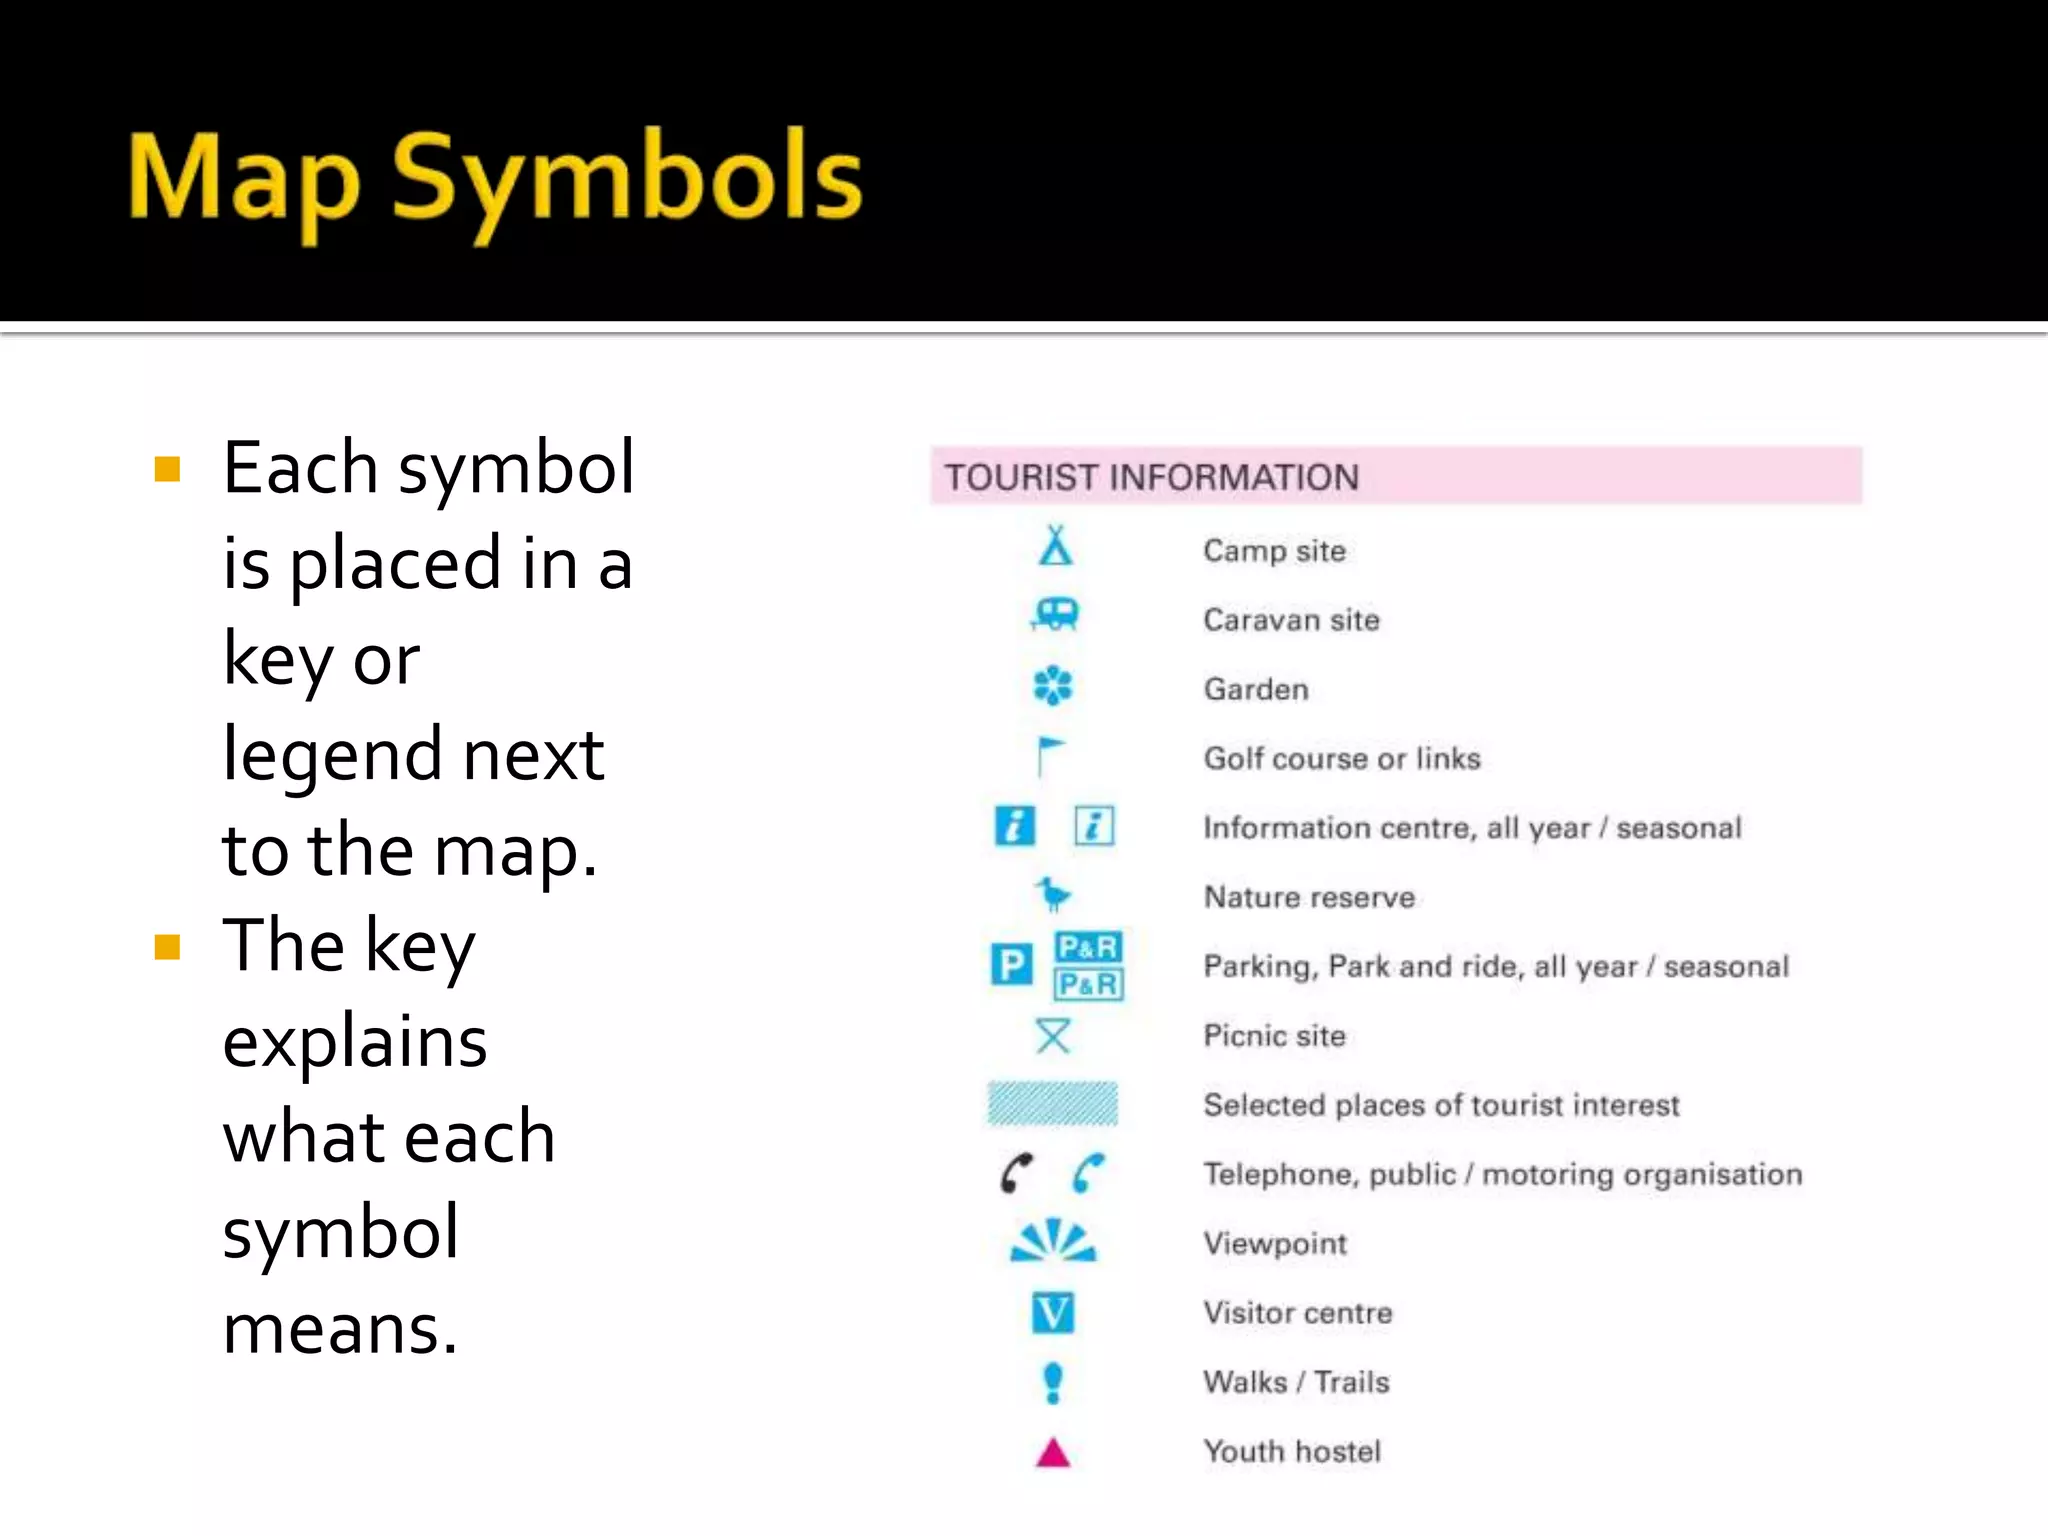
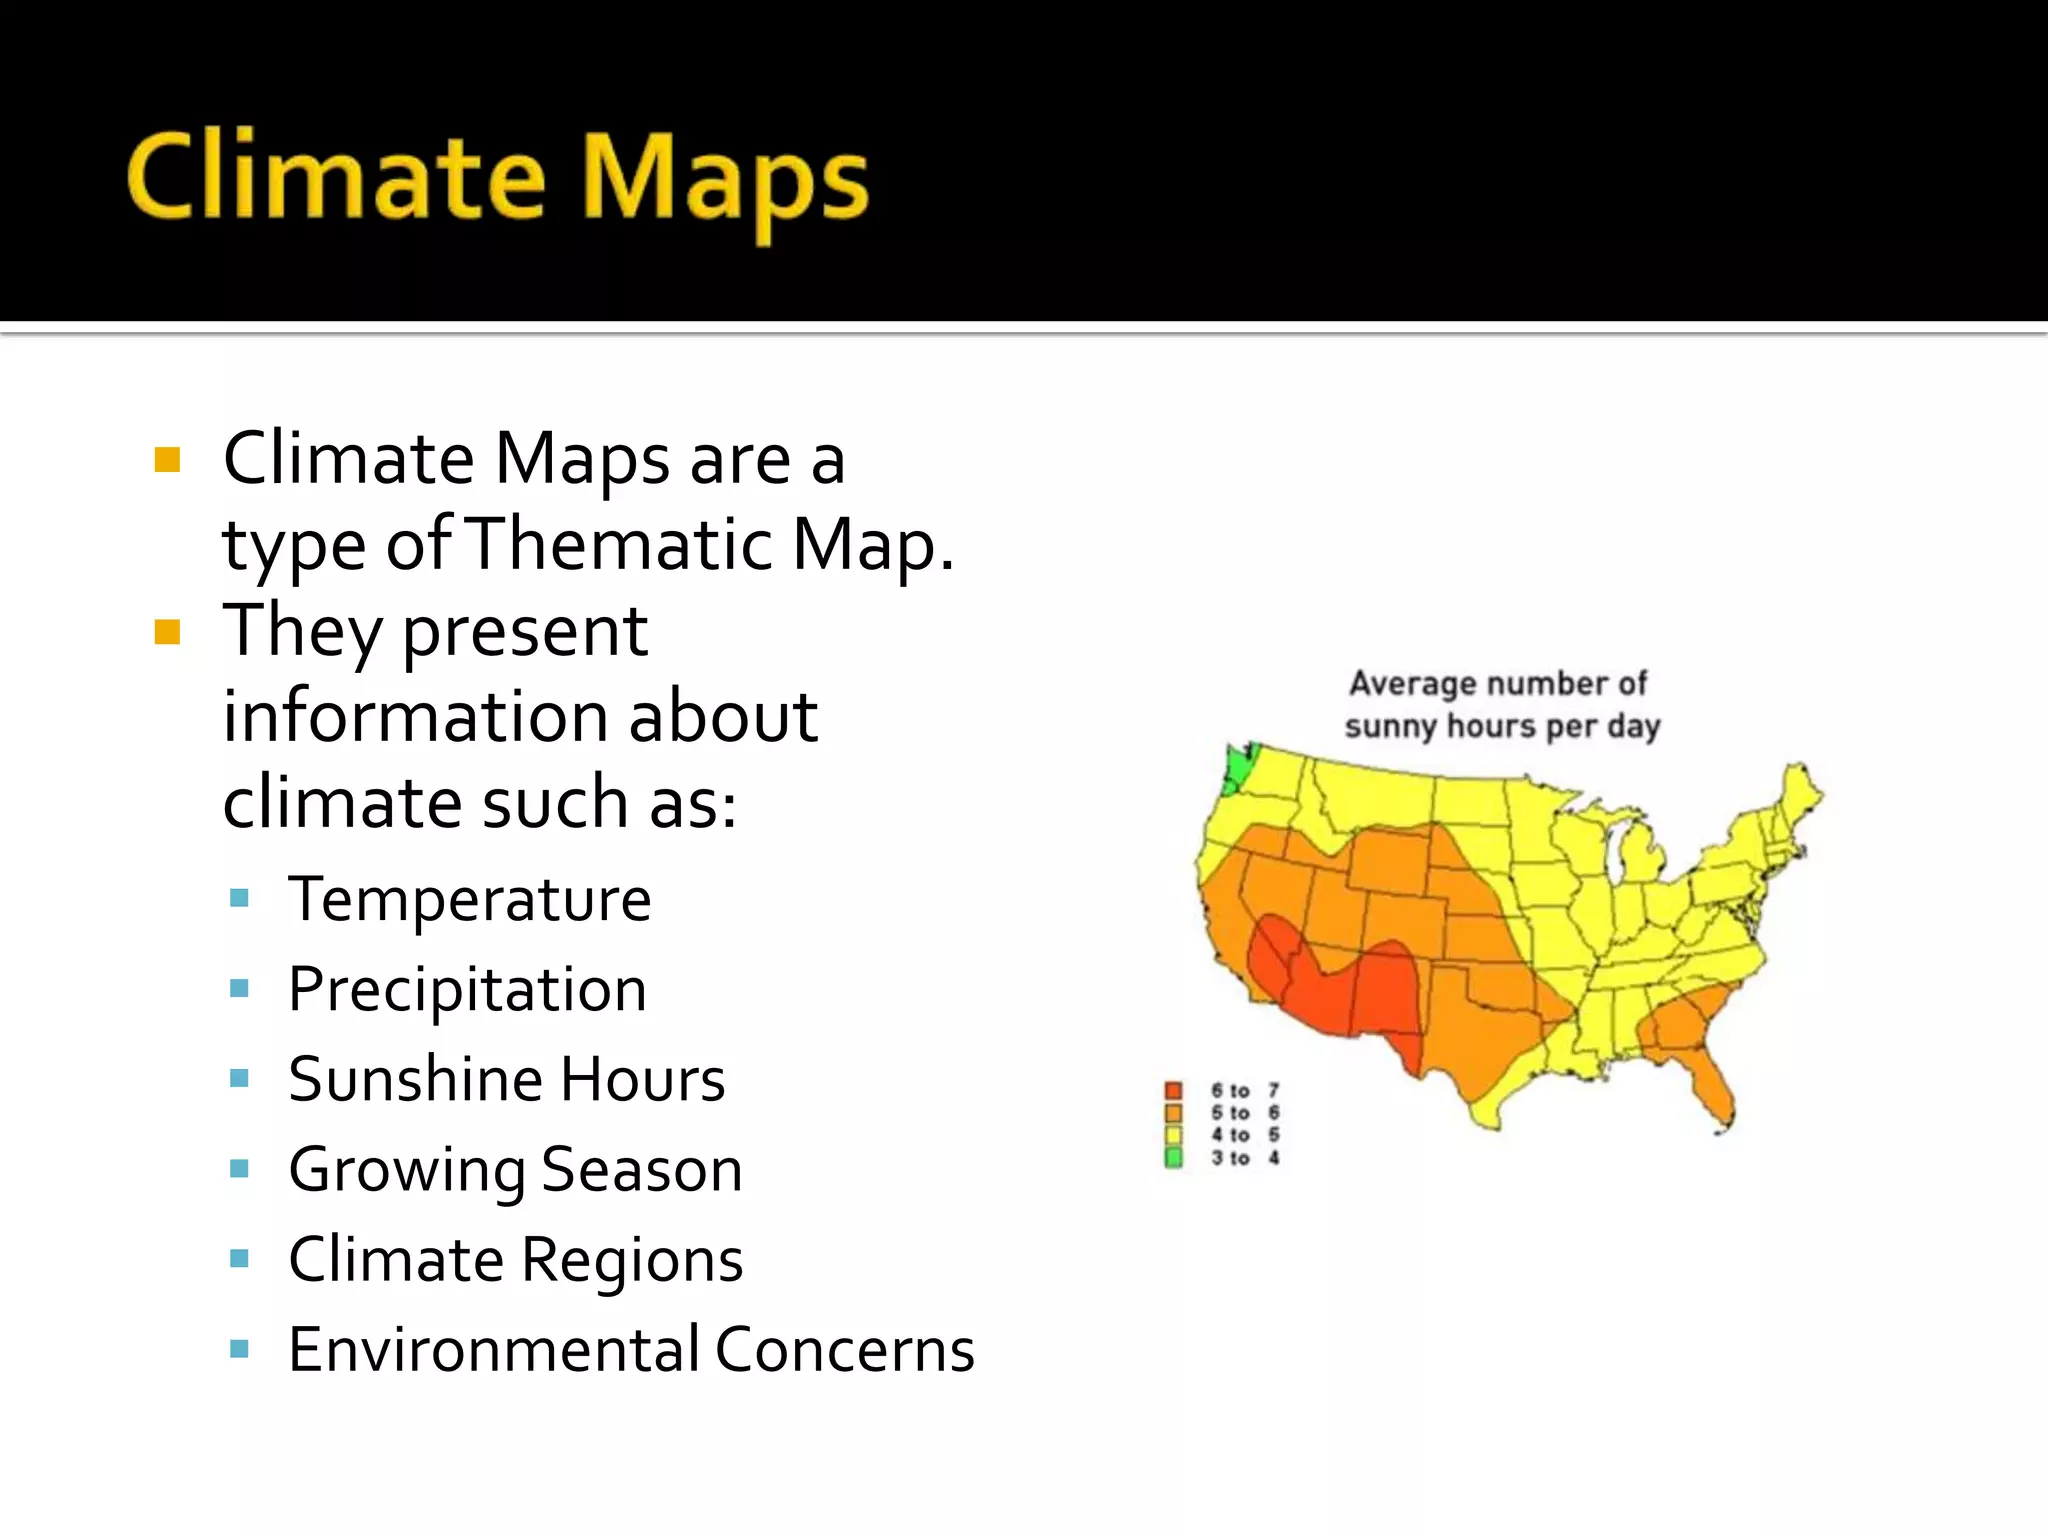


Maps represent areas of the Earth's surface and provide information like place names, land features, and boundaries. Maps usually have North at the top and use symbols in legends to label features clearly. There are physical maps of natural areas and political maps of borders. Thematic maps focus on specific themes like climate, vegetation, or population. Modern maps use satellite data to be highly accurate.