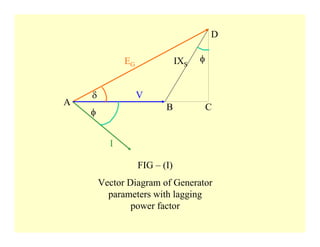
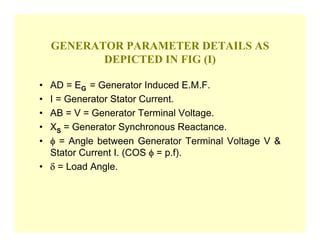
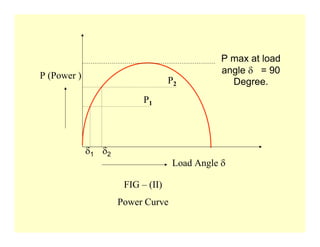
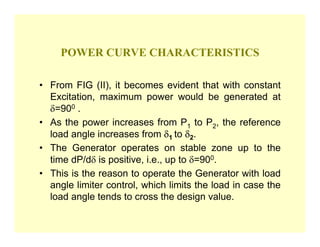
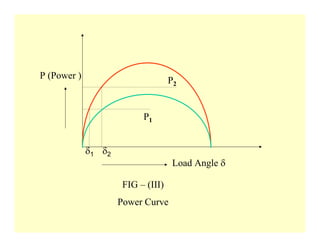
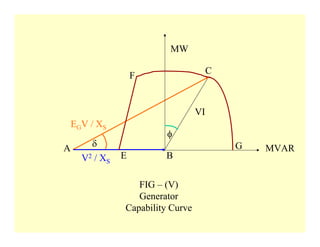
IMPLICATIONS OF LOAD ANGLE &
EXCITATION ON GENERATOR STABILITY,
    SIGNIFICANCE OF GENERATOR
         CAPABILITY CURVE


          PREPARED BY: -
           KUNAL GUPTA
            DGM(EMD)
WHAT IS LOAD ANGLE ?

• Load Angle δ is the angle between the Generator induced
  E.M.F & Generator terminal voltage.
• Physically, this is the angle by which the reference line
  made on the Generator shaft front deviates from no load-
  to-load condition.
D

              EG               IXS   φ


    δ              V
A                         B              C
    φ


          I

                   FIG – (I)
        Vector Diagram of Generator
          parameters with lagging
                power factor
GENERATOR PARAMETER DETAILS AS
           DEPICTED IN FIG (I)

• AD = EG = Generator Induced E.M.F.
• I = Generator Stator Current.
• AB = V = Generator Terminal Voltage.
• XS = Generator Synchronous Reactance.
• φ = Angle between Generator Terminal Voltage V &
  Stator Current I. (COS φ = p.f).
• δ = Load Angle.
EQUATION OF POWER CURVE

• CD = IX S COS φ = E G SIN δ -------(i)
• Active Power P = VI COS φ = VE G SIN δ (From i
  above)                                  XS
• From above, it becomes clear that the power curve
  with reference to excitation shall be a sinusoidal one
  as EG is proportional to Generator Excitation.
• BC = IX S SIN φ = E G COS δ __ V -------(ii)
• Reactive Power Q = VI SIN φ        = VE G COS δ / XS
  __ V 2 / XS (From ii above)
• It is apparent that Reactive Power Q shall be equal to
  ( __ V 2 / XS ) when EG = 0.
P max at load
                                               angle δ = 90
P (Power )                         P2            Degree.
                           P1


             δ1 δ2
                                    Load Angle δ

                      FIG – (II)
                     Power Curve
POWER CURVE CHARACTERISTICS

• From FIG (II), it becomes evident that with constant
  Excitation, maximum power would be generated at
  δ=900 .
• As the power increases from P1 to P2, the reference
  load angle increases from δ1 to δ2.
• The Generator operates on stable zone up to the
  time dP/dδ is positive, i.e., up to δ=900.
• This is the reason to operate the Generator with load
  angle limiter control, which limits the load in case the
  load angle tends to cross the design value.
P (Power )                          P2


                           P1


             δ1 δ2
                                     Load Angle δ

                      FIG – (III)
                     Power Curve
POWER CURVE CHARACTERISTICS

• From FIG (III), it is quite clear that with constant
  power generation P1, if the excitation is boosted up,
  then load angle shall reduce from δ2 to δ1.
• Also, with same load angle δ2, power generation
  increment is possible from P1 to P2 with boosting up
  of excitation.
• As changing Generator Excitation is done primarily
  by A.V.R, the load angle at which the Generator is
  safe to operate is determined by the A.V.R response.
• With fast acting A.V.R, Generator can be operated at
  higher load angle & vice versa.
• However, boosting up of excitation shall be limited to
  the design value only.
D

                             φ
    EG           I     IXS
        δ

    φ           V
A                                B
            C


                FIG – (IV)
     Vector Diagram of Generator
    parameters with leading power
                factor
EFFECT OF NEGATIVE REACTIVE POWER
           ON GENERATOR

• From FIG (IV), it is evident that EG reduces when
  stator current I leads the terminal voltage V. This is
  the situation when the Generator is subjected to
  negative reactive MVAR.
• In such case, Grid no longer require MVAR from
  Generator, rather it exports MVAR to the connected
  machines, causing reduction of Generator excitation.
• As it is shown in FIG (III) that for constant power,
  reduction of EG means increase in load angle δ, the
  capability of the Generator to absorb reactive MVAR
  at a particular load is subjected to load angle
  limitation.
MW

                                         C
                     F


                                    VI
    EGV / XS
                           φ
A        δ                                   G   MVAR
      V 2 / XS   E        B


                    FIG – (V)
                    Generator
                 Capability Curve
GENERATOR CAPABILITY CURVE
• By multiplying FIG (I) by V / XS, we do arrive at FIG (V).
• EFCG depicts the Generator capability curve.
• Load angle limiter limits the negative reactive MVAR as
  shown by the line EF.
• Rotor current limiter limits the rotor current & is
  depicted by CG which is the arc of AC with A as center
  & is proportional to Generator excitation as well as the
  rotor current.
• Stator current limiter limits the stator current as shown
  by FC, which is the arc of BC with B as center & is
  proportional to stator current.
• All these limiters ensure that the Generator, at any
  point of time, operates within the framework EFCG for
  electrical as well as thermal stability of the machine.
Generator capability curve

Generator capability curve

  • 1.
    IMPLICATIONS OF LOADANGLE & EXCITATION ON GENERATOR STABILITY, SIGNIFICANCE OF GENERATOR CAPABILITY CURVE PREPARED BY: - KUNAL GUPTA DGM(EMD)
  • 2.
    WHAT IS LOADANGLE ? • Load Angle δ is the angle between the Generator induced E.M.F & Generator terminal voltage. • Physically, this is the angle by which the reference line made on the Generator shaft front deviates from no load- to-load condition.
  • 3.
    D EG IXS φ δ V A B C φ I FIG – (I) Vector Diagram of Generator parameters with lagging power factor
  • 4.
    GENERATOR PARAMETER DETAILSAS DEPICTED IN FIG (I) • AD = EG = Generator Induced E.M.F. • I = Generator Stator Current. • AB = V = Generator Terminal Voltage. • XS = Generator Synchronous Reactance. • φ = Angle between Generator Terminal Voltage V & Stator Current I. (COS φ = p.f). • δ = Load Angle.
  • 5.
    EQUATION OF POWERCURVE • CD = IX S COS φ = E G SIN δ -------(i) • Active Power P = VI COS φ = VE G SIN δ (From i above) XS • From above, it becomes clear that the power curve with reference to excitation shall be a sinusoidal one as EG is proportional to Generator Excitation. • BC = IX S SIN φ = E G COS δ __ V -------(ii) • Reactive Power Q = VI SIN φ = VE G COS δ / XS __ V 2 / XS (From ii above) • It is apparent that Reactive Power Q shall be equal to ( __ V 2 / XS ) when EG = 0.
  • 6.
    P max atload angle δ = 90 P (Power ) P2 Degree. P1 δ1 δ2 Load Angle δ FIG – (II) Power Curve
  • 7.
    POWER CURVE CHARACTERISTICS •From FIG (II), it becomes evident that with constant Excitation, maximum power would be generated at δ=900 . • As the power increases from P1 to P2, the reference load angle increases from δ1 to δ2. • The Generator operates on stable zone up to the time dP/dδ is positive, i.e., up to δ=900. • This is the reason to operate the Generator with load angle limiter control, which limits the load in case the load angle tends to cross the design value.
  • 8.
    P (Power ) P2 P1 δ1 δ2 Load Angle δ FIG – (III) Power Curve
  • 9.
    POWER CURVE CHARACTERISTICS •From FIG (III), it is quite clear that with constant power generation P1, if the excitation is boosted up, then load angle shall reduce from δ2 to δ1. • Also, with same load angle δ2, power generation increment is possible from P1 to P2 with boosting up of excitation. • As changing Generator Excitation is done primarily by A.V.R, the load angle at which the Generator is safe to operate is determined by the A.V.R response. • With fast acting A.V.R, Generator can be operated at higher load angle & vice versa. • However, boosting up of excitation shall be limited to the design value only.
  • 10.
    D φ EG I IXS δ φ V A B C FIG – (IV) Vector Diagram of Generator parameters with leading power factor
  • 11.
    EFFECT OF NEGATIVEREACTIVE POWER ON GENERATOR • From FIG (IV), it is evident that EG reduces when stator current I leads the terminal voltage V. This is the situation when the Generator is subjected to negative reactive MVAR. • In such case, Grid no longer require MVAR from Generator, rather it exports MVAR to the connected machines, causing reduction of Generator excitation. • As it is shown in FIG (III) that for constant power, reduction of EG means increase in load angle δ, the capability of the Generator to absorb reactive MVAR at a particular load is subjected to load angle limitation.
  • 12.
    MW C F VI EGV / XS φ A δ G MVAR V 2 / XS E B FIG – (V) Generator Capability Curve
  • 13.
    GENERATOR CAPABILITY CURVE •By multiplying FIG (I) by V / XS, we do arrive at FIG (V). • EFCG depicts the Generator capability curve. • Load angle limiter limits the negative reactive MVAR as shown by the line EF. • Rotor current limiter limits the rotor current & is depicted by CG which is the arc of AC with A as center & is proportional to Generator excitation as well as the rotor current. • Stator current limiter limits the stator current as shown by FC, which is the arc of BC with B as center & is proportional to stator current. • All these limiters ensure that the Generator, at any point of time, operates within the framework EFCG for electrical as well as thermal stability of the machine.