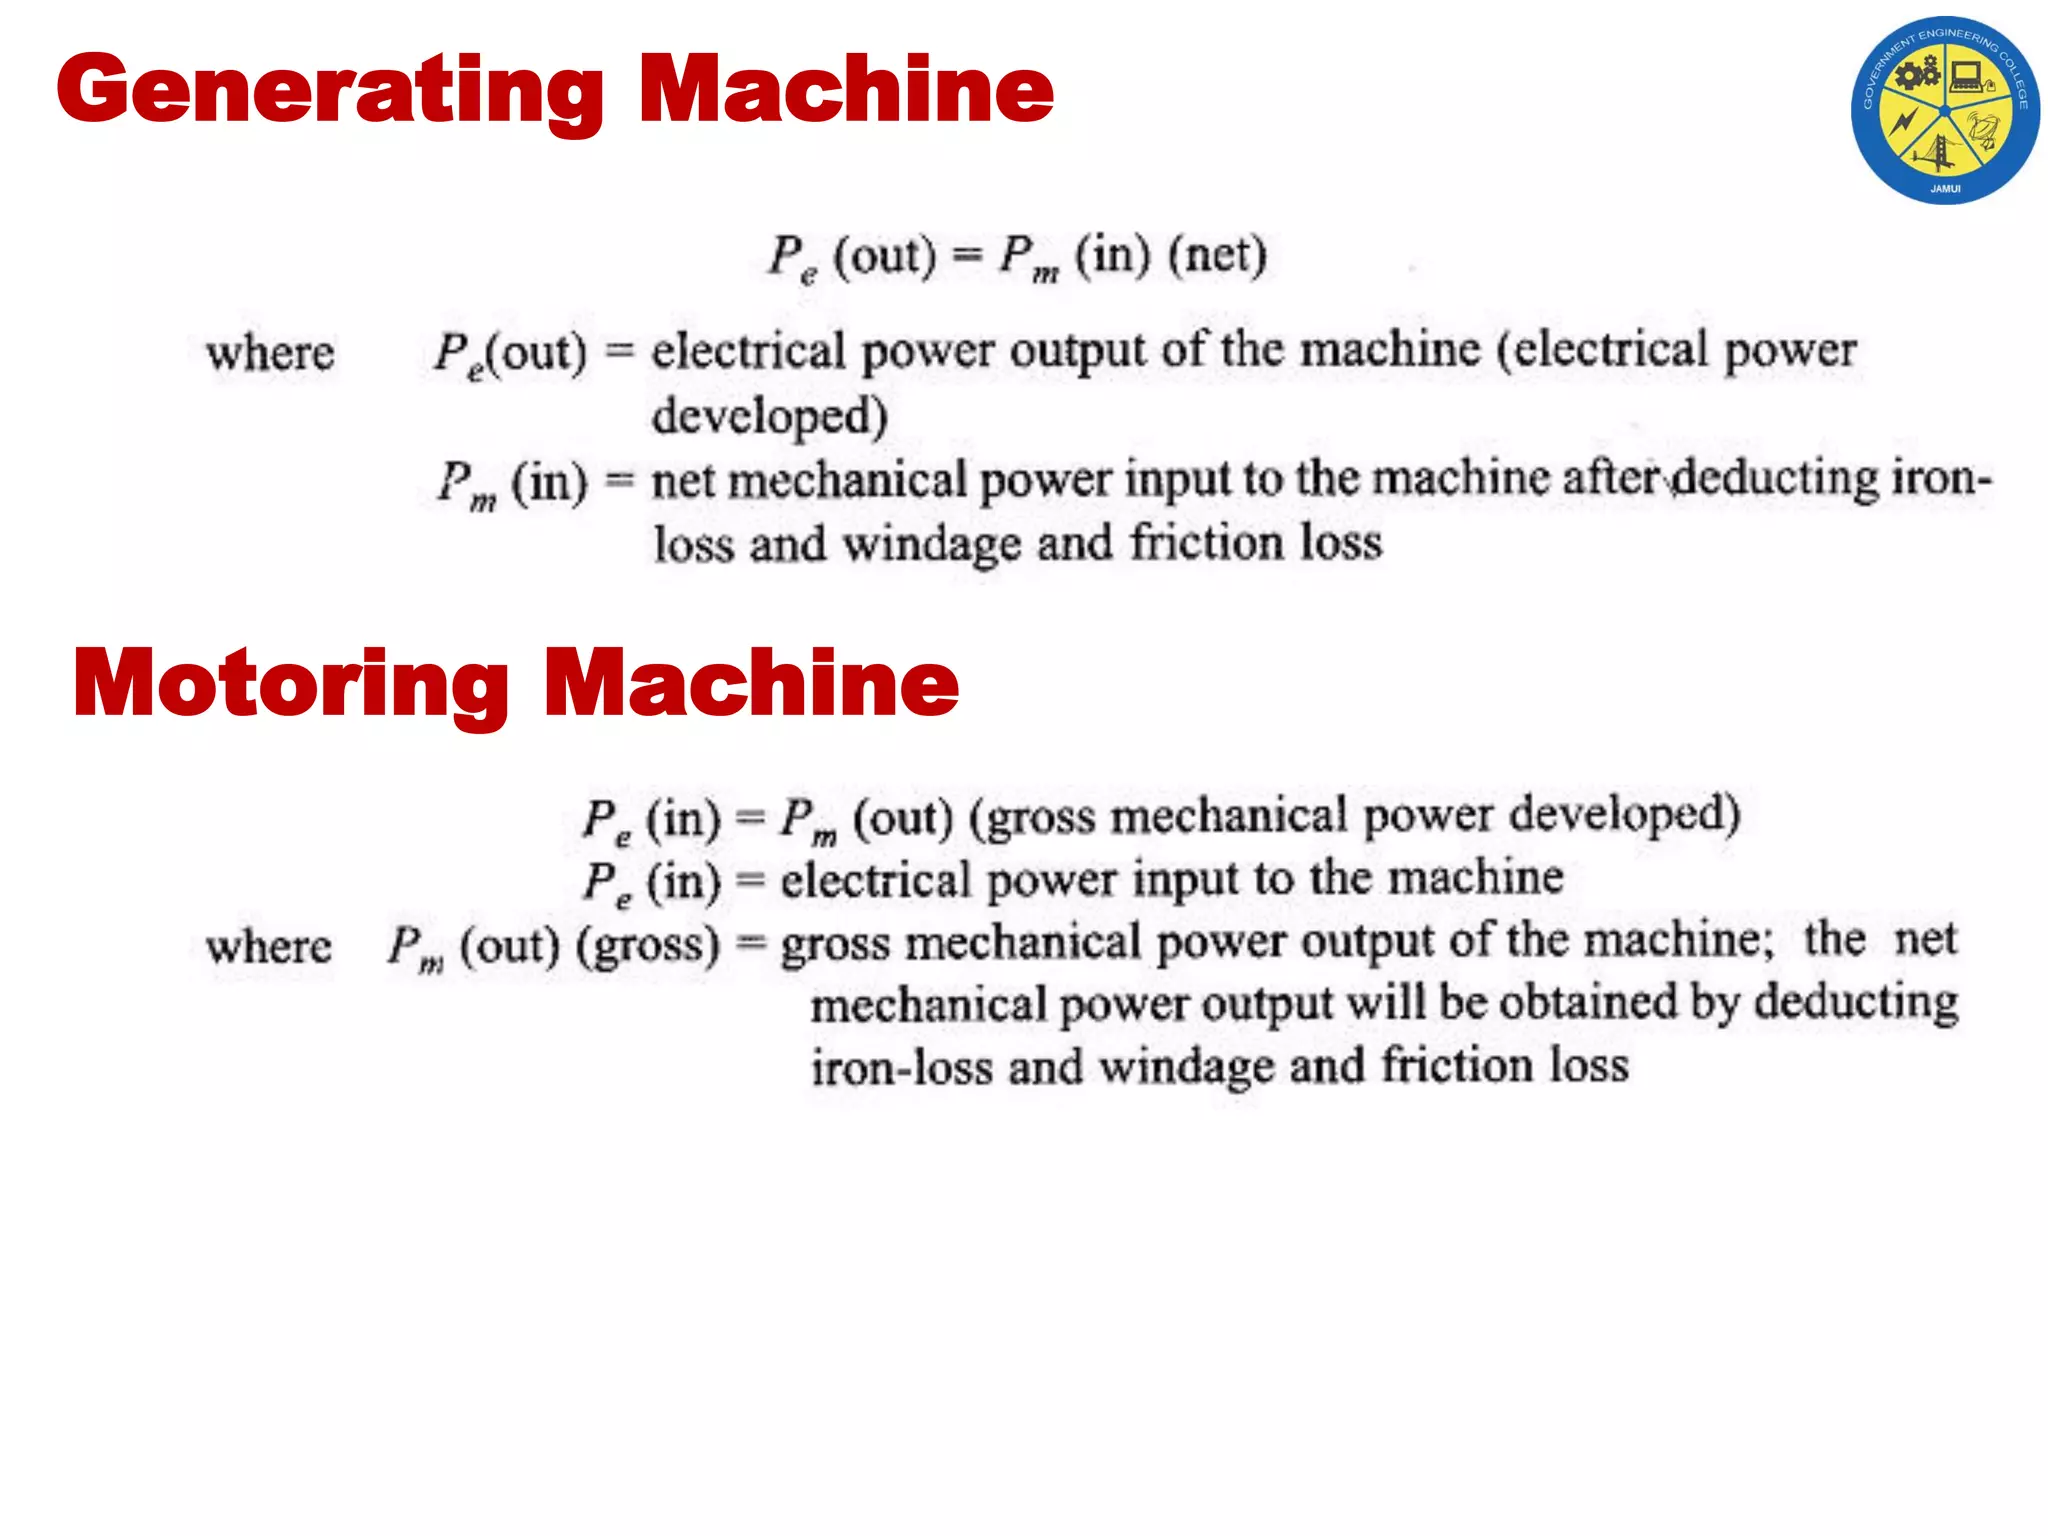
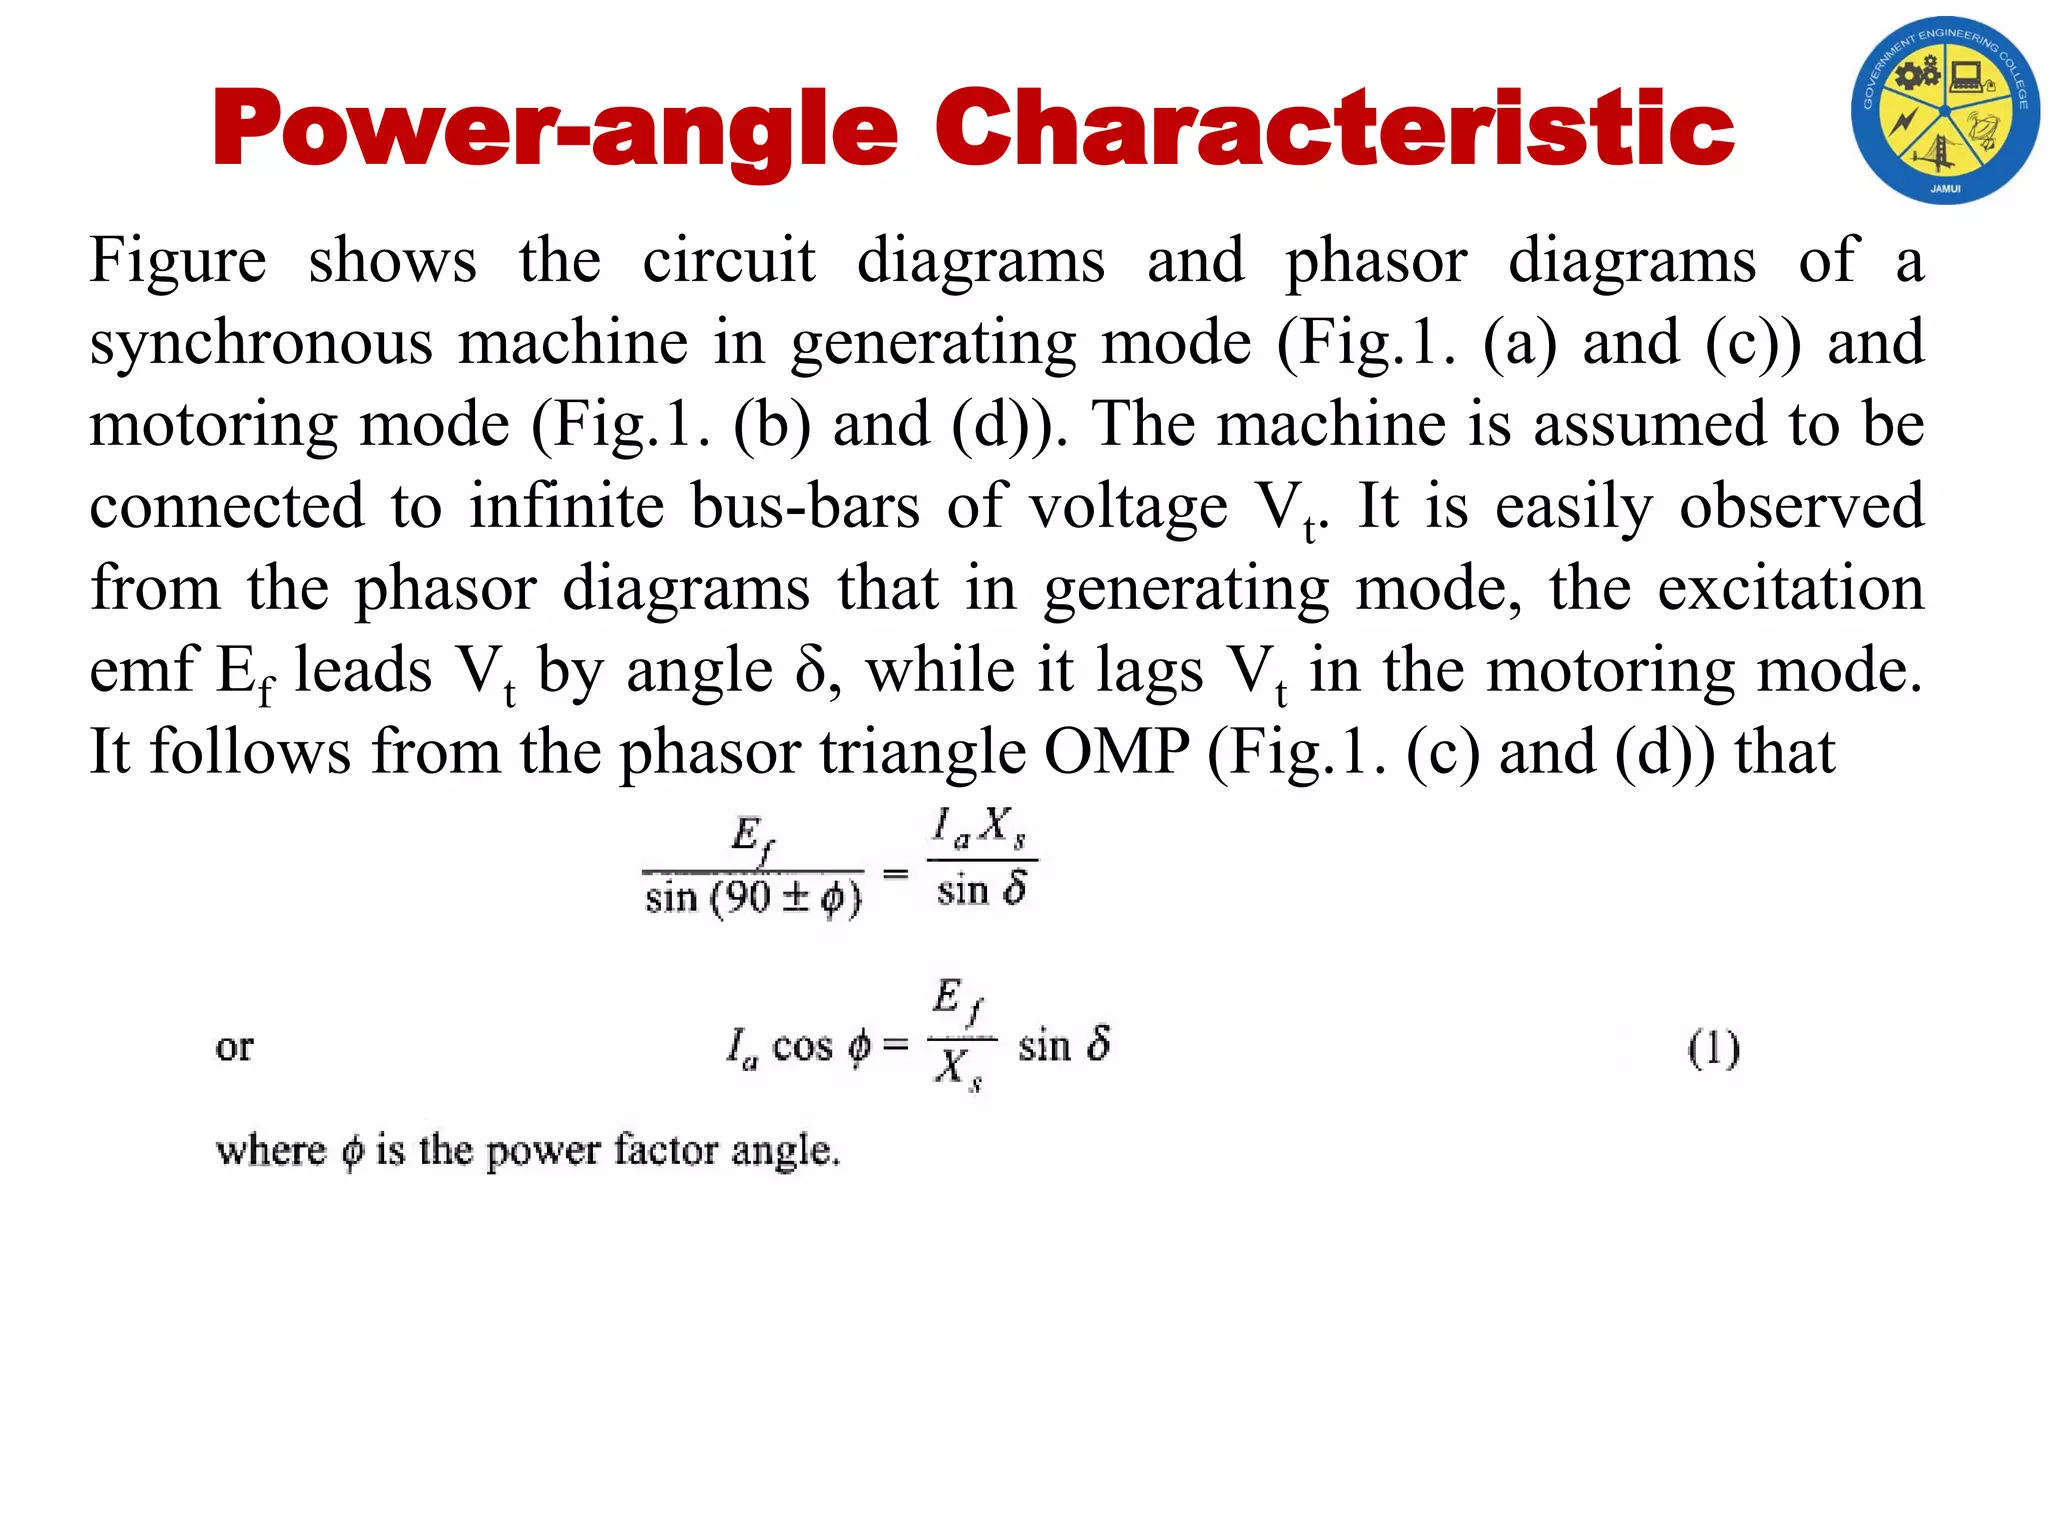
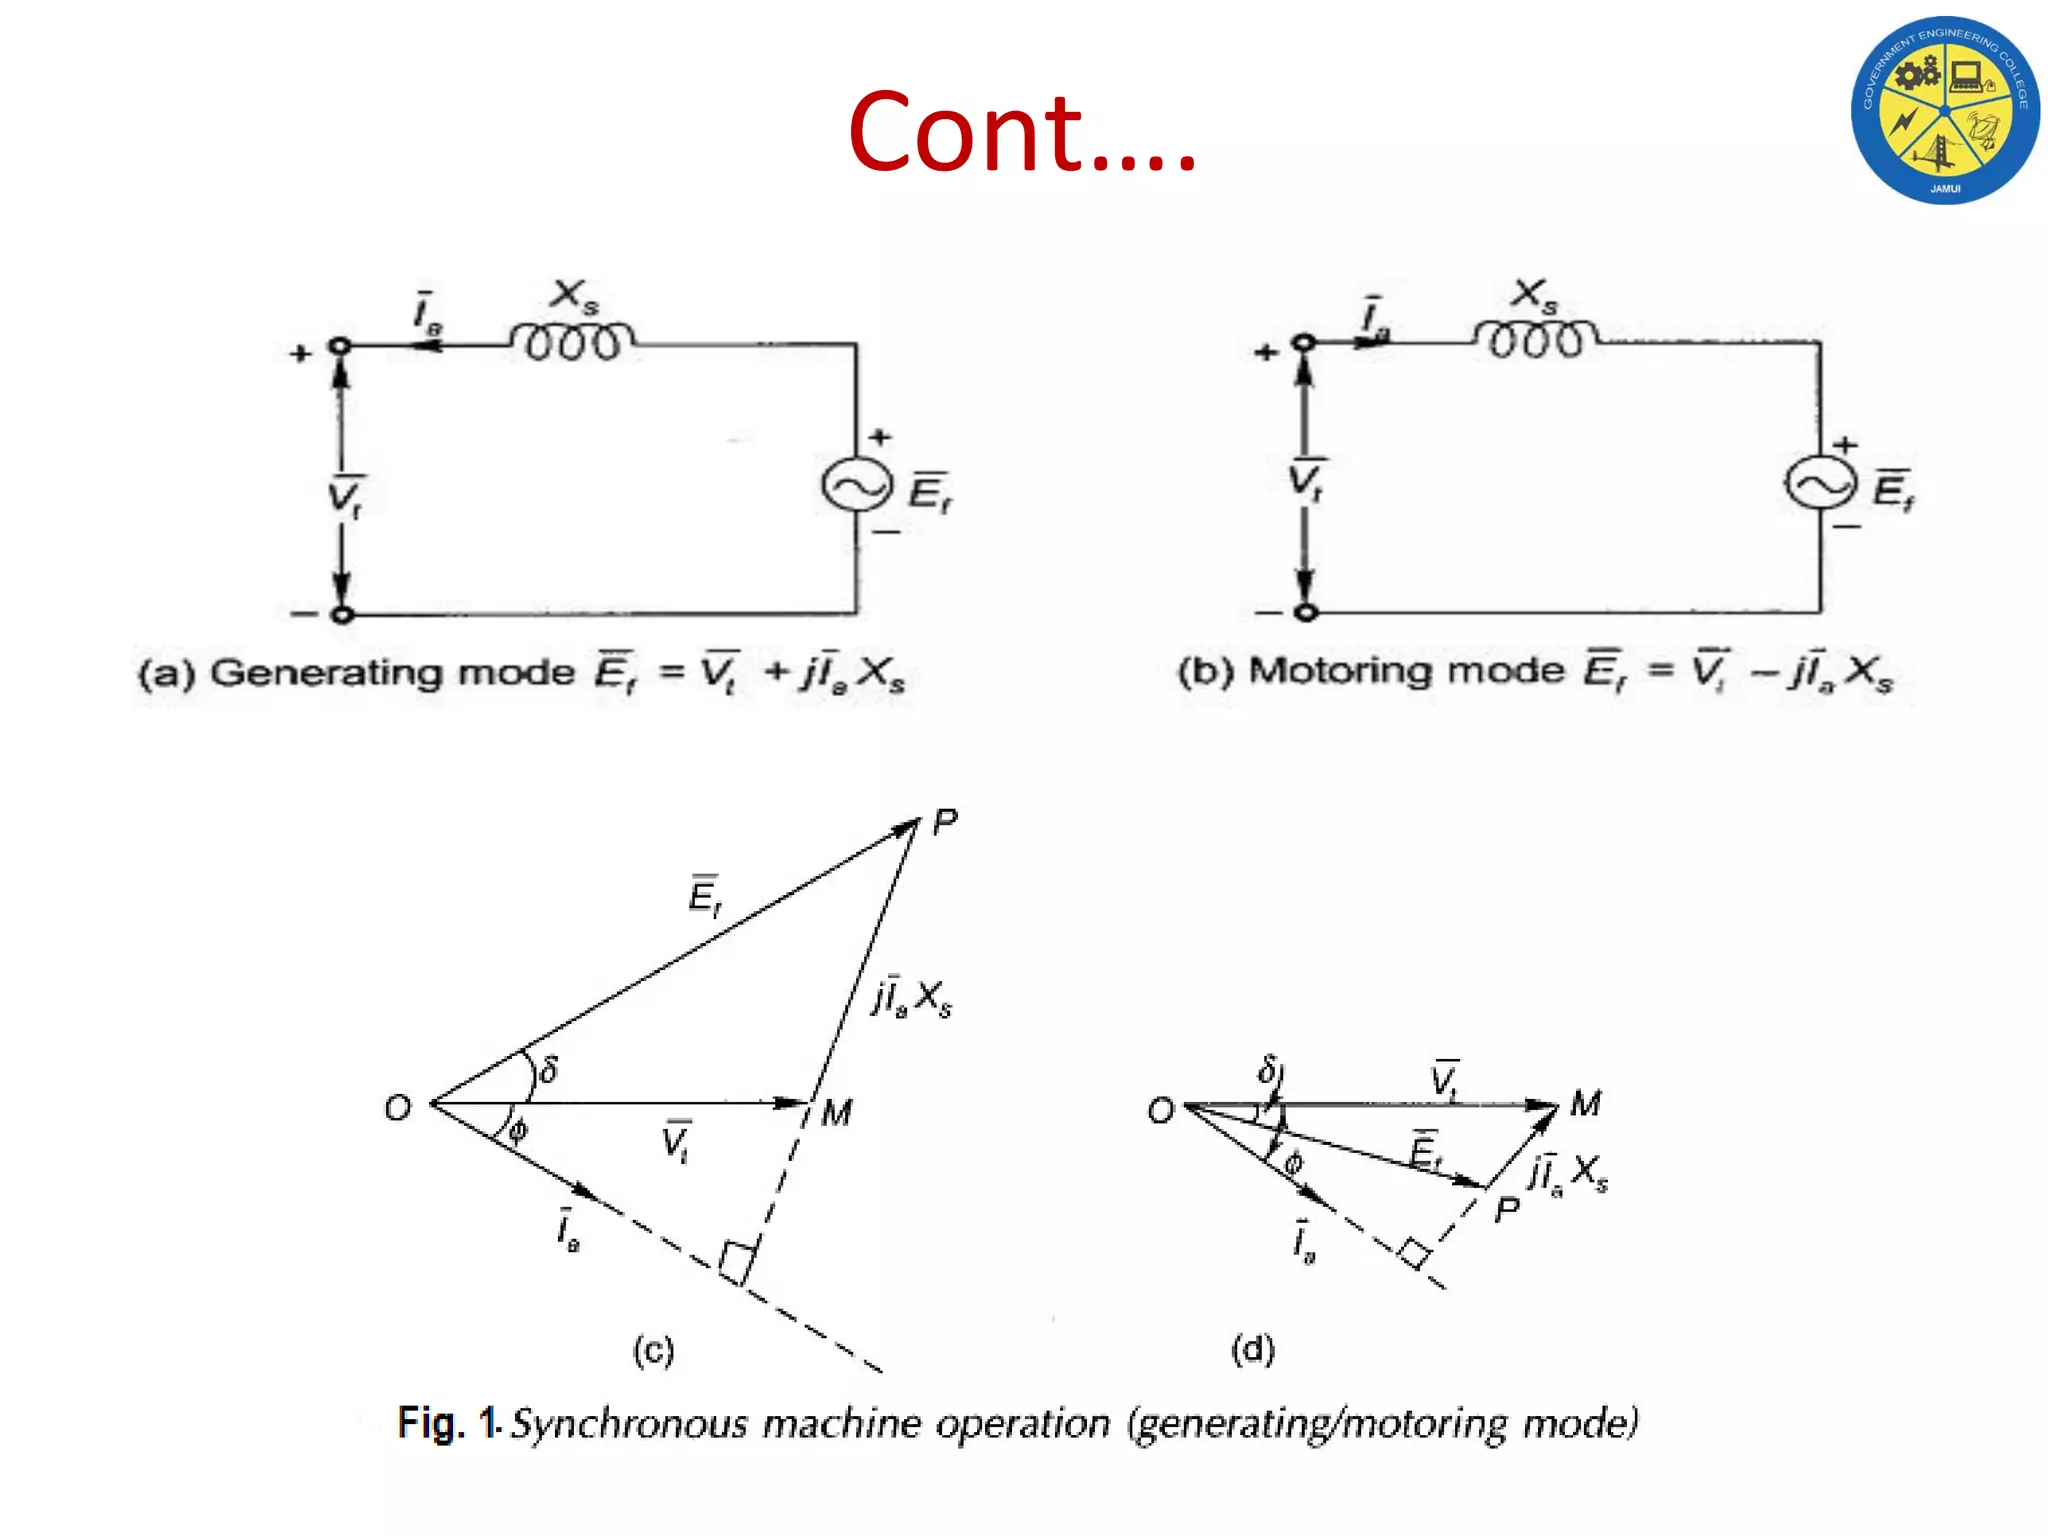
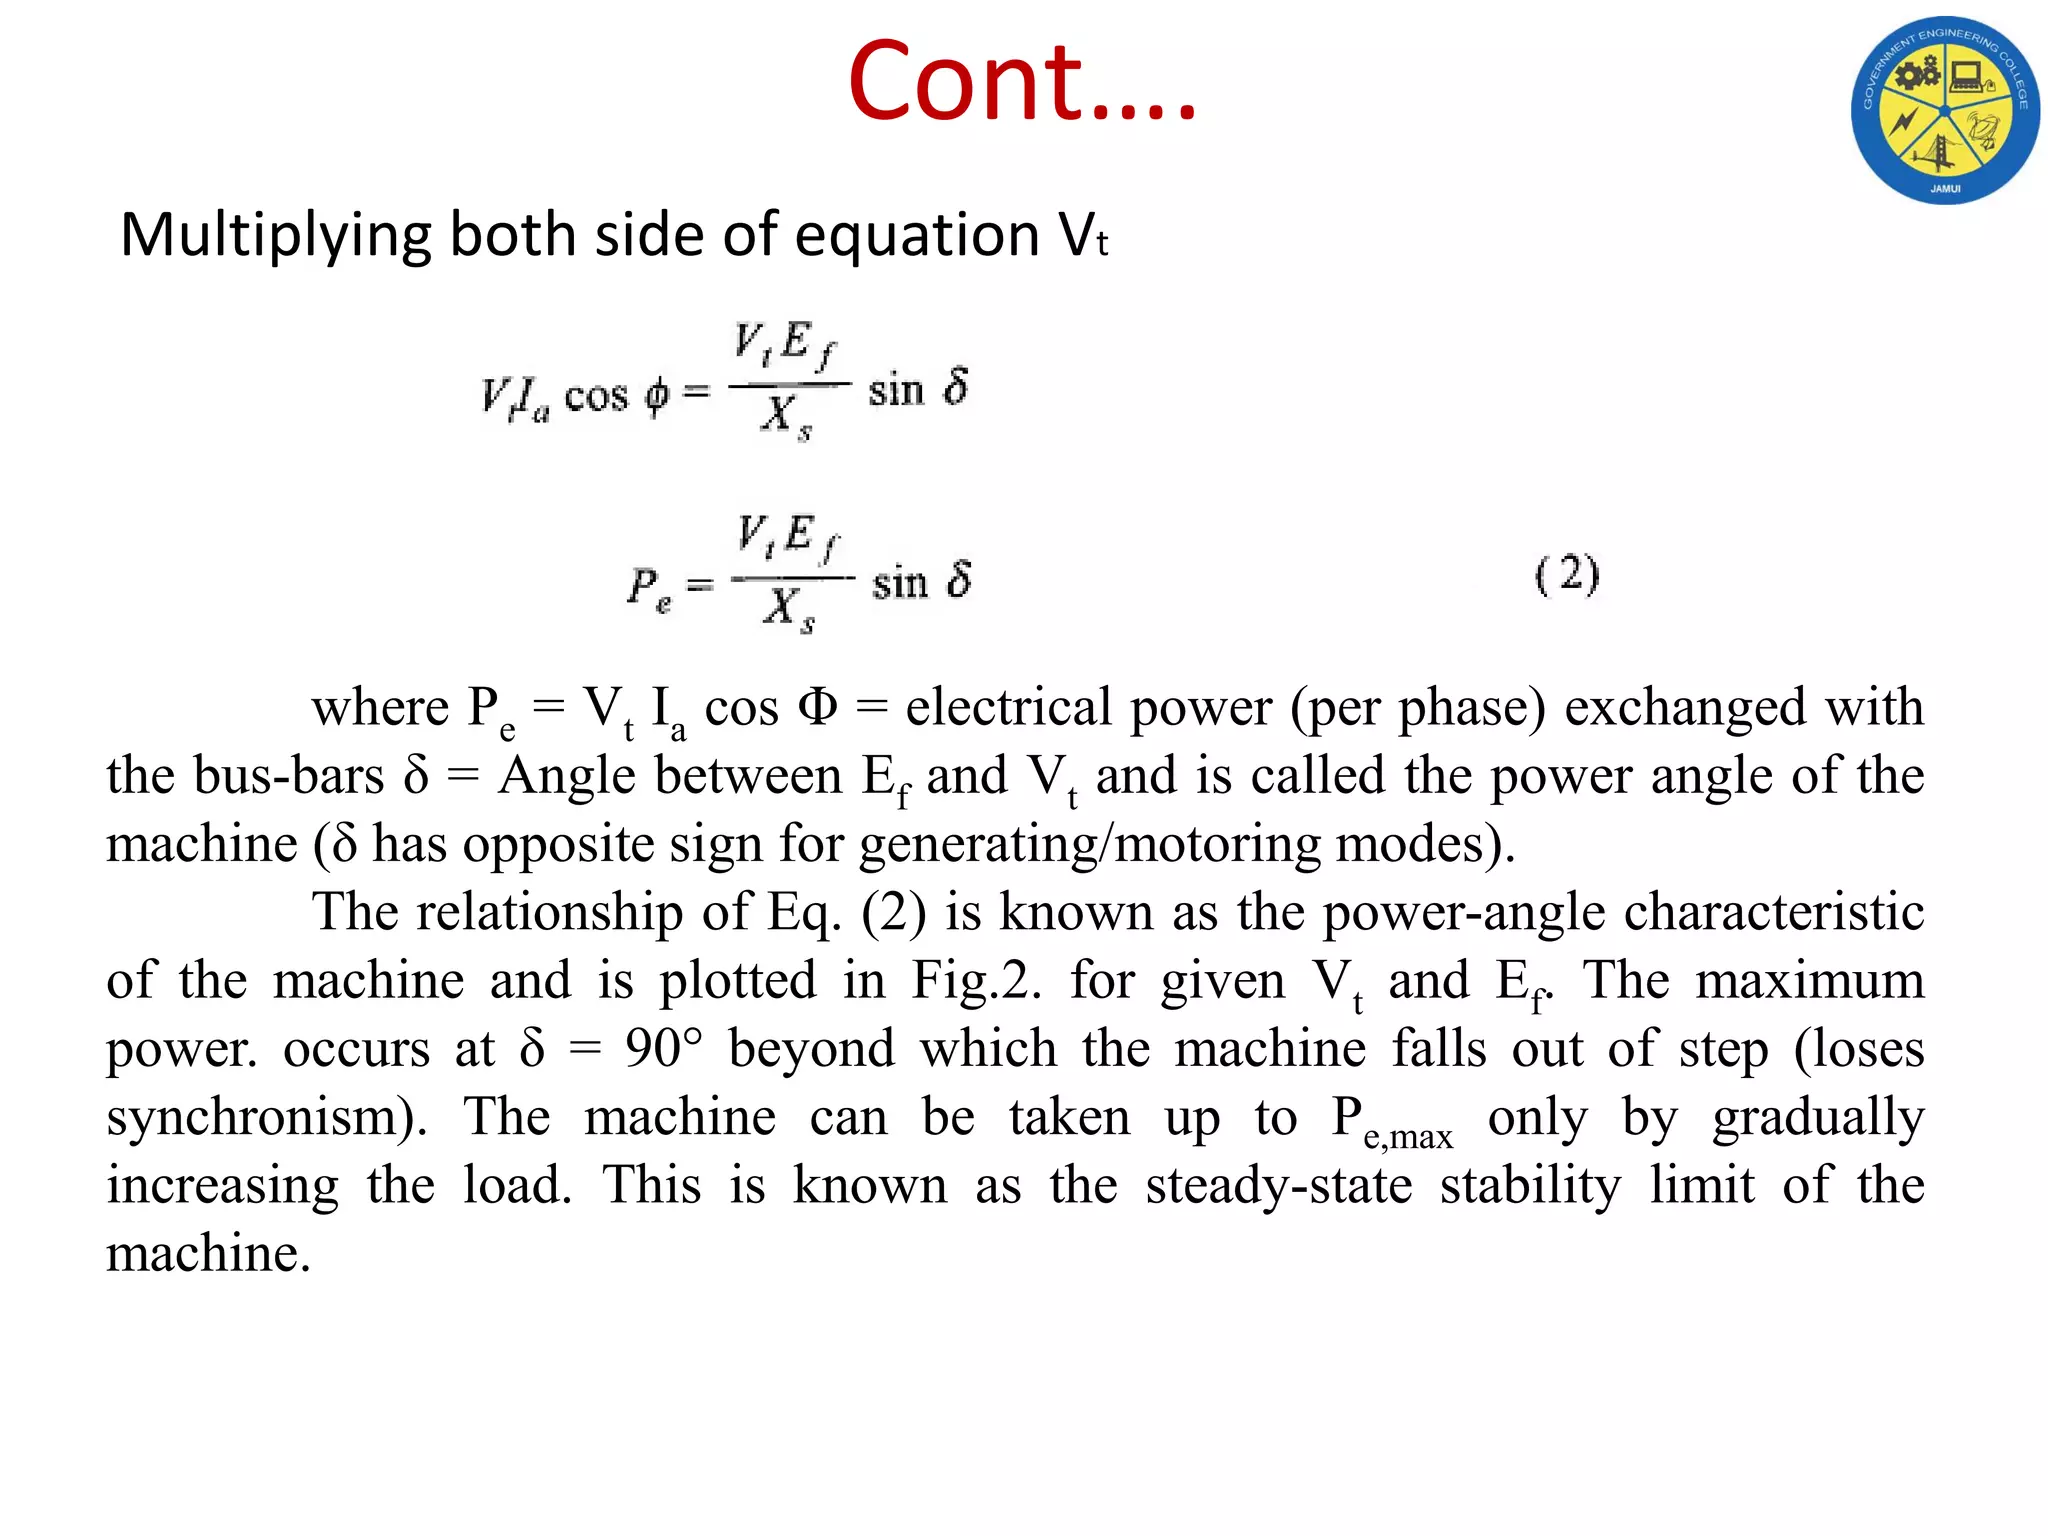
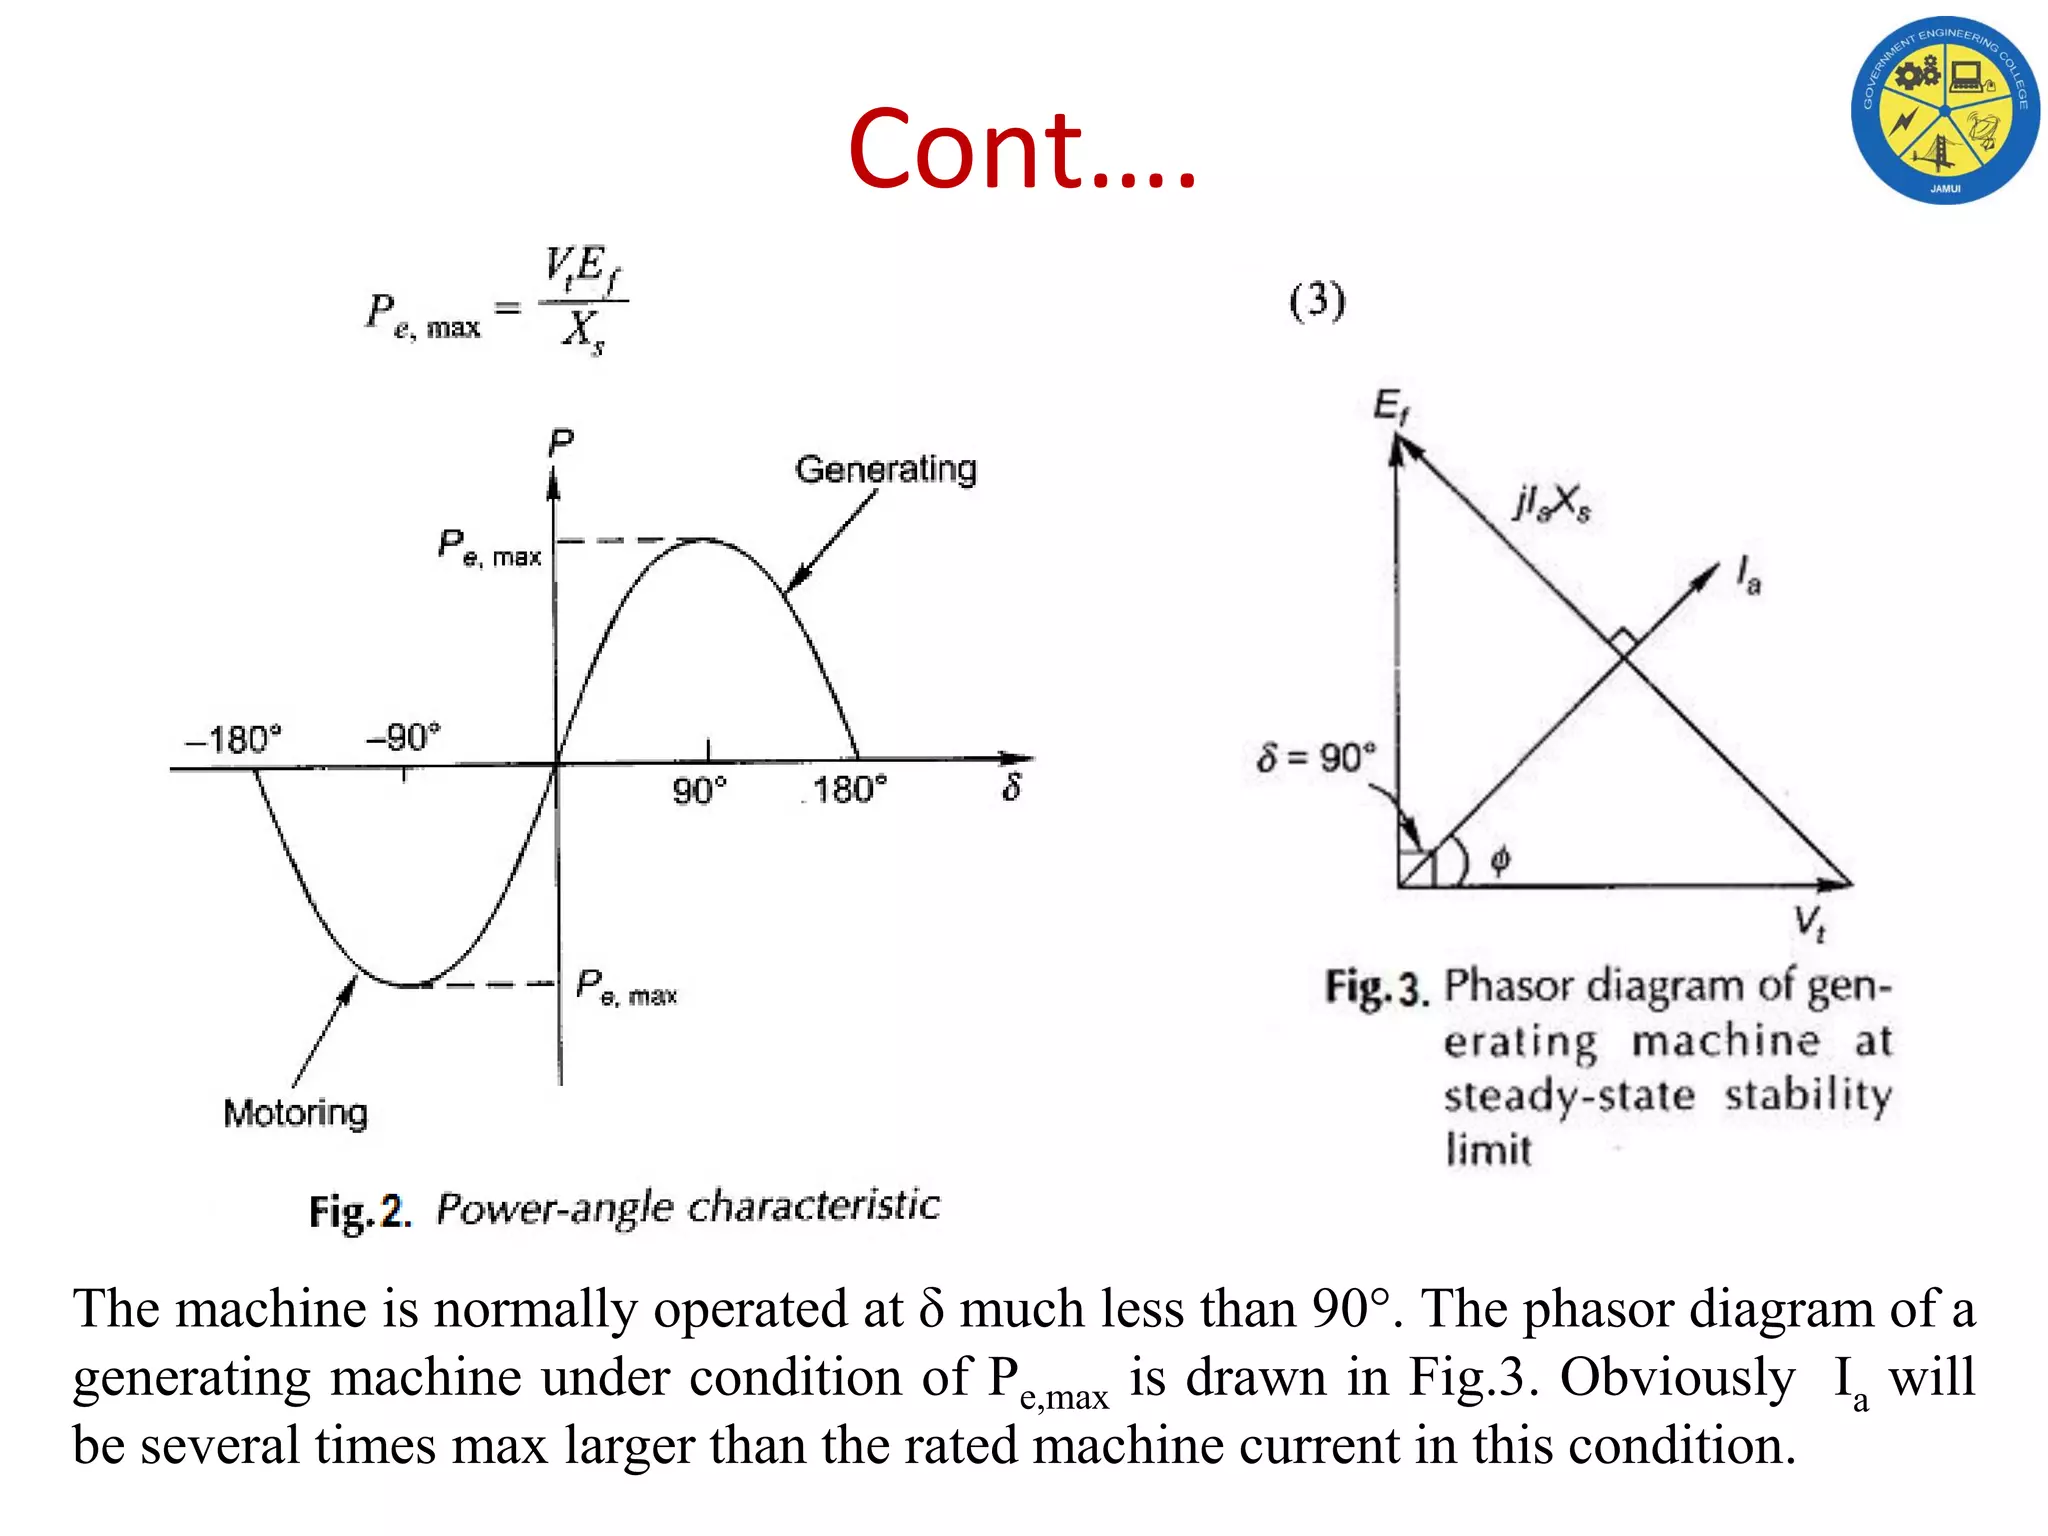
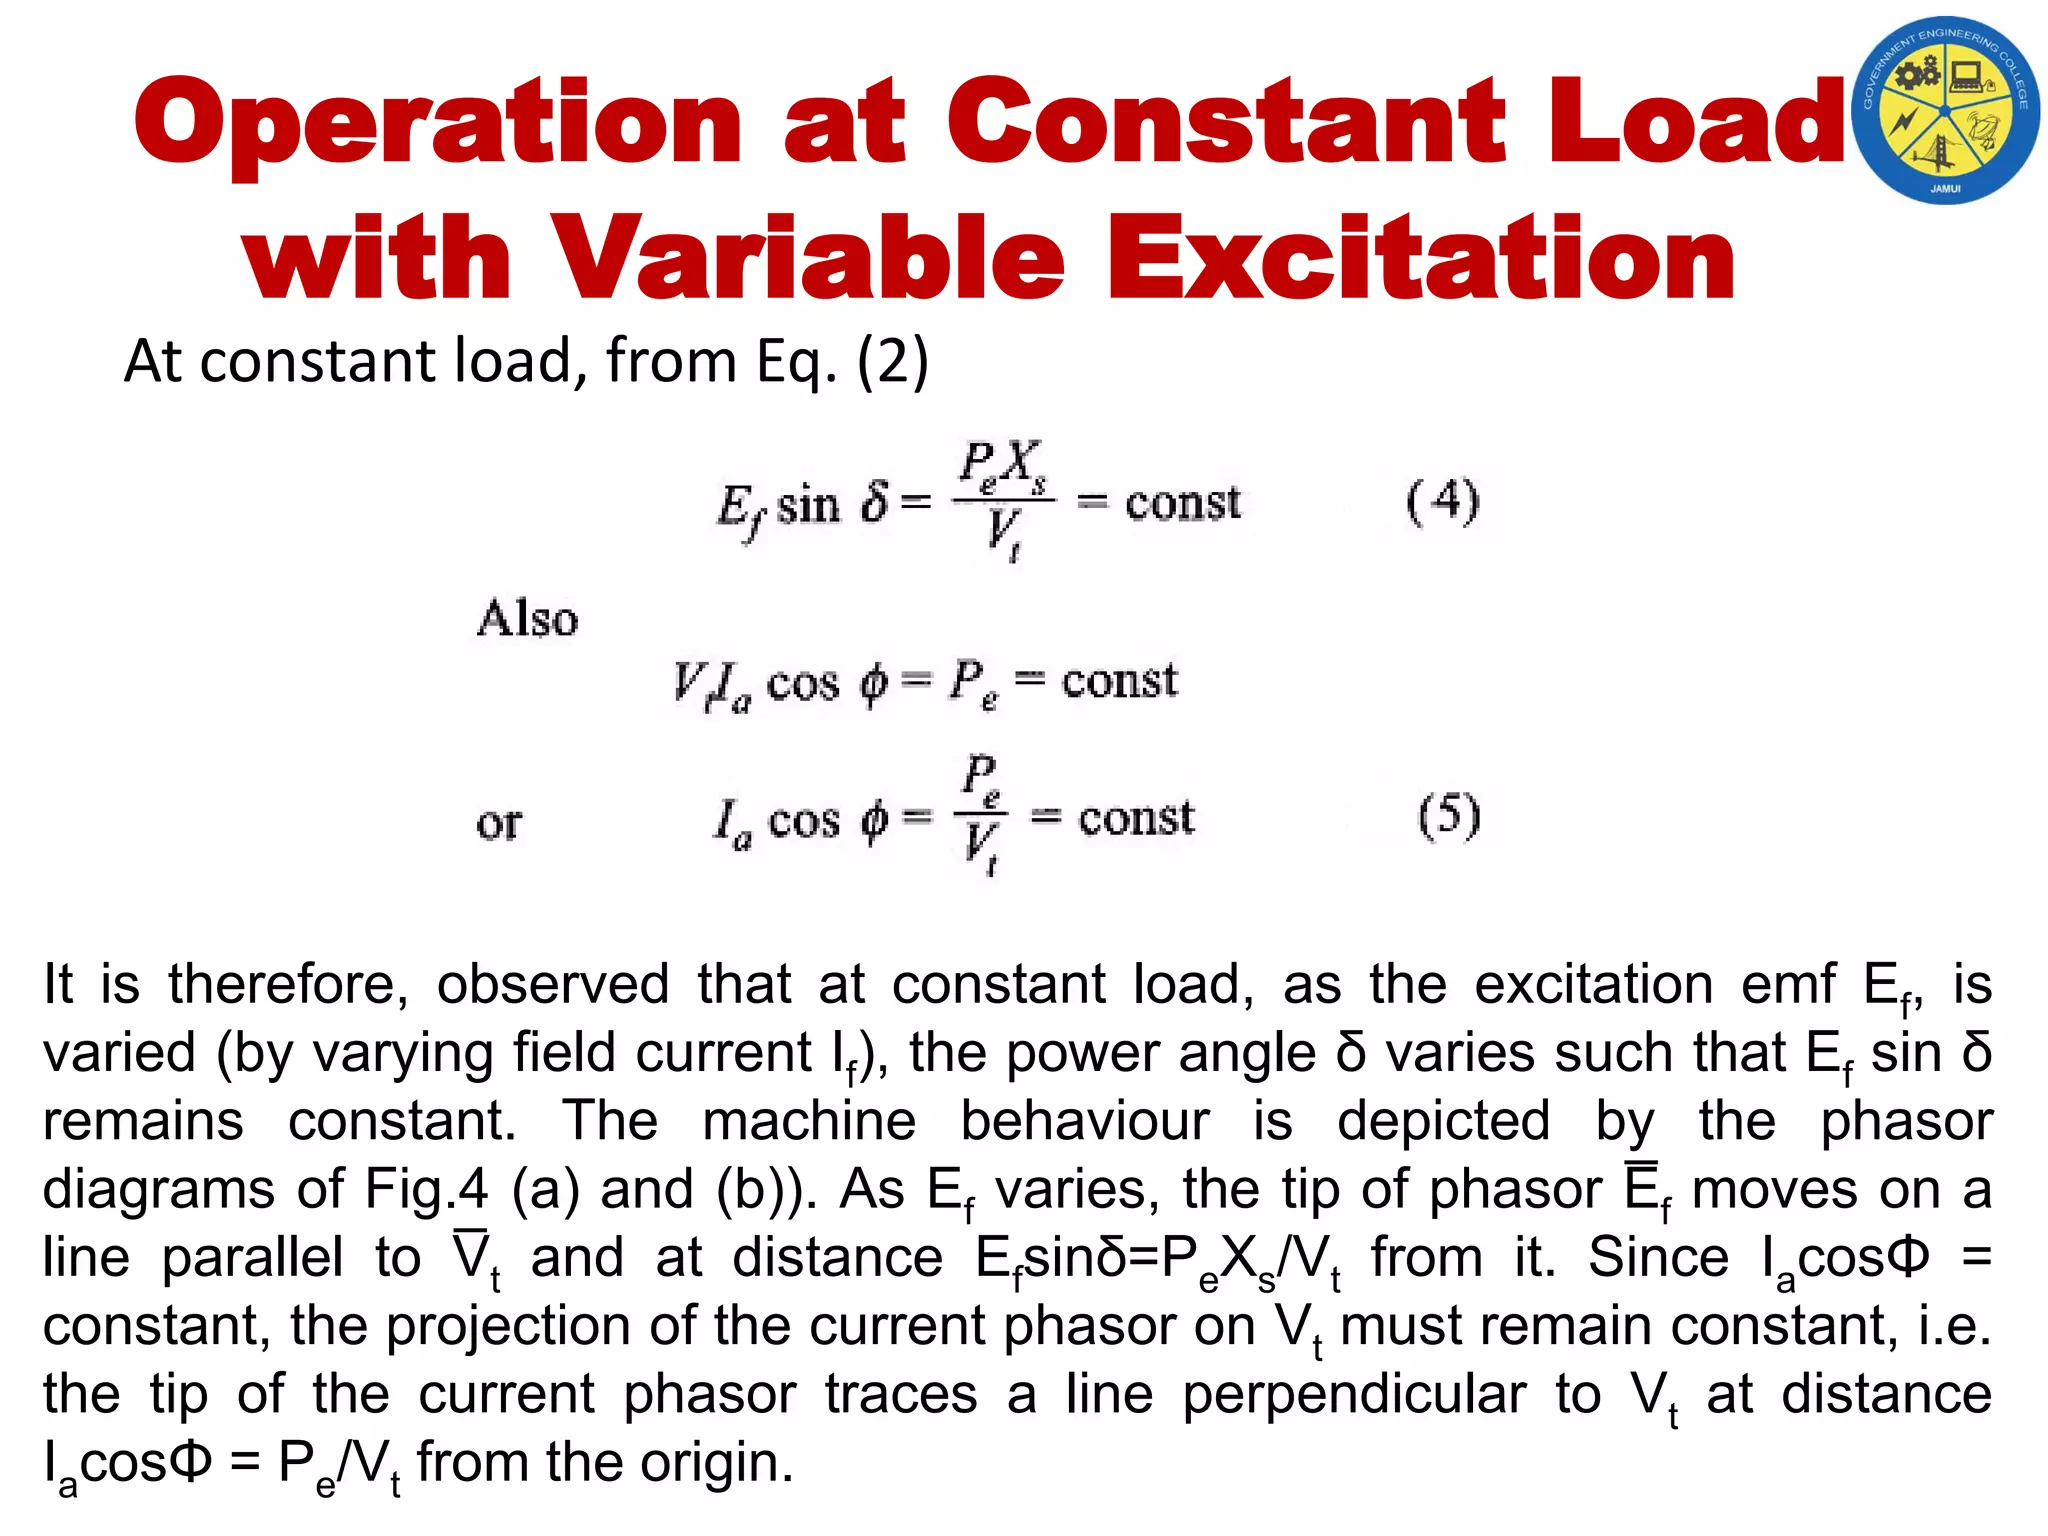
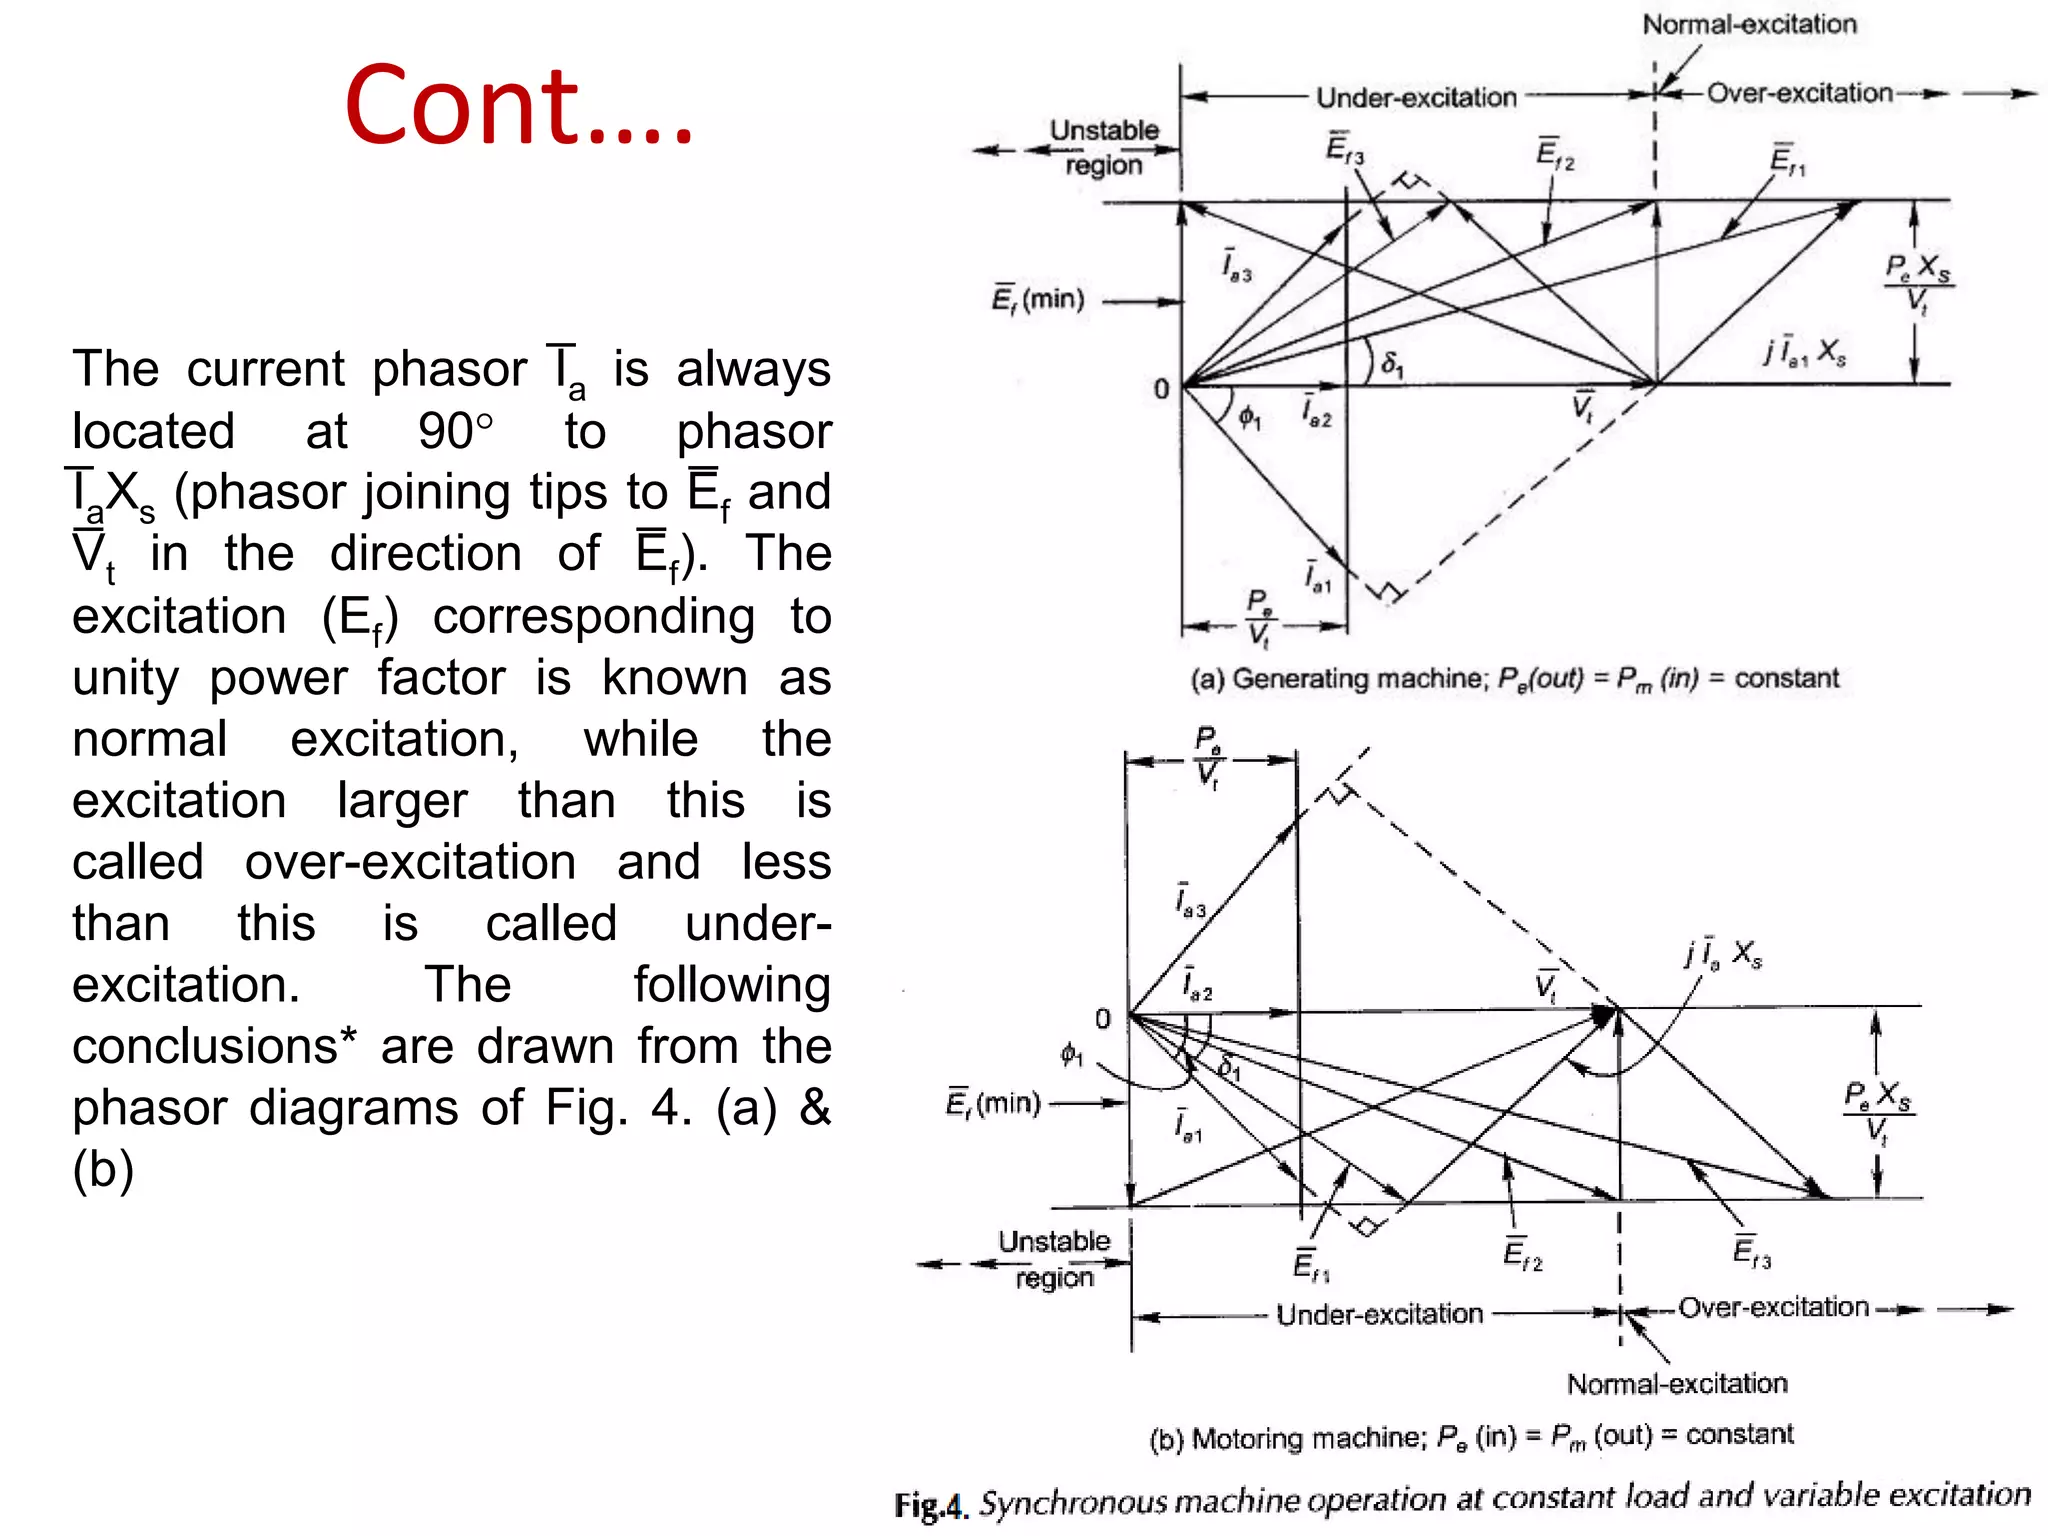
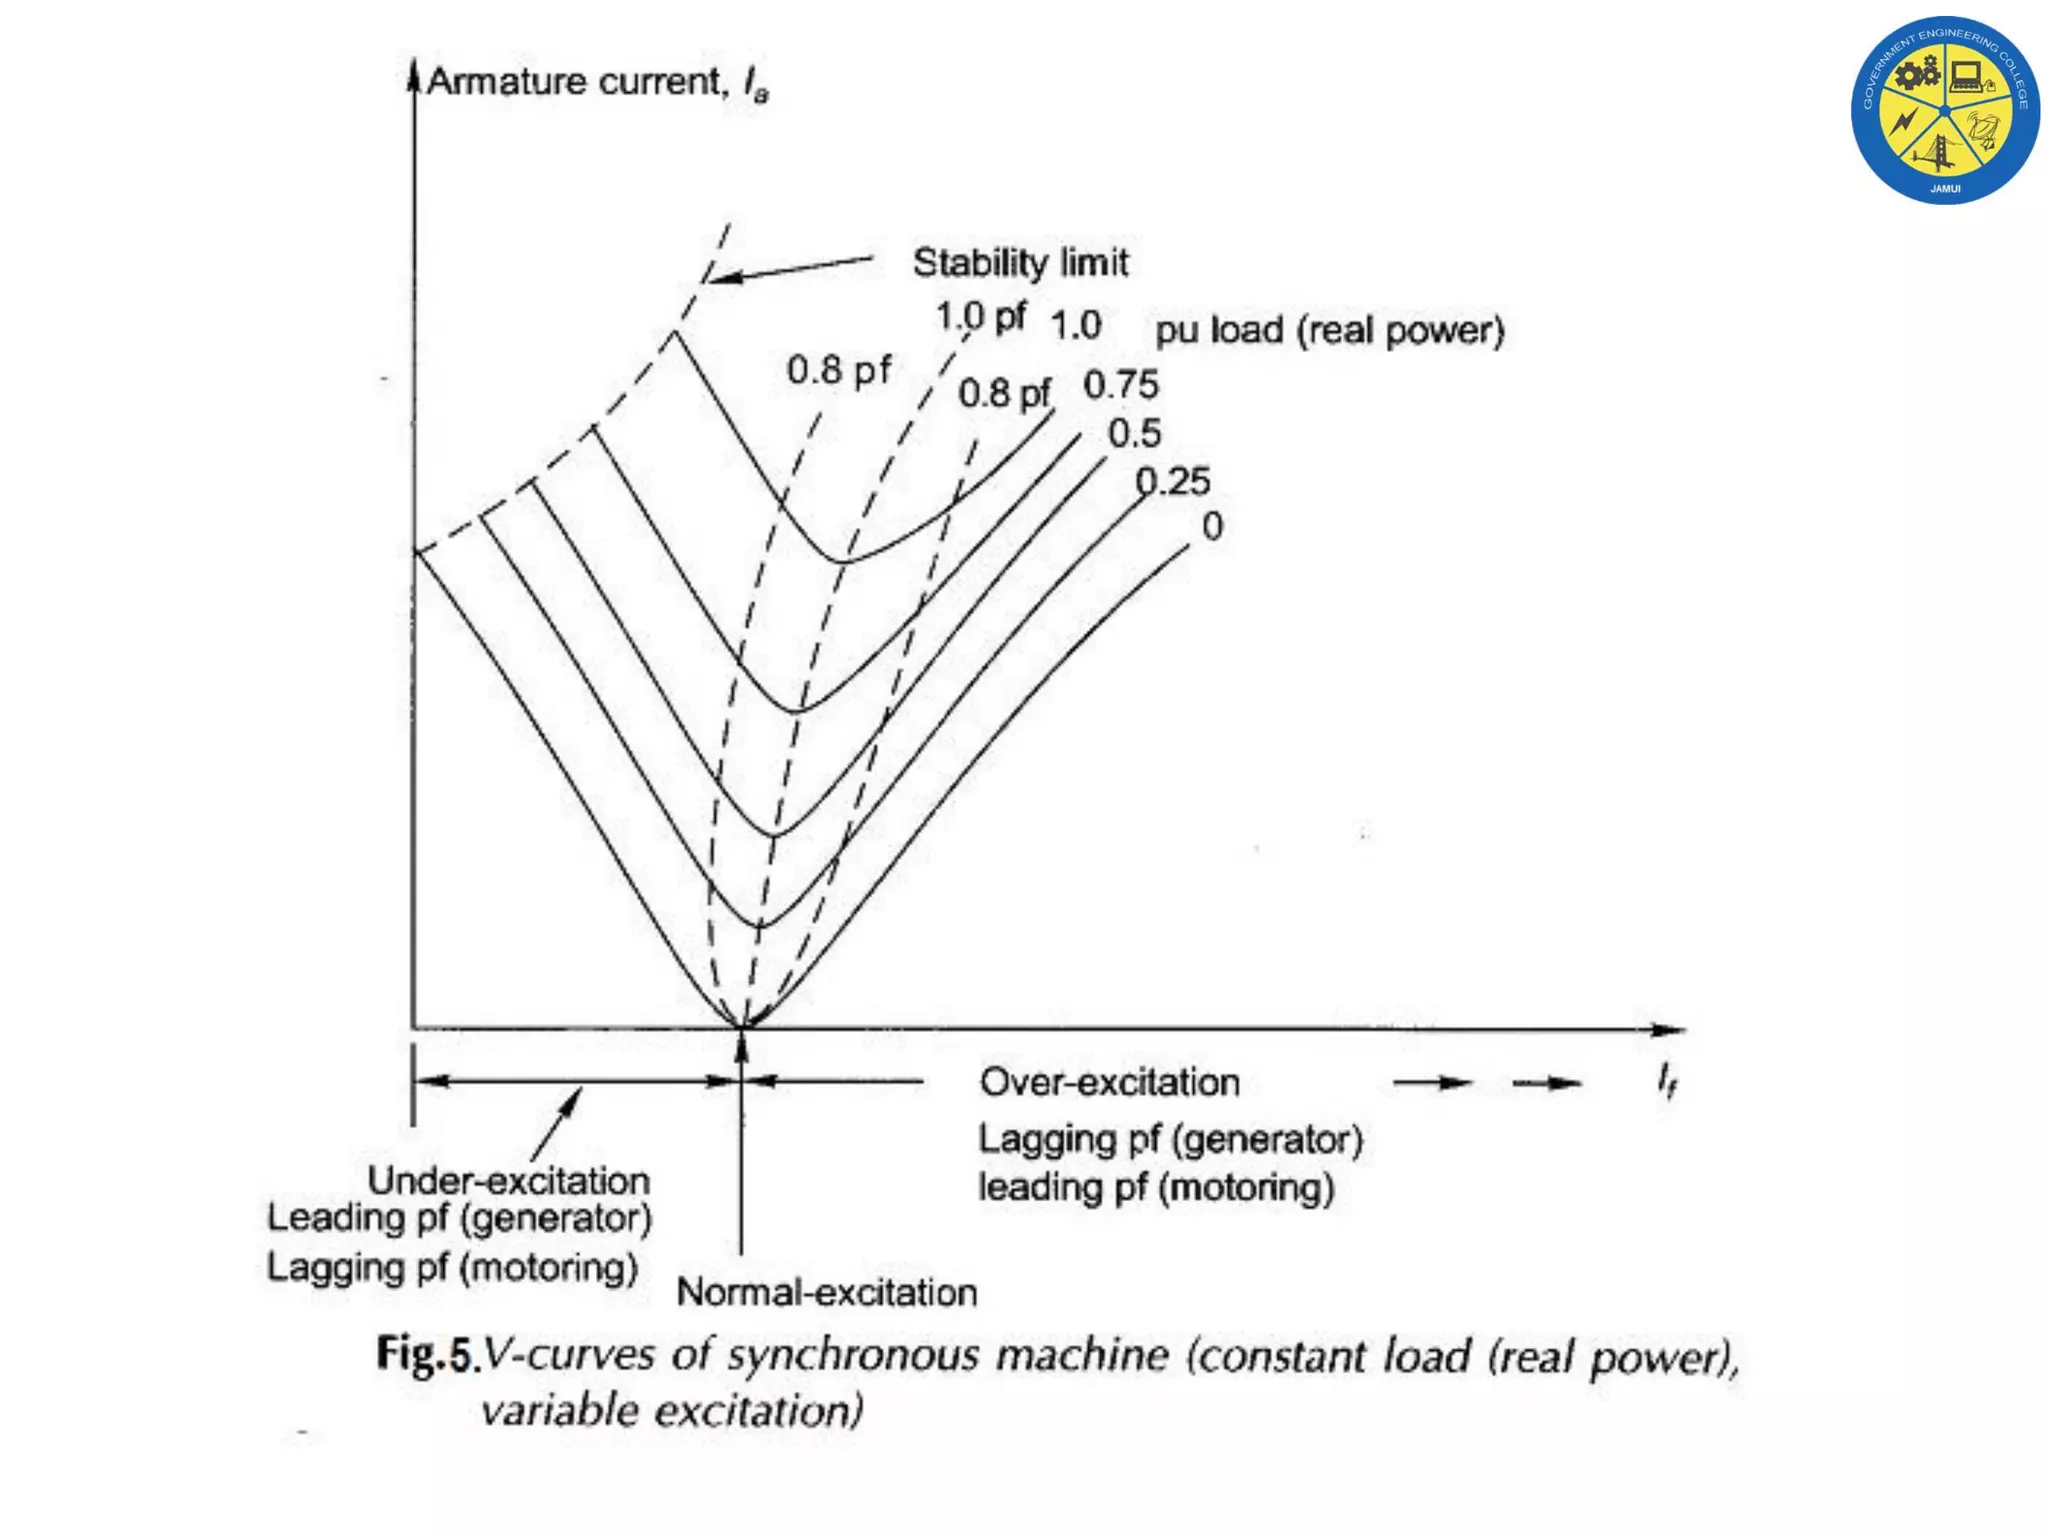
Government Engineering College, jamui
Introduction
The Operating Characteristics of Synchronous Machine
are examined here under conditions of variable load and
variable excitation. One of these quantities will be
assumed to be held constant at a time while the other will
be allowed to vary over a wide range. Further, here too the
armature resistance will be assumed negligible. This does
not significantly change the operating characteristic of the
machine but leads to easier understanding of the machine
operation. The more general case of the machine with
armature resistance. By virtue of negligible resistance
assumption, the electrical power at the machine terminals
and the mechanical power at its shaft
Generating Machine
Motoring Machine
Power-angle Characteristic
Figure shows the circuit diagrams and phasor diagrams of a
synchronous machine in generating mode (Fig.1. (a) and (c)) and
motoring mode (Fig.1. (b) and (d)). The machine is assumed to be
connected to infinite bus-bars of voltage Vt. It is easily observed
from the phasor diagrams that in generating mode, the excitation
emf Ef leads Vt by angle δ, while it lags Vt in the motoring mode.
It follows from the phasor triangle OMP (Fig.1. (c) and (d)) that
Cont….
Cont….
Multiplying both side of equation Vt
where Pe = Vt Ia cos Φ = electrical power (per phase) exchanged with
the bus-bars δ = Angle between Ef and Vt and is called the power angle of the
machine (δ has opposite sign for generating/motoring modes).
The relationship of Eq. (2) is known as the power-angle characteristic
of the machine and is plotted in Fig.2. for given Vt and Ef. The maximum
power. occurs at δ = 90° beyond which the machine falls out of step (loses
synchronism). The machine can be taken up to Pe,max only by gradually
increasing the load. This is known as the steady-state stability limit of the
machine.
Cont….
The machine is normally operated at δ much less than 90°. The phasor diagram of a
generating machine under condition of Pe,max is drawn in Fig.3. Obviously Ia will
be several times max larger than the rated machine current in this condition.
Operation at Constant Load
with Variable Excitation
At constant load, from Eq. (2)
It is therefore, observed that at constant load, as the excitation emf Ef, is
varied (by varying field current If), the power angle δ varies such that Ef sin δ
remains constant. The machine behaviour is depicted by the phasor
diagrams of Fig.4 (a) and (b)). As Ef varies, the tip of phasor E̅ f moves on a
line parallel to V̅ t and at distance Efsinδ=PeXs/Vt from it. Since IacosΦ =
constant, the projection of the current phasor on Vt must remain constant, i.e.
the tip of the current phasor traces a line perpendicular to Vt at distance
IacosΦ = Pe/Vt from the origin.
The current phasor I̅a is always
located at 90° to phasor
I̅aXs (phasor joining tips to E̅ f and
V̅ t in the direction of E̅ f). The
excitation (Ef) corresponding to
unity power factor is known as
normal excitation, while the
excitation larger than this is
called over-excitation and less
than this is called under-
excitation. The following
conclusions* are drawn from the
phasor diagrams of Fig. 4. (a) &
(b)
Cont….
Cont….
• Generating Machine
 The machine supplies a lagging power factor current when over-excited.
 The machine supplies a leading power factor current when under-excited.
• Motoring Machine
 The machine draws a leading power factor current when over-excited.
 The machine draws a lagging power factor current when under-excited.
It is also easily observed from these phasor diagrams that the
magnitude of the armature current exhibits a minimum when its excitation is
continuously increased from an under-excited state. The nature of la versus
excitation (If) plot for various values of load (real power) is shown in Fig.5.
These are known as V-curves of synchronous machine by virtue of their
shape. Though only one figure is drawn for generating/motoring operation,
the actual shape of V-curves for the two cases will not be identical. A little
reflection will show that PF versus If plots will be inverted V-curves.
Cont….
Minimum Excitation
From Fig.4.(a) and (b) it is seen that as excitation is reduced, the angle δ continuously
increases. The minimum permissible excitation, Ef (min), corresponds to the stability
limit, i.e. δ = 90°. Obviously Minimum field current and corresponding armature current
for a given pu load at the limit of stability is indicated by the dotted curve in Fig. 5.
Observation
In a synchronous machine the real electrical power exchanged
with the bus-bars is controlled by the mechanical shaft power
irrespective of excitation. The excitation, on the other hand,
governs only the power factor of the machine without affecting
the real power flow. For example, in a generator if it is desired to
feed more real power into the bus-bars the throttle must be
opened admitting more steam into the turbine (coupled to
generator) thereby feeding more mechanical power into shaft.
As a consequence the power angle δ increases and so does the
electrical power output Eq.(2)). However, if it is desired to adjust
the machine power factor, its excitation should be varied (well
within the limit imposed by Eq. (6)).
Operating charachteristics of synch. machine

Operating charachteristics of synch. machine

  • 1.
  • 2.
    Introduction The Operating Characteristicsof Synchronous Machine are examined here under conditions of variable load and variable excitation. One of these quantities will be assumed to be held constant at a time while the other will be allowed to vary over a wide range. Further, here too the armature resistance will be assumed negligible. This does not significantly change the operating characteristic of the machine but leads to easier understanding of the machine operation. The more general case of the machine with armature resistance. By virtue of negligible resistance assumption, the electrical power at the machine terminals and the mechanical power at its shaft
  • 3.
  • 4.
    Power-angle Characteristic Figure showsthe circuit diagrams and phasor diagrams of a synchronous machine in generating mode (Fig.1. (a) and (c)) and motoring mode (Fig.1. (b) and (d)). The machine is assumed to be connected to infinite bus-bars of voltage Vt. It is easily observed from the phasor diagrams that in generating mode, the excitation emf Ef leads Vt by angle δ, while it lags Vt in the motoring mode. It follows from the phasor triangle OMP (Fig.1. (c) and (d)) that
  • 5.
  • 6.
    Cont…. Multiplying both sideof equation Vt where Pe = Vt Ia cos Φ = electrical power (per phase) exchanged with the bus-bars δ = Angle between Ef and Vt and is called the power angle of the machine (δ has opposite sign for generating/motoring modes). The relationship of Eq. (2) is known as the power-angle characteristic of the machine and is plotted in Fig.2. for given Vt and Ef. The maximum power. occurs at δ = 90° beyond which the machine falls out of step (loses synchronism). The machine can be taken up to Pe,max only by gradually increasing the load. This is known as the steady-state stability limit of the machine.
  • 7.
    Cont…. The machine isnormally operated at δ much less than 90°. The phasor diagram of a generating machine under condition of Pe,max is drawn in Fig.3. Obviously Ia will be several times max larger than the rated machine current in this condition.
  • 8.
    Operation at ConstantLoad with Variable Excitation At constant load, from Eq. (2) It is therefore, observed that at constant load, as the excitation emf Ef, is varied (by varying field current If), the power angle δ varies such that Ef sin δ remains constant. The machine behaviour is depicted by the phasor diagrams of Fig.4 (a) and (b)). As Ef varies, the tip of phasor E̅ f moves on a line parallel to V̅ t and at distance Efsinδ=PeXs/Vt from it. Since IacosΦ = constant, the projection of the current phasor on Vt must remain constant, i.e. the tip of the current phasor traces a line perpendicular to Vt at distance IacosΦ = Pe/Vt from the origin.
  • 9.
    The current phasorI̅a is always located at 90° to phasor I̅aXs (phasor joining tips to E̅ f and V̅ t in the direction of E̅ f). The excitation (Ef) corresponding to unity power factor is known as normal excitation, while the excitation larger than this is called over-excitation and less than this is called under- excitation. The following conclusions* are drawn from the phasor diagrams of Fig. 4. (a) & (b) Cont….
  • 10.
    Cont…. • Generating Machine The machine supplies a lagging power factor current when over-excited.  The machine supplies a leading power factor current when under-excited. • Motoring Machine  The machine draws a leading power factor current when over-excited.  The machine draws a lagging power factor current when under-excited. It is also easily observed from these phasor diagrams that the magnitude of the armature current exhibits a minimum when its excitation is continuously increased from an under-excited state. The nature of la versus excitation (If) plot for various values of load (real power) is shown in Fig.5. These are known as V-curves of synchronous machine by virtue of their shape. Though only one figure is drawn for generating/motoring operation, the actual shape of V-curves for the two cases will not be identical. A little reflection will show that PF versus If plots will be inverted V-curves.
  • 11.
    Cont…. Minimum Excitation From Fig.4.(a)and (b) it is seen that as excitation is reduced, the angle δ continuously increases. The minimum permissible excitation, Ef (min), corresponds to the stability limit, i.e. δ = 90°. Obviously Minimum field current and corresponding armature current for a given pu load at the limit of stability is indicated by the dotted curve in Fig. 5.
  • 13.
    Observation In a synchronousmachine the real electrical power exchanged with the bus-bars is controlled by the mechanical shaft power irrespective of excitation. The excitation, on the other hand, governs only the power factor of the machine without affecting the real power flow. For example, in a generator if it is desired to feed more real power into the bus-bars the throttle must be opened admitting more steam into the turbine (coupled to generator) thereby feeding more mechanical power into shaft. As a consequence the power angle δ increases and so does the electrical power output Eq.(2)). However, if it is desired to adjust the machine power factor, its excitation should be varied (well within the limit imposed by Eq. (6)).