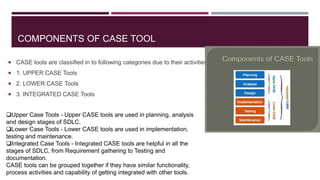
SlideShare a Scribd company logo
1 of 67
SYSTEM
ANALYSIS
AND DESIGN
PRESENTED BY
KIRUTHIKA
SYSTEM
 A system is an orderly grouping of interdependent components linked together according to a plan to
achieve a specific objective.
Systems development is systematic process which includes phases such as planning, analysis, design,
deployment, and maintenance. we will primarily focus on −
 Systems analysis
 Systems design
CONSTRAINTS OF A SYSTEM
A system must have three basic constraints −
 A system must have some structure and behaviour which is designed to achieve a predefined
objective.
 Interconnectivity and interdependence must exist among the system components.
 The objectives of the organization have a higher priority than the objectives of its subsystems.
For example, traffic management system, payroll system, automatic library system, human resources
information system.
PROPERTIES OF A SYSTEM
A system has the following properties −
 Organization
Organization implies structure and order. It is the arrangement of components that helps to achieve predetermined objectives.
 Interaction
It is defined by the manner in which the components operate with each other.
For example, in an organization, purchasing department must interact with production department and payroll with personnel department.
 Interdependence
Interdependence means how the components of a system depend on one another. For proper functioning, the components are coordinated and linked together according to a
specified plan. The output of one subsystem is the required by other subsystem as input.
 Integration
Integration is concerned with how a system components are connected together. It means that the parts of the system work together within the system even if each part
performs a unique function.
 Central Objective
The objective of system must be central. It may be real or stated. It is not uncommon for an organization to state an objective and operate to achieve another.
The users must know the main objective of a computer application early in the analysis for a successful design and conversion.
ELEMENTS OF A SYSTEM
Outputs and Inputs
 The main aim of a system is to produce an output which is useful for its user.
 Inputs are the information that enters into the system for processing.
 Output is the outcome of processing.
Processor(s)
 The processor is the element of a system that involves the actual transformation of input into output.
 It is the operational component of a system. Processors may modify the input either totally or partially, depending on the output specification.
 As the output specifications change, so does the processing. In some cases, input is also modified to enable the processor for handling the transformation.
Control
 The control element guides the system.
 It is the decision–making subsystem that controls the pattern of activities governing input, processing, and output.
 The behaviour of a computer System is controlled by the Operating System and software. In order to keep system in balance, what and how much input is needed
is determined by Output Specifications.
ELEMENTS OF A SYSTEM
Feedback
 Feedback provides the control in a dynamic system.
 Positive feedback is routine in nature that encourages the performance of the system.
 Negative feedback is informational in nature that provides the controller with information for action.
Environment
 The environment is the “super system” within which an organization operates.
 It is the source of external elements that strike on the system.
 It determines how a system must function. For example, vendors and competitors of organization’s environment, may provide
constraints that affect the actual performance of the business.
Boundaries and Interface
 A system should be defined by its boundaries. Boundaries are the limits that identify its components, processes, and
interrelationship when it interfaces with another system.
 Each system has boundaries that determine its sphere of influence and control.
 The knowledge of the boundaries of a given system is crucial in determining the nature of its interface with other systems for
successful design.
TYPES OF SYSTEM
The systems can be divided into the following types −
Physical or Abstract Systems
 Physical systems are tangible entities. We can touch and feel them.
 Physical System may be static or dynamic in nature. For example, desks and chairs are the physical parts of
computer center which are static. A programmed computer is a dynamic system in which programs, data, and
applications can change according to the user's needs.
 Abstract systems are non-physical entities or conceptual that may be formulas, representation or model of a real
system.
Open or Closed Systems
 An open system must interact with its environment. It receives inputs from and delivers outputs to the outside of
the system. For example, an information system which must adapt to the changing environmental conditions.
 A closed system does not interact with its environment. It is isolated from environmental influences. A completely
closed system is rare in reality.
Adaptive and Non Adaptive System
 Adaptive System responds to the change in the environment in a way to improve their performance and to
survive. For example, human beings, animals.
 Non Adaptive System is the system which does not respond to the environment. For example, machines.
TYPES OF SYSTEM
Permanent or Temporary System
 Permanent System persists for long time. For example, business policies.
 Temporary System is made for specified time and after that they are demolished. For example, A DJ
system is set up for a program and it is dissembled after the program.
Natural and Manufactured System
 Natural systems are created by the nature. For example, Solar system, seasonal system.
 Manufactured System is the man-made system. For example, Rockets, dams, trains.
Deterministic or Probabilistic System
 Deterministic system operates in a predictable manner and the interaction between system components is
known with certainty. For example, two molecules of hydrogen and one molecule of oxygen makes water.
 Probabilistic System shows uncertain behavior. The exact output is not known. For example, Weather
forecasting, mail delivery.
TYPES OF SYSTEM
Social, Human-Machine, Machine System
 Social System is made up of people. For example, social clubs, societies.
 In Human-Machine System, both human and machines are involved to perform a particular task. For example, Computer
programming.
 Machine System is where human interference is neglected. All the tasks are performed by the machine. For example, an
autonomous robot.
Man–Made Information Systems
 It is an interconnected set of information resources to manage data for particular organization, under Direct Management
Control (DMC).
 This system includes hardware, software, communication, data, and application for producing information according to the need
of an organization.
Man-made information systems are divided into three types :
 Formal Information System − It is based on the flow of information in the form of memos, instructions, etc., from top level to
lower levels of management.
 Informal Information System − This is employee based system which solves the day to day work related problems.
 Computer Based System − This system is directly dependent on the computer for managing business applications. For
example, automatic library system, railway reservation system, banking system, etc.
SYSTEM ANALYSIS
 It is a process of collecting and interpreting facts, identifying the problems, and decomposition of a system
into its components.
 System analysis is conducted for the purpose of studying a system or its parts in order to identify its
objectives. It is a problem solving technique that improves the system and ensures that all the components
of the system work efficiently to accomplish their purpose.
 Analysis specifies what the system should do.
SYSTEM DESIGN
 It is a process of planning a new business system or replacing an existing system by defining its
components or modules to satisfy the specific requirements. Before planning, you need to understand the
old system thoroughly and determine how computers can best be used in order to operate efficiently.
 System Design focuses on how to accomplish the objective of the system.
 System Analysis and Design (SAD) mainly focuses on
 Systems
 Processes
 Technology
CASE TOOLS
 CASE stands for Computer Aided Software Engineering. It means, development and maintenance of
software projects with help of various automated software tools.
 CASE tools are set of software application programs, which are used to automate SDLC activities.
CASE tools are used by software project managers, analysts and engineers to develop software
system.
 There are number of CASE tools available to simplify various stages of Software Development Life
Cycle such as Analysis tools, Design tools, Project management tools, Database Management tools,
Documentation tools are to name a few.
 Use of CASE tools accelerates the development of project to produce desired result and helps to
uncover flaws before moving ahead with next stage in software development.
COMPONENTS OF CASE TOOL
 CASE tools are classified in to following categories due to their activities:
 1. UPPER CASE Tools
 2. LOWER CASE Tools
 3. INTEGRATED CASE Tools
Upper Case Tools - Upper CASE tools are used in planning, analysis
and design stages of SDLC.
Lower Case Tools - Lower CASE tools are used in implementation,
testing and maintenance.
Integrated Case Tools - Integrated CASE tools are helpful in all the
stages of SDLC, from Requirement gathering to Testing and
documentation.
CASE tools can be grouped together if they have similar functionality,
process activities and capability of getting integrated with other tools.
TYPES OF CASE TOOLS
 Diagram tools
These tools are used to represent system components, data and control flow among various software
components and system structure in a graphical form. For example, Flow Chart Maker tool for creating state-
of-the-art flowcharts.
 Process Modelling Tools
Process modelling is method to create software process model, which is used to develop the software.
Process modelling tools help the managers to choose a process model or modify it as per the requirement of
software product. For example, EPF Composer
 Project Management Tools
These tools are used for project planning, cost and effort estimation, project scheduling and resource
planning. Managers have to strictly comply project execution with every mentioned step in software project
management. Project management tools help in storing and sharing project information in real-time
throughout the organization. For example, Creative Pro Office, Trac Project, Basecamp.
 Documentation Tools
Documentation in a software project starts prior to the software process, goes throughout all phases of SDLC
and after the completion of the project. Documentation tools generate documents for technical users and end
users. Technical users are mostly in-house professionals of the development team who refer to system
manual, reference manual, training manual, installation manuals etc. The end user documents describe the
functioning and how-to of the system such as user manual. For example, Doxygen, DrExplain, Adobe Robo
Help for documentation.
 Analysis Tools
These tools help to gather requirements, automatically check for any inconsistency, inaccuracy in the
diagrams, data redundancies or erroneous omissions. For example, Accept 360, Accompa, CaseComplete for
requirement analysis, Visible Analyst for total analysis.
 Design Tools
These tools help software designers to design the block structure of the software, which may further be
broken down in smaller modules using refinement techniques. These tools provides detailing of each module
and interconnections among modules. For example, Animated Software Design
 Configuration Management Tools
An instance of software is released under one version. Configuration Management tools deal with –
Version and revision management
Baseline configuration management
Change control management
CASE tools help in this by automatic tracking, version management and release management. For
example, Fossil, Git, Accu REV.
 Change Control Tools
These tools are considered as a part of configuration management tools. They deal with changes
DATA FLOW DIAGRAM
 A picture is worth a thousand words. A Data Flow Diagram (DFD) is a traditional way to visualize the
information flows within a system. A neat and clear DFD can depict a good amount of the system
requirements graphically. It can be manual, automated, or a combination of both.
 It shows how information enters and leaves the system, what changes the information and where
information is stored. The purpose of a DFD is to show the scope and boundaries of a system as a
whole. It may be used as a communications tool between a systems analyst and any person who plays
a part in the system that acts as the starting point for redesigning a system.
DFD DIAGRAM NOTATIONS
External Entity : An external entity can represent a human, system or subsystem. It is where certain data comes
from or goes to. It is external to the system we study, in terms of the business process. For this reason, people
used to draw external entities on the edge of a diagram.
Process : A process receives input data and produces output with a different content or form. Processes
can be as simple as collecting input data and saving in the database, or it can be complex as producing
a report containing monthly sales of all retail stores in the northwest region.
Every process has a name that identifies the function it performs.
The name consists of a verb, followed by a singular noun.
Example:
 Apply Payment
 Calculate Commission
 Verify Order
 Data Store
 A data store represents the storage of persistent data required and/or produced by the process. Here are some examples of data
stores: membership forms, database tables, etc.
Notation for DATA STORE
Data can be written into the data store, which is depicted by an outgoing arrow
Data can be read from a data store, which is depicted by an incoming arrow.
Examples are: inventory, Accounts receivables, Orders, and Daily Payments.
 Note that:
 A data store must be connected to a process with a data-flow.
 Each data store must have at least one input data-flow and at least one
output data-flow (even if the output data-flow is a control or confirmation
message).
 Data Flow
 A data flow represents the flow of information, with its direction represented by an arrowhead that shows
at the end(s) of flow connector.
Example:
Customer_info (LastName, FirstName, SS#, Tel #, etc.)
Order_info (OrderId, Item#, OrderDate, CustomerID, etc.).
Notation for DATA flow
Straight lines with incoming arrows are input data flow
Straight lines with outgoing arrows are output data flows
Note that: Because every process changes data from one form into another, at least one data-flow must
enter and one data-flow must exit each process symbol.
RULE OF DATA FLOW
FREQUENTLY-MADE MISTAKES IN DFD
A second class of DFD mistakes arise when the outputs from one processing step do not match its inputs and they can be classified as:
Black holes - A processing step may have input flows but no output flows.
Miracles - A processing step may have output flows but no input flows.
Grey holes - A processing step may have outputs that are greater than the sum of its inputs
FOOD ORDERING SYSTEM – LEVEL 0 DFD
Shows the overview of the boundaries of a system
No technical knowledge is required to understand with the simple notation
Simple to draw, amend and elaborate as its limited notation
FOOD ORDERING SYSTEM – LEVEL 1 DFD
 The Food Order System Data Flow Diagram example contains three processes, four external entities,
and two data stores.
 Based on the diagram, we know that a Customer can place an Order. The Order Food process receives
the Order, forwards it to the Kitchen, store it in the Order data store, and store the updated Inventory
details in the Inventory data store. The process also delivers a Bill to the Customer.
 The Manager can receive Reports through the Generate Reports process, which takes Inventory details
and Orders as input from the Inventory and Order data store respectively.
 The Manager can also initiate the Order Inventory process by providing Inventory order. The process
forwards the Inventory order to the Supplier and stores the updated Inventory details in the Inventory
data store.
SUPERMARKET APP – LEVEL 0 DFD
In between the process and the external entity, there is a bi-directional connector, which indicates the
existence of information exchange between customer and the app, and the information flow is bi-
directional.
SUPERMARKET APP – LEVEL 1 DFD
LEVEL 1 DFD DESCRIPTION
 The Supermarket App Data Flow Diagram example contains five processes, one external entity and three data stores.
Although there is no design guideline that governs the positioning of shapes in a Data Flow Diagram, we tend to put the
processes in the middle and data stores and external entities on the sides to make it easier to comprehend.
 Based on the diagram, we know that a Customer can receive Hot promotion news from the Check Latest Promotions
process and the news is provided by the Company database. Note that by common sense we know that Check Latest
Promotions is likely to be a feature of the app but the Data Flow Diagram itself implies no such thing. Theoretically speaking,
a process in Data Flow Diagram may correspond to a feature or a set of features.
 A Customer can Build Shopping List by providing Items details and the details will be stored in the Shopping Cart database.
The Warehouse database will also provide the Items details required to complete the process.
 A Customer can receive Shopping list details from the View Shopping List process and such details is provided by the
Shopping Cart database.
 A Customer can receive Items details by performing the Search Items process. He/she must provide an Item name for
searching and the item details are returned from the Warehouse database after searched. Although we said that the search
result is returned after searching, the Data Flow Diagram, again, implies no such thing. It is our common sense that leads us
to interpret the diagram in the way that we understand it naturally. Keep in mind that Data Flow Diagram only tells you where
information exchange takes place. It does not answer in what way and in what order the information is being used throughout
a system. If this information is important and worth mentioning, consider to model it with diagrams like BPMN Business
Process Diagram or UML Activity Diagram.
 Finally, a Customer can receive Supermarkets' physical location details by performing Check Locations and the details is
provided by the Company database.
THE VIDEO RENTAL SYSTEM EXAMPLE LEVEL 0 DFD
Notes: There are two external entities, namely Customer and Manager. In between the process and the
external entities, there are data flow connectors indicating the existence of information exchange between
customer and the system
VIDEO RENTAL LEVEL 1 DFD
 The Video Rental System Data Flow Diagram example contains three processes, two external entities and two data stores.
Although there is no design guideline that governs the positioning of shapes in a Data Flow Diagram, we tend to put the
processes in the middle and data stores and external entities on the sides to make it easier to comprehend.
 Based on the diagram, we know that a Customer makes a Video request to the Rent Video process. The Rent Video process
also receives Video info. from the Video Library data store. As a result, the process produces a Bill to the Customer, and
stores the Rental info. into the Rental data store.
 A Customer can Return Video by providing Video & Rental info. The process stores the Video info. into the Video Library
data store and Rental info. into the Rental data store. As a result, Return receipt is delivered to the Customer. Although we
said that the receipt is delivered as a result of the Return Video process, the Data Flow Diagram implies no such thing. It is
our common sense that lead us to interpret the diagram in the way that we understand it naturally. Strictly speaking, the
diagram only tells us the Return Video process receives Video & Rental info. and produces Video info., Rental info., and
Return receipt, with no order specified. Note that Data Flow Diagram does not answer in what way and in what order the
information is being used throughout a system. If this information is important and worth mentioning, consider to model it with
diagrams like BPMN Business Process Diagram or UML Activity Diagram.
 Finally, a Manager can receive Rental report from the Generate Rental Report process and the information involved is
provided by the Rental data store.
LEVEL 0 DFD HOSTEL MESS BILLING
LEVEL 1 DFD FOR HOSTEL BILLING
LEVEL 1 DFD FOR LIBRARY MANAGEMENT
DECISION TABLE
 Decision tables are a concise visual representation for specifying which actions to perform depending
on given conditions. They are algorithms whose output is a set of actions. The information expressed in
decision tables could also be represented as decision trees or in a programming language as a series of
if-then-else and switch-case statements.
 Decision table testing is a software testing technique used to test system behavior for different input
combinations. This is a systematic approach where the different input combinations and their
corresponding system behavior (Output) are captured in a tabular form. That is why it is also called as a
Cause-Effect table where Cause and effects are captured for better test coverage.
 A Decision Table is a tabular representation of inputs versus rules/cases/test conditions. Let's learn with
an example.
 Example 1: How to make Decision Base Table for Login Screen
 The condition is simple if the user provides correct username and password the user will be redirected
to the homepage. If any of the input is wrong, an error message will be displayed.
WHY IS DECISION TABLE TESTING IS IMPORTANT?
 This testing technique becomes important when it is required to test different combination. It also helps in
better test coverage for complex business logic.
 In Software Engineering, boundary value and equivalent partition are other similar techniques used to ensure
better coverage. They are used if the system shows the same behaviour for a large set of inputs. However, in
a system where for each set of input values the system behaviour is different, boundary value and equivalent
partitioning technique are not effective in ensuring good test coverage.
 In this case, decision table testing is a good option. This technique can make sure of good coverage, and the
representation is simple so that it is easy to interpret and use.
 This table can be used as the reference for the requirement and for the functionality development since it is
easy to understand and cover all the combinations.
 The significance of this technique becomes immediately clear as the number of inputs increases. Number of
possible Combinations is given by 2 ^ n , where n is the number of Inputs. For n = 10, which is very common
in the web based testing, having big input forms, the number of combinations will be 1024. Obviously, you
cannot test all but you will choose a rich sub-set of the possible combinations using decision based testing
technique.
ADVANTAGES OF DECISION TABLE TESTING
 When the system behaviour is different for different input and not same for a range of inputs, both
equivalent partitioning, and boundary value analysis won't help, but decision table can be used.
 The representation is simple so that it can be easily interpreted and is used for development and
business as well.
 This table will help to make effective combinations and can ensure a better coverage for testing
 Any complex business conditions can be easily turned into decision tables
 In a case we are going for 100% coverage typically when the input combinations are low, this technique
can ensure the coverage.
SYSTEM FLOWCHART
 System flowcharts are a way of displaying how data flows in a system and how decisions are made to
control events. To illustrate this, symbols are used. They are connected together to show what happens
to data and where it goes. The basic ones include
FLOW CHART SYMBOLS
 A system flowchart symbolically shows how data flows throughout a system and how event-controlling
decisions are made. For instance, this template shows the flow for logging into an online service.
TRAFFIC LIGHT CONTROLLER – SYSTEM FLOW DIAGRAM
ER DIAGRAM
 An entity relationship diagram (ERD) shows the relationships of entity sets stored in a database. An
entity in this context is an object, a component of data. An entity set is a collection of similar entities.
 By defining the entities, their attributes, and showing the relationships between them, an ER diagram
illustrates the logical structure of databases. ER diagrams are used to sketch out the design of a
database.
 The ER or (Entity Relational Model) is a high-level conceptual data model diagram. Entity-Relation
model is based on the notion of real-world entities and the relationship between them.
 ER modelling helps you to analyze data requirements systematically to produce a well-designed
database. So, it is considered a best practice to complete ER modeling before implementing your
database.
History of ER models
 ER diagrams are a visual tool which is helpful to represent the ER model. It was proposed by Peter
Chen in 1971 to create a uniform convention which can be used for relational database and network. He
aimed to use an ER model as a conceptual modeling approach.
What is ER Diagrams?
 Entity relationship diagram displays the relationships of entity set stored in a database. In other words,
we can say that ER diagrams help you to explain the logical structure of databases. At first look, an ER
diagram looks very similar to the flowchart. However, ER Diagram includes many specialized symbols,
and its meanings make this model unique.
Facts about ER Diagram Model:
 ER model allows you to draw Database Design
 It is an easy to use graphical tool for modeling data
 Widely used in Database Design
 It is a GUI representation of the logical structure of a Database
 It helps you to identifies the entities which exist in a system
and the relationships between those entities
 Why use ER Diagrams?
 Here, are prime reasons for using the ER Diagram
 Helps you to define terms related to entity relationship modelling
 Provide a preview of how all your tables should connect, what fields are going to be on each table
 Helps to describe entities, attributes, relationships
 ER diagrams are translatable into relational tables which allows you to build databases quickly
 ER diagrams can be used by database designers as a blueprint for implementing data in specific software applications
 The database designer gains a better understanding of the information to be contained in the database with the help of ERP diagram
 ERD is allowed you to communicate with the logical structure of the database to users
 Components of the ER Diagram
 This model is based on three basic concepts:
 Entities
 Attributes
 Relationships
 Example : For example, in a University database, we might have entities for Students, Courses, and Lecturers. Students entity can
have attributes like Rollno, Name, and DeptID. They might have relationships with Courses and Lecturers.
WHAT IS ENTITY?
A real-world thing either living or non-living that is easily recognizable and nonrecognizable. It is anything in the enterprise that is
to be represented in our database. It may be a physical thing or simply a fact about the enterprise or an event that happens
in the real world.
An entity can be place, person, object, event or a concept, which stores data in the database. The characteristics of entities are
must have an attribute, and a unique key. Every entity is made up of some 'attributes' which represent that entity.
Examples of entities:
Person: Employee, Student, Patient
Place: Store, Building
Object: Machine, product, and Car
Event: Sale, Registration, Renewal
Concept: Account, Course
Entity set: An entity set is a group of similar kind of entities. It may contain entities with attribute sharing similar values. Entities
are represented by their properties, which also called attributes. All attributes have their separate values. For example, a
student entity may have a name, age, class, as attributes.
Relationship
Relationship is nothing but an association among two or more entities. E.g., Tom works in the Chemistry department.
Entities take part in relationships. We can often identify relationships with verbs or verb phrases.
For example:
You are attending this lecture
I am giving the lecture
Just loke entities, we can classify relationships according to relationship-types:
A student attends a lecture
A lecturer is giving a lecture.
 Weak Entities : A weak entity is a type of entity which doesn't have its key attribute. It can be identified
uniquely by considering the primary key of another entity. For that, weak entity sets need to have
participation.
In above example, "Trans No" is a discriminator within a group of transactions in an ATM.
Strong Entity Set Weak Entity Set
Strong entity set always has a
primary key.
It does not have enough attributes to
build a primary key.
It is represented by a rectangle
symbol.
It is represented by a double
rectangle symbol.
It contains a Primary key
represented by the underline symbol.
It contains a Partial Key which is
represented by a dashed underline
symbol.
The member of a strong entity set is
called as dominant entity set.
The member of a weak entity set
called as a subordinate entity set.
Primary Key is one of its attributes
which helps to identify its member.
In a weak entity set, it is a
combination of primary key and
partial key of the strong entity set.
In the ER diagram the relationship
between two strong entity set shown
by using a diamond symbol.
The relationship between one strong
and a weak entity set shown by using
the double diamond symbol.
The connecting line of the strong
entity set with the relationship is
single.
The line connecting the weak entity
set for identifying relationship is
double.
 Attributes
 It is a single-valued property of either an entity-type or a relationship-type.
 For example, a lecture might have attributes: time, date, duration, place, etc.
 An attribute is represented by an Ellipse
 Cardinality
 Defines the numerical attributes of the relationship between two entities or entity sets.
 Different types of cardinal relationships are:
 One-to-One Relationships
 One-to-Many Relationships
 May to One Relationships
 Many-to-Many Relationships
1. Many-to-Many Cardinality- By this cardinality constraint,
An entity in set A can be associated with any number (zero or more) of entities in set B.
An entity in set B can be associated with any number (zero or more) of entities in set A.
Symbol Used-
Example-Consider the following ER diagram-
Here, One student can enroll in any number (zero or
more) of courses.
One course can be enrolled by any number (zero or more)
of students.
2. Many-to-One Cardinality-
By this cardinality constraint,
An entity in set A can be associated with at most one entity in set B.
An entity in set B can be associated with any number (zero or more) of entities in set A.
Symbol Used-
One student can enroll in at most one course.
One course can be enrolled by any number (zero or more
of students.
3. One-to-Many Cardinality-
By this cardinality constraint,
An entity in set A can be associated with any number (zero or more) of entities in set B.
An entity in set B can be associated with at most one entity in set A.
Symbol Used-
4. One-to-One Cardinality-
By this cardinality constraint,
An entity in set A can be associated with at most one entity in set B.
An entity in set B can be associated with at most one entity in set A.
Symbol Used-
ER- Diagram Notations
ER- Diagram is a visual representation of data that describe how data is related to each other.
Rectangles: This symbol represent entity types
Ellipses : Symbol represent attributes
Diamonds: This symbol represents relationship types
Lines: It links attributes to entity types and entity types with other relationship types
Primary key: attributes are underlined
Double Ellipses: Represent multi-valued attributes

More Related Content

What's hot

Introduction to information system
Introduction to information systemIntroduction to information system
Introduction to information systemPROF.JITENDRA PATEL
 
System Design and Analysis 1
System Design and Analysis 1System Design and Analysis 1
System Design and Analysis 1Boeun Tim
 
Systems development cycle
Systems development cycleSystems development cycle
Systems development cycleSamuel Igbanogu
 
Types & Fundamentals of Information System
Types & Fundamentals of Information SystemTypes & Fundamentals of Information System
Types & Fundamentals of Information SystemAwais Mansoor Chohan
 
analysis and design of information system
analysis and design of information systemanalysis and design of information system
analysis and design of information systemRenu Sharma
 
System Analysis and Design slides by yared yenealem DTU Ethiopia
System Analysis and Design slides by yared yenealem DTU EthiopiaSystem Analysis and Design slides by yared yenealem DTU Ethiopia
System Analysis and Design slides by yared yenealem DTU EthiopiaDebre Tabor University
 
1. Introduction to DBMS
1. Introduction to DBMS1. Introduction to DBMS
1. Introduction to DBMSkoolkampus
 
Computer Organization and Assembly Language
Computer Organization and Assembly LanguageComputer Organization and Assembly Language
Computer Organization and Assembly Languagefasihuddin90
 
Operating system architecture
Operating system architectureOperating system architecture
Operating system architectureSabin dumre
 
Database Design
Database DesignDatabase Design
Database Designlearnt
 
Memory Management in OS
Memory Management in OSMemory Management in OS
Memory Management in OSvampugani
 
Database management systems components
Database management systems componentsDatabase management systems components
Database management systems componentsmuhammad bilal
 
Database Management System Introduction
Database Management System IntroductionDatabase Management System Introduction
Database Management System IntroductionSmriti Jain
 
system development life cycle
system development life cyclesystem development life cycle
system development life cycleSahithya ka
 

What's hot (20)

System analysis
System analysisSystem analysis
System analysis
 
Introduction to information system
Introduction to information systemIntroduction to information system
Introduction to information system
 
System Design and Analysis 1
System Design and Analysis 1System Design and Analysis 1
System Design and Analysis 1
 
Systems development cycle
Systems development cycleSystems development cycle
Systems development cycle
 
Types & Fundamentals of Information System
Types & Fundamentals of Information SystemTypes & Fundamentals of Information System
Types & Fundamentals of Information System
 
analysis and design of information system
analysis and design of information systemanalysis and design of information system
analysis and design of information system
 
System Analysis and Design slides by yared yenealem DTU Ethiopia
System Analysis and Design slides by yared yenealem DTU EthiopiaSystem Analysis and Design slides by yared yenealem DTU Ethiopia
System Analysis and Design slides by yared yenealem DTU Ethiopia
 
System Analysis and Design
System Analysis and DesignSystem Analysis and Design
System Analysis and Design
 
Data flow diagrams - DFD
Data flow diagrams - DFDData flow diagrams - DFD
Data flow diagrams - DFD
 
Data warehousing
Data warehousingData warehousing
Data warehousing
 
1. Introduction to DBMS
1. Introduction to DBMS1. Introduction to DBMS
1. Introduction to DBMS
 
Computer Organization and Assembly Language
Computer Organization and Assembly LanguageComputer Organization and Assembly Language
Computer Organization and Assembly Language
 
Operating system architecture
Operating system architectureOperating system architecture
Operating system architecture
 
Database Design
Database DesignDatabase Design
Database Design
 
Memory Management in OS
Memory Management in OSMemory Management in OS
Memory Management in OS
 
Software requirements
Software requirementsSoftware requirements
Software requirements
 
Database management systems components
Database management systems componentsDatabase management systems components
Database management systems components
 
Database Management System Introduction
Database Management System IntroductionDatabase Management System Introduction
Database Management System Introduction
 
system development life cycle
system development life cyclesystem development life cycle
system development life cycle
 
Database Lecture Notes
Database Lecture NotesDatabase Lecture Notes
Database Lecture Notes
 

Similar to System analysis and design

Introduction to System Analysis and Design - Cybernetics Robo Academy
Introduction to System Analysis and Design - Cybernetics Robo AcademyIntroduction to System Analysis and Design - Cybernetics Robo Academy
Introduction to System Analysis and Design - Cybernetics Robo AcademyTutulAhmed3
 
System Analysis and Design
System Analysis and DesignSystem Analysis and Design
System Analysis and DesignAkshaya Parida
 
System Analysis and Design concept. objective of the design methodologies .
System Analysis and Design concept. objective of the design methodologies .System Analysis and Design concept. objective of the design methodologies .
System Analysis and Design concept. objective of the design methodologies .MatildaSanga
 
System Analysis & Designing : Elements of a System [In short]
System Analysis & Designing : Elements of a System [In short]System Analysis & Designing : Elements of a System [In short]
System Analysis & Designing : Elements of a System [In short]Abir Maheshwari
 
System Analysis and Design 1.pptx
System Analysis and Design 1.pptxSystem Analysis and Design 1.pptx
System Analysis and Design 1.pptxPoonamMalik26
 
System analysis and design
System analysis and designSystem analysis and design
System analysis and designShalini Singh
 
MANAGEMENT INFORMATION SYSTEM- UNIT-2
MANAGEMENT INFORMATION SYSTEM- UNIT-2MANAGEMENT INFORMATION SYSTEM- UNIT-2
MANAGEMENT INFORMATION SYSTEM- UNIT-2Manoj Kumar
 
System and its types
System and its typesSystem and its types
System and its typesnidhipandey79
 
software engineering, Concepts of Quality Assurance
software engineering, Concepts of Quality Assurancesoftware engineering, Concepts of Quality Assurance
software engineering, Concepts of Quality AssuranceJadavsejal
 
General Systems Theory and Systems Analysis
General Systems Theory and Systems AnalysisGeneral Systems Theory and Systems Analysis
General Systems Theory and Systems AnalysiseKindling.org
 
Organization Sub System
Organization Sub SystemOrganization Sub System
Organization Sub SystemArun Deva
 
software engineering
software engineeringsoftware engineering
software engineeringparamalways
 
Bus 304 lecture 4-intro system concepts
Bus 304 lecture 4-intro system  conceptsBus 304 lecture 4-intro system  concepts
Bus 304 lecture 4-intro system conceptseduafo
 
Sad 1 chapter 1- additional material
Sad 1 chapter 1- additional materialSad 1 chapter 1- additional material
Sad 1 chapter 1- additional materialBirhan Atnafu
 
01 isad-information system analysis and design intro by S. A. AHSAN RAJON
01 isad-information system analysis and design intro by S. A. AHSAN RAJON01 isad-information system analysis and design intro by S. A. AHSAN RAJON
01 isad-information system analysis and design intro by S. A. AHSAN RAJONAHSAN RAJON
 

Similar to System analysis and design (20)

Introduction to System Analysis and Design - Cybernetics Robo Academy
Introduction to System Analysis and Design - Cybernetics Robo AcademyIntroduction to System Analysis and Design - Cybernetics Robo Academy
Introduction to System Analysis and Design - Cybernetics Robo Academy
 
System Analysis and Design
System Analysis and DesignSystem Analysis and Design
System Analysis and Design
 
System Analysis and Design concept. objective of the design methodologies .
System Analysis and Design concept. objective of the design methodologies .System Analysis and Design concept. objective of the design methodologies .
System Analysis and Design concept. objective of the design methodologies .
 
System Analysis & Designing : Elements of a System [In short]
System Analysis & Designing : Elements of a System [In short]System Analysis & Designing : Elements of a System [In short]
System Analysis & Designing : Elements of a System [In short]
 
system
systemsystem
system
 
System Analysis and Design 1.pptx
System Analysis and Design 1.pptxSystem Analysis and Design 1.pptx
System Analysis and Design 1.pptx
 
System analysis and design
System analysis and designSystem analysis and design
System analysis and design
 
MANAGEMENT INFORMATION SYSTEM- UNIT-2
MANAGEMENT INFORMATION SYSTEM- UNIT-2MANAGEMENT INFORMATION SYSTEM- UNIT-2
MANAGEMENT INFORMATION SYSTEM- UNIT-2
 
Unit i
Unit iUnit i
Unit i
 
System and its types
System and its typesSystem and its types
System and its types
 
software engineering, Concepts of Quality Assurance
software engineering, Concepts of Quality Assurancesoftware engineering, Concepts of Quality Assurance
software engineering, Concepts of Quality Assurance
 
General Systems Theory and Systems Analysis
General Systems Theory and Systems AnalysisGeneral Systems Theory and Systems Analysis
General Systems Theory and Systems Analysis
 
System
SystemSystem
System
 
Organization Sub System
Organization Sub SystemOrganization Sub System
Organization Sub System
 
software engineering
software engineeringsoftware engineering
software engineering
 
Bus 304 lecture 4-intro system concepts
Bus 304 lecture 4-intro system  conceptsBus 304 lecture 4-intro system  concepts
Bus 304 lecture 4-intro system concepts
 
Ms 04
Ms 04Ms 04
Ms 04
 
Sad 1 chapter 1- additional material
Sad 1 chapter 1- additional materialSad 1 chapter 1- additional material
Sad 1 chapter 1- additional material
 
01 isad-information system analysis and design intro by S. A. AHSAN RAJON
01 isad-information system analysis and design intro by S. A. AHSAN RAJON01 isad-information system analysis and design intro by S. A. AHSAN RAJON
01 isad-information system analysis and design intro by S. A. AHSAN RAJON
 
Types of a_system
Types of a_systemTypes of a_system
Types of a_system
 

Recently uploaded

Building a General PDE Solving Framework with Symbolic-Numeric Scientific Mac...
Building a General PDE Solving Framework with Symbolic-Numeric Scientific Mac...Building a General PDE Solving Framework with Symbolic-Numeric Scientific Mac...
Building a General PDE Solving Framework with Symbolic-Numeric Scientific Mac...stazi3110
 
Intelligent Home Wi-Fi Solutions | ThinkPalm
Intelligent Home Wi-Fi Solutions | ThinkPalmIntelligent Home Wi-Fi Solutions | ThinkPalm
Intelligent Home Wi-Fi Solutions | ThinkPalmSujith Sukumaran
 
Building Real-Time Data Pipelines: Stream & Batch Processing workshop Slide
Building Real-Time Data Pipelines: Stream & Batch Processing workshop SlideBuilding Real-Time Data Pipelines: Stream & Batch Processing workshop Slide
Building Real-Time Data Pipelines: Stream & Batch Processing workshop SlideChristina Lin
 
What is Advanced Excel and what are some best practices for designing and cre...
What is Advanced Excel and what are some best practices for designing and cre...What is Advanced Excel and what are some best practices for designing and cre...
What is Advanced Excel and what are some best practices for designing and cre...Technogeeks
 
BATTLEFIELD ORM: TIPS, TACTICS AND STRATEGIES FOR CONQUERING YOUR DATABASE
BATTLEFIELD ORM: TIPS, TACTICS AND STRATEGIES FOR CONQUERING YOUR DATABASEBATTLEFIELD ORM: TIPS, TACTICS AND STRATEGIES FOR CONQUERING YOUR DATABASE
BATTLEFIELD ORM: TIPS, TACTICS AND STRATEGIES FOR CONQUERING YOUR DATABASEOrtus Solutions, Corp
 
Introduction Computer Science - Software Design.pdf
Introduction Computer Science - Software Design.pdfIntroduction Computer Science - Software Design.pdf
Introduction Computer Science - Software Design.pdfFerryKemperman
 
Unveiling the Future: Sylius 2.0 New Features
Unveiling the Future: Sylius 2.0 New FeaturesUnveiling the Future: Sylius 2.0 New Features
Unveiling the Future: Sylius 2.0 New FeaturesŁukasz Chruściel
 
Der Spagat zwischen BIAS und FAIRNESS (2024)
Der Spagat zwischen BIAS und FAIRNESS (2024)Der Spagat zwischen BIAS und FAIRNESS (2024)
Der Spagat zwischen BIAS und FAIRNESS (2024)OPEN KNOWLEDGE GmbH
 
MYjobs Presentation Django-based project
MYjobs Presentation Django-based projectMYjobs Presentation Django-based project
MYjobs Presentation Django-based projectAnoyGreter
 
Dealing with Cultural Dispersion — Stefano Lambiase — ICSE-SEIS 2024
Dealing with Cultural Dispersion — Stefano Lambiase — ICSE-SEIS 2024Dealing with Cultural Dispersion — Stefano Lambiase — ICSE-SEIS 2024
Dealing with Cultural Dispersion — Stefano Lambiase — ICSE-SEIS 2024StefanoLambiase
 
Maximizing Efficiency and Profitability with OnePlan’s Professional Service A...
Maximizing Efficiency and Profitability with OnePlan’s Professional Service A...Maximizing Efficiency and Profitability with OnePlan’s Professional Service A...
Maximizing Efficiency and Profitability with OnePlan’s Professional Service A...OnePlan Solutions
 
Automate your Kamailio Test Calls - Kamailio World 2024
Automate your Kamailio Test Calls - Kamailio World 2024Automate your Kamailio Test Calls - Kamailio World 2024
Automate your Kamailio Test Calls - Kamailio World 2024Andreas Granig
 
Software Project Health Check: Best Practices and Techniques for Your Product...
Software Project Health Check: Best Practices and Techniques for Your Product...Software Project Health Check: Best Practices and Techniques for Your Product...
Software Project Health Check: Best Practices and Techniques for Your Product...Velvetech LLC
 
Recruitment Management Software Benefits (Infographic)
Recruitment Management Software Benefits (Infographic)Recruitment Management Software Benefits (Infographic)
Recruitment Management Software Benefits (Infographic)Hr365.us smith
 
ODSC - Batch to Stream workshop - integration of Apache Spark, Cassandra, Pos...
ODSC - Batch to Stream workshop - integration of Apache Spark, Cassandra, Pos...ODSC - Batch to Stream workshop - integration of Apache Spark, Cassandra, Pos...
ODSC - Batch to Stream workshop - integration of Apache Spark, Cassandra, Pos...Christina Lin
 
What are the key points to focus on before starting to learn ETL Development....
What are the key points to focus on before starting to learn ETL Development....What are the key points to focus on before starting to learn ETL Development....
What are the key points to focus on before starting to learn ETL Development....kzayra69
 
Buds n Tech IT Solutions: Top-Notch Web Services in Noida
Buds n Tech IT Solutions: Top-Notch Web Services in NoidaBuds n Tech IT Solutions: Top-Notch Web Services in Noida
Buds n Tech IT Solutions: Top-Notch Web Services in Noidabntitsolutionsrishis
 
EY_Graph Database Powered Sustainability
EY_Graph Database Powered SustainabilityEY_Graph Database Powered Sustainability
EY_Graph Database Powered SustainabilityNeo4j
 
Cloud Management Software Platforms: OpenStack
Cloud Management Software Platforms: OpenStackCloud Management Software Platforms: OpenStack
Cloud Management Software Platforms: OpenStackVICTOR MAESTRE RAMIREZ
 
Folding Cheat Sheet #4 - fourth in a series
Folding Cheat Sheet #4 - fourth in a seriesFolding Cheat Sheet #4 - fourth in a series
Folding Cheat Sheet #4 - fourth in a seriesPhilip Schwarz
 

Recently uploaded (20)

Building a General PDE Solving Framework with Symbolic-Numeric Scientific Mac...
Building a General PDE Solving Framework with Symbolic-Numeric Scientific Mac...Building a General PDE Solving Framework with Symbolic-Numeric Scientific Mac...
Building a General PDE Solving Framework with Symbolic-Numeric Scientific Mac...
 
Intelligent Home Wi-Fi Solutions | ThinkPalm
Intelligent Home Wi-Fi Solutions | ThinkPalmIntelligent Home Wi-Fi Solutions | ThinkPalm
Intelligent Home Wi-Fi Solutions | ThinkPalm
 
Building Real-Time Data Pipelines: Stream & Batch Processing workshop Slide
Building Real-Time Data Pipelines: Stream & Batch Processing workshop SlideBuilding Real-Time Data Pipelines: Stream & Batch Processing workshop Slide
Building Real-Time Data Pipelines: Stream & Batch Processing workshop Slide
 
What is Advanced Excel and what are some best practices for designing and cre...
What is Advanced Excel and what are some best practices for designing and cre...What is Advanced Excel and what are some best practices for designing and cre...
What is Advanced Excel and what are some best practices for designing and cre...
 
BATTLEFIELD ORM: TIPS, TACTICS AND STRATEGIES FOR CONQUERING YOUR DATABASE
BATTLEFIELD ORM: TIPS, TACTICS AND STRATEGIES FOR CONQUERING YOUR DATABASEBATTLEFIELD ORM: TIPS, TACTICS AND STRATEGIES FOR CONQUERING YOUR DATABASE
BATTLEFIELD ORM: TIPS, TACTICS AND STRATEGIES FOR CONQUERING YOUR DATABASE
 
Introduction Computer Science - Software Design.pdf
Introduction Computer Science - Software Design.pdfIntroduction Computer Science - Software Design.pdf
Introduction Computer Science - Software Design.pdf
 
Unveiling the Future: Sylius 2.0 New Features
Unveiling the Future: Sylius 2.0 New FeaturesUnveiling the Future: Sylius 2.0 New Features
Unveiling the Future: Sylius 2.0 New Features
 
Der Spagat zwischen BIAS und FAIRNESS (2024)
Der Spagat zwischen BIAS und FAIRNESS (2024)Der Spagat zwischen BIAS und FAIRNESS (2024)
Der Spagat zwischen BIAS und FAIRNESS (2024)
 
MYjobs Presentation Django-based project
MYjobs Presentation Django-based projectMYjobs Presentation Django-based project
MYjobs Presentation Django-based project
 
Dealing with Cultural Dispersion — Stefano Lambiase — ICSE-SEIS 2024
Dealing with Cultural Dispersion — Stefano Lambiase — ICSE-SEIS 2024Dealing with Cultural Dispersion — Stefano Lambiase — ICSE-SEIS 2024
Dealing with Cultural Dispersion — Stefano Lambiase — ICSE-SEIS 2024
 
Maximizing Efficiency and Profitability with OnePlan’s Professional Service A...
Maximizing Efficiency and Profitability with OnePlan’s Professional Service A...Maximizing Efficiency and Profitability with OnePlan’s Professional Service A...
Maximizing Efficiency and Profitability with OnePlan’s Professional Service A...
 
Automate your Kamailio Test Calls - Kamailio World 2024
Automate your Kamailio Test Calls - Kamailio World 2024Automate your Kamailio Test Calls - Kamailio World 2024
Automate your Kamailio Test Calls - Kamailio World 2024
 
Software Project Health Check: Best Practices and Techniques for Your Product...
Software Project Health Check: Best Practices and Techniques for Your Product...Software Project Health Check: Best Practices and Techniques for Your Product...
Software Project Health Check: Best Practices and Techniques for Your Product...
 
Recruitment Management Software Benefits (Infographic)
Recruitment Management Software Benefits (Infographic)Recruitment Management Software Benefits (Infographic)
Recruitment Management Software Benefits (Infographic)
 
ODSC - Batch to Stream workshop - integration of Apache Spark, Cassandra, Pos...
ODSC - Batch to Stream workshop - integration of Apache Spark, Cassandra, Pos...ODSC - Batch to Stream workshop - integration of Apache Spark, Cassandra, Pos...
ODSC - Batch to Stream workshop - integration of Apache Spark, Cassandra, Pos...
 
What are the key points to focus on before starting to learn ETL Development....
What are the key points to focus on before starting to learn ETL Development....What are the key points to focus on before starting to learn ETL Development....
What are the key points to focus on before starting to learn ETL Development....
 
Buds n Tech IT Solutions: Top-Notch Web Services in Noida
Buds n Tech IT Solutions: Top-Notch Web Services in NoidaBuds n Tech IT Solutions: Top-Notch Web Services in Noida
Buds n Tech IT Solutions: Top-Notch Web Services in Noida
 
EY_Graph Database Powered Sustainability
EY_Graph Database Powered SustainabilityEY_Graph Database Powered Sustainability
EY_Graph Database Powered Sustainability
 
Cloud Management Software Platforms: OpenStack
Cloud Management Software Platforms: OpenStackCloud Management Software Platforms: OpenStack
Cloud Management Software Platforms: OpenStack
 
Folding Cheat Sheet #4 - fourth in a series
Folding Cheat Sheet #4 - fourth in a seriesFolding Cheat Sheet #4 - fourth in a series
Folding Cheat Sheet #4 - fourth in a series
 

System analysis and design

  • 2. SYSTEM  A system is an orderly grouping of interdependent components linked together according to a plan to achieve a specific objective. Systems development is systematic process which includes phases such as planning, analysis, design, deployment, and maintenance. we will primarily focus on −  Systems analysis  Systems design
  • 3. CONSTRAINTS OF A SYSTEM A system must have three basic constraints −  A system must have some structure and behaviour which is designed to achieve a predefined objective.  Interconnectivity and interdependence must exist among the system components.  The objectives of the organization have a higher priority than the objectives of its subsystems. For example, traffic management system, payroll system, automatic library system, human resources information system.
  • 4. PROPERTIES OF A SYSTEM A system has the following properties −  Organization Organization implies structure and order. It is the arrangement of components that helps to achieve predetermined objectives.  Interaction It is defined by the manner in which the components operate with each other. For example, in an organization, purchasing department must interact with production department and payroll with personnel department.  Interdependence Interdependence means how the components of a system depend on one another. For proper functioning, the components are coordinated and linked together according to a specified plan. The output of one subsystem is the required by other subsystem as input.  Integration Integration is concerned with how a system components are connected together. It means that the parts of the system work together within the system even if each part performs a unique function.  Central Objective The objective of system must be central. It may be real or stated. It is not uncommon for an organization to state an objective and operate to achieve another. The users must know the main objective of a computer application early in the analysis for a successful design and conversion.
  • 5. ELEMENTS OF A SYSTEM
  • 6. Outputs and Inputs  The main aim of a system is to produce an output which is useful for its user.  Inputs are the information that enters into the system for processing.  Output is the outcome of processing. Processor(s)  The processor is the element of a system that involves the actual transformation of input into output.  It is the operational component of a system. Processors may modify the input either totally or partially, depending on the output specification.  As the output specifications change, so does the processing. In some cases, input is also modified to enable the processor for handling the transformation. Control  The control element guides the system.  It is the decision–making subsystem that controls the pattern of activities governing input, processing, and output.  The behaviour of a computer System is controlled by the Operating System and software. In order to keep system in balance, what and how much input is needed is determined by Output Specifications. ELEMENTS OF A SYSTEM
  • 7. ELEMENTS OF A SYSTEM Feedback  Feedback provides the control in a dynamic system.  Positive feedback is routine in nature that encourages the performance of the system.  Negative feedback is informational in nature that provides the controller with information for action. Environment  The environment is the “super system” within which an organization operates.  It is the source of external elements that strike on the system.  It determines how a system must function. For example, vendors and competitors of organization’s environment, may provide constraints that affect the actual performance of the business. Boundaries and Interface  A system should be defined by its boundaries. Boundaries are the limits that identify its components, processes, and interrelationship when it interfaces with another system.  Each system has boundaries that determine its sphere of influence and control.  The knowledge of the boundaries of a given system is crucial in determining the nature of its interface with other systems for successful design.
  • 8. TYPES OF SYSTEM The systems can be divided into the following types − Physical or Abstract Systems  Physical systems are tangible entities. We can touch and feel them.  Physical System may be static or dynamic in nature. For example, desks and chairs are the physical parts of computer center which are static. A programmed computer is a dynamic system in which programs, data, and applications can change according to the user's needs.  Abstract systems are non-physical entities or conceptual that may be formulas, representation or model of a real system. Open or Closed Systems  An open system must interact with its environment. It receives inputs from and delivers outputs to the outside of the system. For example, an information system which must adapt to the changing environmental conditions.  A closed system does not interact with its environment. It is isolated from environmental influences. A completely closed system is rare in reality. Adaptive and Non Adaptive System  Adaptive System responds to the change in the environment in a way to improve their performance and to survive. For example, human beings, animals.  Non Adaptive System is the system which does not respond to the environment. For example, machines.
  • 9. TYPES OF SYSTEM Permanent or Temporary System  Permanent System persists for long time. For example, business policies.  Temporary System is made for specified time and after that they are demolished. For example, A DJ system is set up for a program and it is dissembled after the program. Natural and Manufactured System  Natural systems are created by the nature. For example, Solar system, seasonal system.  Manufactured System is the man-made system. For example, Rockets, dams, trains. Deterministic or Probabilistic System  Deterministic system operates in a predictable manner and the interaction between system components is known with certainty. For example, two molecules of hydrogen and one molecule of oxygen makes water.  Probabilistic System shows uncertain behavior. The exact output is not known. For example, Weather forecasting, mail delivery.
  • 10. TYPES OF SYSTEM Social, Human-Machine, Machine System  Social System is made up of people. For example, social clubs, societies.  In Human-Machine System, both human and machines are involved to perform a particular task. For example, Computer programming.  Machine System is where human interference is neglected. All the tasks are performed by the machine. For example, an autonomous robot. Man–Made Information Systems  It is an interconnected set of information resources to manage data for particular organization, under Direct Management Control (DMC).  This system includes hardware, software, communication, data, and application for producing information according to the need of an organization. Man-made information systems are divided into three types :  Formal Information System − It is based on the flow of information in the form of memos, instructions, etc., from top level to lower levels of management.  Informal Information System − This is employee based system which solves the day to day work related problems.  Computer Based System − This system is directly dependent on the computer for managing business applications. For example, automatic library system, railway reservation system, banking system, etc.
  • 11. SYSTEM ANALYSIS  It is a process of collecting and interpreting facts, identifying the problems, and decomposition of a system into its components.  System analysis is conducted for the purpose of studying a system or its parts in order to identify its objectives. It is a problem solving technique that improves the system and ensures that all the components of the system work efficiently to accomplish their purpose.  Analysis specifies what the system should do.
  • 12. SYSTEM DESIGN  It is a process of planning a new business system or replacing an existing system by defining its components or modules to satisfy the specific requirements. Before planning, you need to understand the old system thoroughly and determine how computers can best be used in order to operate efficiently.  System Design focuses on how to accomplish the objective of the system.  System Analysis and Design (SAD) mainly focuses on  Systems  Processes  Technology
  • 13. CASE TOOLS  CASE stands for Computer Aided Software Engineering. It means, development and maintenance of software projects with help of various automated software tools.  CASE tools are set of software application programs, which are used to automate SDLC activities. CASE tools are used by software project managers, analysts and engineers to develop software system.  There are number of CASE tools available to simplify various stages of Software Development Life Cycle such as Analysis tools, Design tools, Project management tools, Database Management tools, Documentation tools are to name a few.  Use of CASE tools accelerates the development of project to produce desired result and helps to uncover flaws before moving ahead with next stage in software development.
  • 14. COMPONENTS OF CASE TOOL  CASE tools are classified in to following categories due to their activities:  1. UPPER CASE Tools  2. LOWER CASE Tools  3. INTEGRATED CASE Tools Upper Case Tools - Upper CASE tools are used in planning, analysis and design stages of SDLC. Lower Case Tools - Lower CASE tools are used in implementation, testing and maintenance. Integrated Case Tools - Integrated CASE tools are helpful in all the stages of SDLC, from Requirement gathering to Testing and documentation. CASE tools can be grouped together if they have similar functionality, process activities and capability of getting integrated with other tools.
  • 15. TYPES OF CASE TOOLS  Diagram tools These tools are used to represent system components, data and control flow among various software components and system structure in a graphical form. For example, Flow Chart Maker tool for creating state- of-the-art flowcharts.  Process Modelling Tools Process modelling is method to create software process model, which is used to develop the software. Process modelling tools help the managers to choose a process model or modify it as per the requirement of software product. For example, EPF Composer  Project Management Tools These tools are used for project planning, cost and effort estimation, project scheduling and resource planning. Managers have to strictly comply project execution with every mentioned step in software project management. Project management tools help in storing and sharing project information in real-time throughout the organization. For example, Creative Pro Office, Trac Project, Basecamp.
  • 16.  Documentation Tools Documentation in a software project starts prior to the software process, goes throughout all phases of SDLC and after the completion of the project. Documentation tools generate documents for technical users and end users. Technical users are mostly in-house professionals of the development team who refer to system manual, reference manual, training manual, installation manuals etc. The end user documents describe the functioning and how-to of the system such as user manual. For example, Doxygen, DrExplain, Adobe Robo Help for documentation.  Analysis Tools These tools help to gather requirements, automatically check for any inconsistency, inaccuracy in the diagrams, data redundancies or erroneous omissions. For example, Accept 360, Accompa, CaseComplete for requirement analysis, Visible Analyst for total analysis.  Design Tools These tools help software designers to design the block structure of the software, which may further be broken down in smaller modules using refinement techniques. These tools provides detailing of each module and interconnections among modules. For example, Animated Software Design
  • 17.  Configuration Management Tools An instance of software is released under one version. Configuration Management tools deal with – Version and revision management Baseline configuration management Change control management CASE tools help in this by automatic tracking, version management and release management. For example, Fossil, Git, Accu REV.  Change Control Tools These tools are considered as a part of configuration management tools. They deal with changes
  • 18. DATA FLOW DIAGRAM  A picture is worth a thousand words. A Data Flow Diagram (DFD) is a traditional way to visualize the information flows within a system. A neat and clear DFD can depict a good amount of the system requirements graphically. It can be manual, automated, or a combination of both.  It shows how information enters and leaves the system, what changes the information and where information is stored. The purpose of a DFD is to show the scope and boundaries of a system as a whole. It may be used as a communications tool between a systems analyst and any person who plays a part in the system that acts as the starting point for redesigning a system.
  • 19. DFD DIAGRAM NOTATIONS External Entity : An external entity can represent a human, system or subsystem. It is where certain data comes from or goes to. It is external to the system we study, in terms of the business process. For this reason, people used to draw external entities on the edge of a diagram.
  • 20. Process : A process receives input data and produces output with a different content or form. Processes can be as simple as collecting input data and saving in the database, or it can be complex as producing a report containing monthly sales of all retail stores in the northwest region. Every process has a name that identifies the function it performs. The name consists of a verb, followed by a singular noun. Example:  Apply Payment  Calculate Commission  Verify Order
  • 21.
  • 22.  Data Store  A data store represents the storage of persistent data required and/or produced by the process. Here are some examples of data stores: membership forms, database tables, etc. Notation for DATA STORE Data can be written into the data store, which is depicted by an outgoing arrow Data can be read from a data store, which is depicted by an incoming arrow. Examples are: inventory, Accounts receivables, Orders, and Daily Payments.  Note that:  A data store must be connected to a process with a data-flow.  Each data store must have at least one input data-flow and at least one output data-flow (even if the output data-flow is a control or confirmation message).
  • 23.  Data Flow  A data flow represents the flow of information, with its direction represented by an arrowhead that shows at the end(s) of flow connector. Example: Customer_info (LastName, FirstName, SS#, Tel #, etc.) Order_info (OrderId, Item#, OrderDate, CustomerID, etc.).
  • 24. Notation for DATA flow Straight lines with incoming arrows are input data flow Straight lines with outgoing arrows are output data flows Note that: Because every process changes data from one form into another, at least one data-flow must enter and one data-flow must exit each process symbol.
  • 25. RULE OF DATA FLOW
  • 26. FREQUENTLY-MADE MISTAKES IN DFD A second class of DFD mistakes arise when the outputs from one processing step do not match its inputs and they can be classified as: Black holes - A processing step may have input flows but no output flows. Miracles - A processing step may have output flows but no input flows. Grey holes - A processing step may have outputs that are greater than the sum of its inputs
  • 27. FOOD ORDERING SYSTEM – LEVEL 0 DFD Shows the overview of the boundaries of a system No technical knowledge is required to understand with the simple notation Simple to draw, amend and elaborate as its limited notation
  • 28. FOOD ORDERING SYSTEM – LEVEL 1 DFD
  • 29. FOOD ORDERING SYSTEM – LEVEL 1 DFD  The Food Order System Data Flow Diagram example contains three processes, four external entities, and two data stores.  Based on the diagram, we know that a Customer can place an Order. The Order Food process receives the Order, forwards it to the Kitchen, store it in the Order data store, and store the updated Inventory details in the Inventory data store. The process also delivers a Bill to the Customer.  The Manager can receive Reports through the Generate Reports process, which takes Inventory details and Orders as input from the Inventory and Order data store respectively.  The Manager can also initiate the Order Inventory process by providing Inventory order. The process forwards the Inventory order to the Supplier and stores the updated Inventory details in the Inventory data store.
  • 30. SUPERMARKET APP – LEVEL 0 DFD In between the process and the external entity, there is a bi-directional connector, which indicates the existence of information exchange between customer and the app, and the information flow is bi- directional.
  • 31. SUPERMARKET APP – LEVEL 1 DFD
  • 32. LEVEL 1 DFD DESCRIPTION  The Supermarket App Data Flow Diagram example contains five processes, one external entity and three data stores. Although there is no design guideline that governs the positioning of shapes in a Data Flow Diagram, we tend to put the processes in the middle and data stores and external entities on the sides to make it easier to comprehend.  Based on the diagram, we know that a Customer can receive Hot promotion news from the Check Latest Promotions process and the news is provided by the Company database. Note that by common sense we know that Check Latest Promotions is likely to be a feature of the app but the Data Flow Diagram itself implies no such thing. Theoretically speaking, a process in Data Flow Diagram may correspond to a feature or a set of features.  A Customer can Build Shopping List by providing Items details and the details will be stored in the Shopping Cart database. The Warehouse database will also provide the Items details required to complete the process.  A Customer can receive Shopping list details from the View Shopping List process and such details is provided by the Shopping Cart database.  A Customer can receive Items details by performing the Search Items process. He/she must provide an Item name for searching and the item details are returned from the Warehouse database after searched. Although we said that the search result is returned after searching, the Data Flow Diagram, again, implies no such thing. It is our common sense that leads us to interpret the diagram in the way that we understand it naturally. Keep in mind that Data Flow Diagram only tells you where information exchange takes place. It does not answer in what way and in what order the information is being used throughout a system. If this information is important and worth mentioning, consider to model it with diagrams like BPMN Business Process Diagram or UML Activity Diagram.  Finally, a Customer can receive Supermarkets' physical location details by performing Check Locations and the details is provided by the Company database.
  • 33. THE VIDEO RENTAL SYSTEM EXAMPLE LEVEL 0 DFD Notes: There are two external entities, namely Customer and Manager. In between the process and the external entities, there are data flow connectors indicating the existence of information exchange between customer and the system
  • 36.  The Video Rental System Data Flow Diagram example contains three processes, two external entities and two data stores. Although there is no design guideline that governs the positioning of shapes in a Data Flow Diagram, we tend to put the processes in the middle and data stores and external entities on the sides to make it easier to comprehend.  Based on the diagram, we know that a Customer makes a Video request to the Rent Video process. The Rent Video process also receives Video info. from the Video Library data store. As a result, the process produces a Bill to the Customer, and stores the Rental info. into the Rental data store.  A Customer can Return Video by providing Video & Rental info. The process stores the Video info. into the Video Library data store and Rental info. into the Rental data store. As a result, Return receipt is delivered to the Customer. Although we said that the receipt is delivered as a result of the Return Video process, the Data Flow Diagram implies no such thing. It is our common sense that lead us to interpret the diagram in the way that we understand it naturally. Strictly speaking, the diagram only tells us the Return Video process receives Video & Rental info. and produces Video info., Rental info., and Return receipt, with no order specified. Note that Data Flow Diagram does not answer in what way and in what order the information is being used throughout a system. If this information is important and worth mentioning, consider to model it with diagrams like BPMN Business Process Diagram or UML Activity Diagram.  Finally, a Manager can receive Rental report from the Generate Rental Report process and the information involved is provided by the Rental data store.
  • 37. LEVEL 0 DFD HOSTEL MESS BILLING
  • 38. LEVEL 1 DFD FOR HOSTEL BILLING
  • 39. LEVEL 1 DFD FOR LIBRARY MANAGEMENT
  • 40. DECISION TABLE  Decision tables are a concise visual representation for specifying which actions to perform depending on given conditions. They are algorithms whose output is a set of actions. The information expressed in decision tables could also be represented as decision trees or in a programming language as a series of if-then-else and switch-case statements.
  • 41.  Decision table testing is a software testing technique used to test system behavior for different input combinations. This is a systematic approach where the different input combinations and their corresponding system behavior (Output) are captured in a tabular form. That is why it is also called as a Cause-Effect table where Cause and effects are captured for better test coverage.  A Decision Table is a tabular representation of inputs versus rules/cases/test conditions. Let's learn with an example.  Example 1: How to make Decision Base Table for Login Screen
  • 42.  The condition is simple if the user provides correct username and password the user will be redirected to the homepage. If any of the input is wrong, an error message will be displayed.
  • 43.
  • 44.
  • 45. WHY IS DECISION TABLE TESTING IS IMPORTANT?  This testing technique becomes important when it is required to test different combination. It also helps in better test coverage for complex business logic.  In Software Engineering, boundary value and equivalent partition are other similar techniques used to ensure better coverage. They are used if the system shows the same behaviour for a large set of inputs. However, in a system where for each set of input values the system behaviour is different, boundary value and equivalent partitioning technique are not effective in ensuring good test coverage.  In this case, decision table testing is a good option. This technique can make sure of good coverage, and the representation is simple so that it is easy to interpret and use.  This table can be used as the reference for the requirement and for the functionality development since it is easy to understand and cover all the combinations.  The significance of this technique becomes immediately clear as the number of inputs increases. Number of possible Combinations is given by 2 ^ n , where n is the number of Inputs. For n = 10, which is very common in the web based testing, having big input forms, the number of combinations will be 1024. Obviously, you cannot test all but you will choose a rich sub-set of the possible combinations using decision based testing technique.
  • 46. ADVANTAGES OF DECISION TABLE TESTING  When the system behaviour is different for different input and not same for a range of inputs, both equivalent partitioning, and boundary value analysis won't help, but decision table can be used.  The representation is simple so that it can be easily interpreted and is used for development and business as well.  This table will help to make effective combinations and can ensure a better coverage for testing  Any complex business conditions can be easily turned into decision tables  In a case we are going for 100% coverage typically when the input combinations are low, this technique can ensure the coverage.
  • 47. SYSTEM FLOWCHART  System flowcharts are a way of displaying how data flows in a system and how decisions are made to control events. To illustrate this, symbols are used. They are connected together to show what happens to data and where it goes. The basic ones include
  • 49.  A system flowchart symbolically shows how data flows throughout a system and how event-controlling decisions are made. For instance, this template shows the flow for logging into an online service.
  • 50. TRAFFIC LIGHT CONTROLLER – SYSTEM FLOW DIAGRAM
  • 51. ER DIAGRAM  An entity relationship diagram (ERD) shows the relationships of entity sets stored in a database. An entity in this context is an object, a component of data. An entity set is a collection of similar entities.  By defining the entities, their attributes, and showing the relationships between them, an ER diagram illustrates the logical structure of databases. ER diagrams are used to sketch out the design of a database.  The ER or (Entity Relational Model) is a high-level conceptual data model diagram. Entity-Relation model is based on the notion of real-world entities and the relationship between them.  ER modelling helps you to analyze data requirements systematically to produce a well-designed database. So, it is considered a best practice to complete ER modeling before implementing your database.
  • 52. History of ER models  ER diagrams are a visual tool which is helpful to represent the ER model. It was proposed by Peter Chen in 1971 to create a uniform convention which can be used for relational database and network. He aimed to use an ER model as a conceptual modeling approach. What is ER Diagrams?  Entity relationship diagram displays the relationships of entity set stored in a database. In other words, we can say that ER diagrams help you to explain the logical structure of databases. At first look, an ER diagram looks very similar to the flowchart. However, ER Diagram includes many specialized symbols, and its meanings make this model unique.
  • 53.
  • 54. Facts about ER Diagram Model:  ER model allows you to draw Database Design  It is an easy to use graphical tool for modeling data  Widely used in Database Design  It is a GUI representation of the logical structure of a Database  It helps you to identifies the entities which exist in a system and the relationships between those entities
  • 55.  Why use ER Diagrams?  Here, are prime reasons for using the ER Diagram  Helps you to define terms related to entity relationship modelling  Provide a preview of how all your tables should connect, what fields are going to be on each table  Helps to describe entities, attributes, relationships  ER diagrams are translatable into relational tables which allows you to build databases quickly  ER diagrams can be used by database designers as a blueprint for implementing data in specific software applications  The database designer gains a better understanding of the information to be contained in the database with the help of ERP diagram  ERD is allowed you to communicate with the logical structure of the database to users  Components of the ER Diagram  This model is based on three basic concepts:  Entities  Attributes  Relationships
  • 56.  Example : For example, in a University database, we might have entities for Students, Courses, and Lecturers. Students entity can have attributes like Rollno, Name, and DeptID. They might have relationships with Courses and Lecturers.
  • 57. WHAT IS ENTITY? A real-world thing either living or non-living that is easily recognizable and nonrecognizable. It is anything in the enterprise that is to be represented in our database. It may be a physical thing or simply a fact about the enterprise or an event that happens in the real world. An entity can be place, person, object, event or a concept, which stores data in the database. The characteristics of entities are must have an attribute, and a unique key. Every entity is made up of some 'attributes' which represent that entity. Examples of entities: Person: Employee, Student, Patient Place: Store, Building Object: Machine, product, and Car Event: Sale, Registration, Renewal Concept: Account, Course Entity set: An entity set is a group of similar kind of entities. It may contain entities with attribute sharing similar values. Entities are represented by their properties, which also called attributes. All attributes have their separate values. For example, a student entity may have a name, age, class, as attributes.
  • 58. Relationship Relationship is nothing but an association among two or more entities. E.g., Tom works in the Chemistry department. Entities take part in relationships. We can often identify relationships with verbs or verb phrases. For example: You are attending this lecture I am giving the lecture Just loke entities, we can classify relationships according to relationship-types: A student attends a lecture A lecturer is giving a lecture.
  • 59.  Weak Entities : A weak entity is a type of entity which doesn't have its key attribute. It can be identified uniquely by considering the primary key of another entity. For that, weak entity sets need to have participation. In above example, "Trans No" is a discriminator within a group of transactions in an ATM.
  • 60. Strong Entity Set Weak Entity Set Strong entity set always has a primary key. It does not have enough attributes to build a primary key. It is represented by a rectangle symbol. It is represented by a double rectangle symbol. It contains a Primary key represented by the underline symbol. It contains a Partial Key which is represented by a dashed underline symbol. The member of a strong entity set is called as dominant entity set. The member of a weak entity set called as a subordinate entity set. Primary Key is one of its attributes which helps to identify its member. In a weak entity set, it is a combination of primary key and partial key of the strong entity set. In the ER diagram the relationship between two strong entity set shown by using a diamond symbol. The relationship between one strong and a weak entity set shown by using the double diamond symbol. The connecting line of the strong entity set with the relationship is single. The line connecting the weak entity set for identifying relationship is double.
  • 61.  Attributes  It is a single-valued property of either an entity-type or a relationship-type.  For example, a lecture might have attributes: time, date, duration, place, etc.  An attribute is represented by an Ellipse
  • 62.  Cardinality  Defines the numerical attributes of the relationship between two entities or entity sets.  Different types of cardinal relationships are:  One-to-One Relationships  One-to-Many Relationships  May to One Relationships  Many-to-Many Relationships
  • 63. 1. Many-to-Many Cardinality- By this cardinality constraint, An entity in set A can be associated with any number (zero or more) of entities in set B. An entity in set B can be associated with any number (zero or more) of entities in set A. Symbol Used- Example-Consider the following ER diagram- Here, One student can enroll in any number (zero or more) of courses. One course can be enrolled by any number (zero or more) of students.
  • 64. 2. Many-to-One Cardinality- By this cardinality constraint, An entity in set A can be associated with at most one entity in set B. An entity in set B can be associated with any number (zero or more) of entities in set A. Symbol Used- One student can enroll in at most one course. One course can be enrolled by any number (zero or more of students.
  • 65. 3. One-to-Many Cardinality- By this cardinality constraint, An entity in set A can be associated with any number (zero or more) of entities in set B. An entity in set B can be associated with at most one entity in set A. Symbol Used-
  • 66. 4. One-to-One Cardinality- By this cardinality constraint, An entity in set A can be associated with at most one entity in set B. An entity in set B can be associated with at most one entity in set A. Symbol Used-
  • 67. ER- Diagram Notations ER- Diagram is a visual representation of data that describe how data is related to each other. Rectangles: This symbol represent entity types Ellipses : Symbol represent attributes Diamonds: This symbol represents relationship types Lines: It links attributes to entity types and entity types with other relationship types Primary key: attributes are underlined Double Ellipses: Represent multi-valued attributes