The document discusses various functions including:
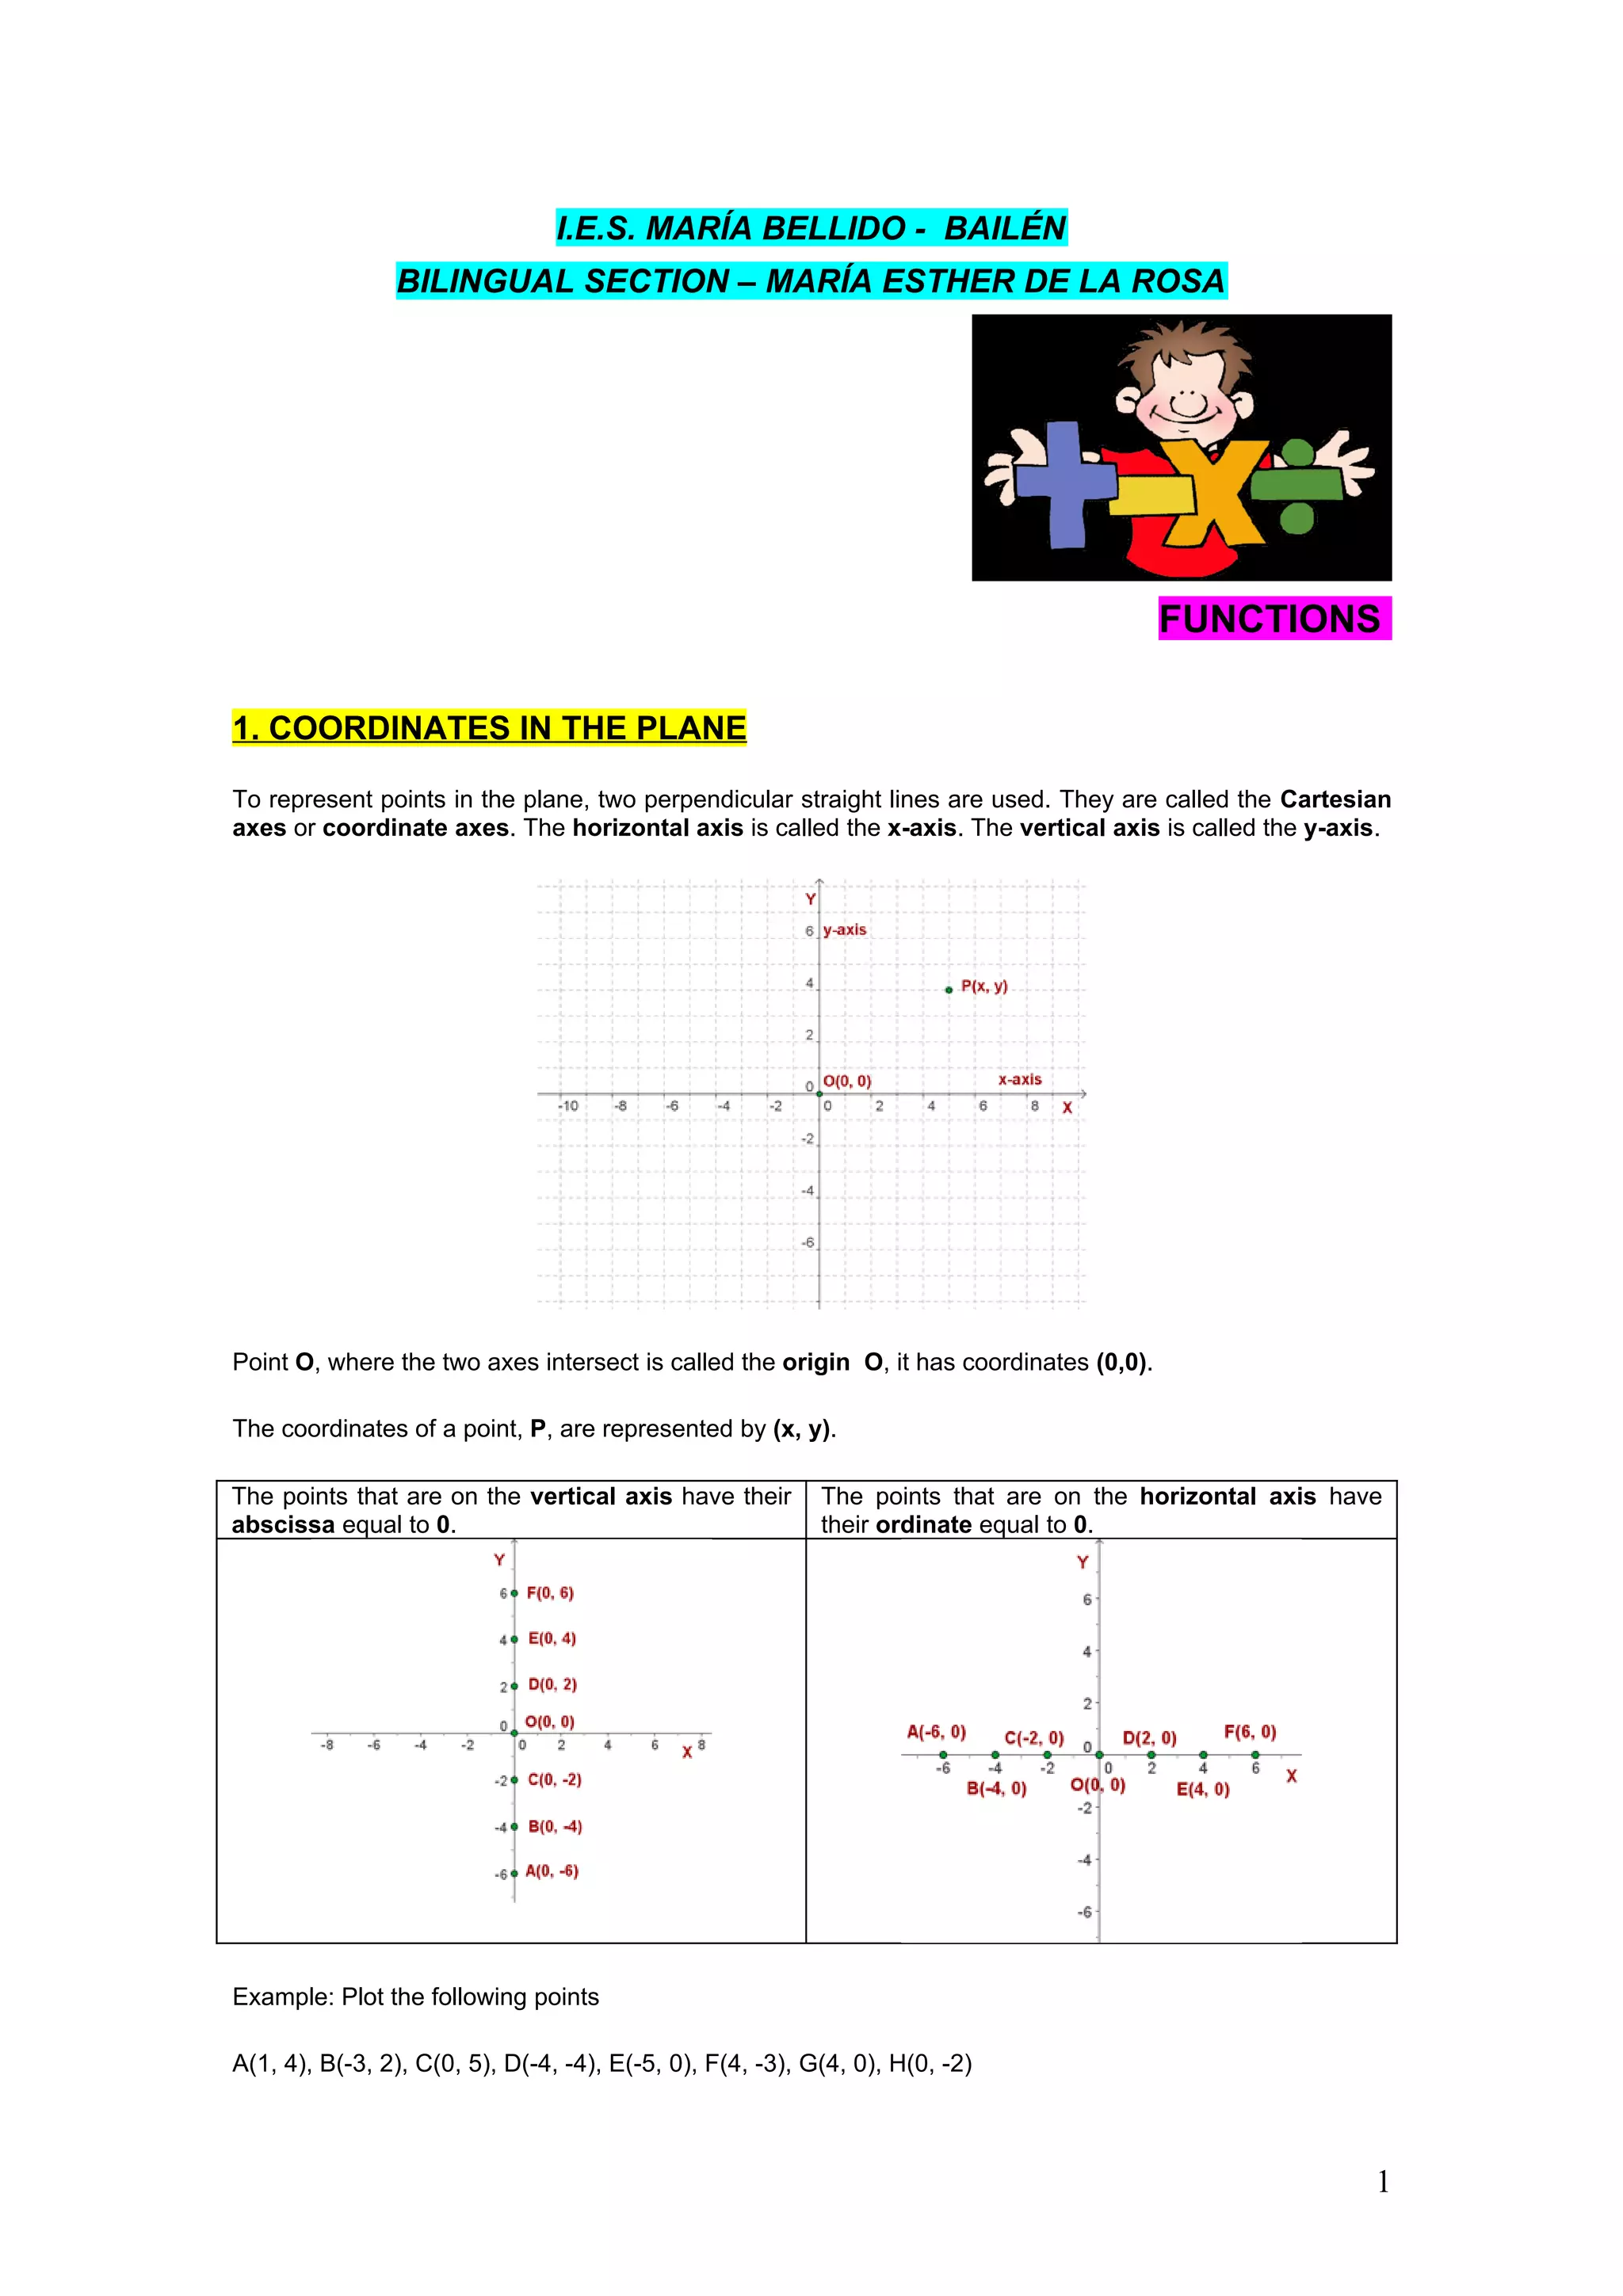
1. Coordinate planes and plotting points.
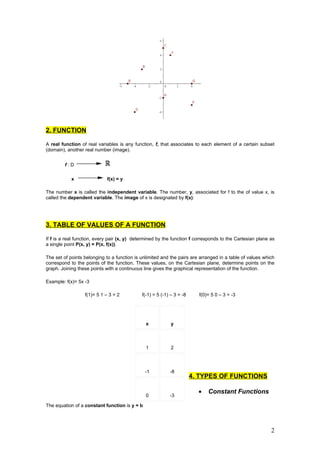
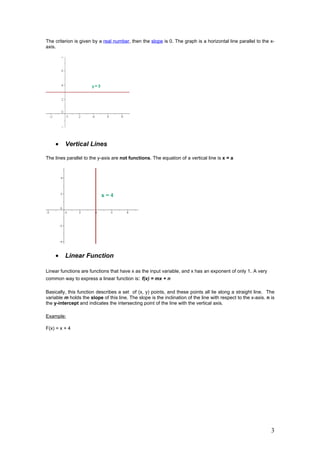
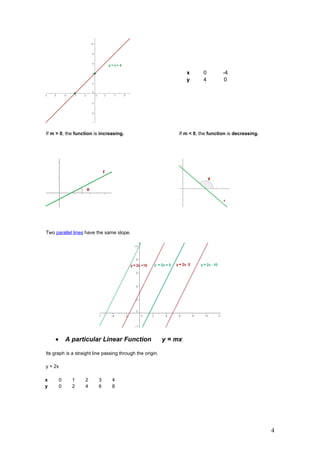
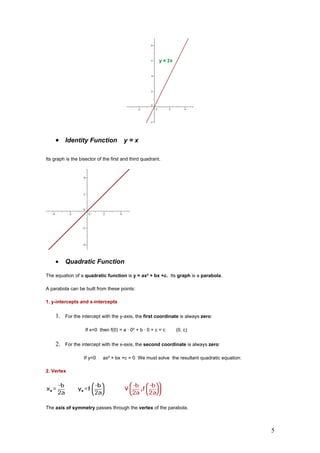
2. Linear functions defined as f(x)=mx+b and their properties like slope and intercepts.
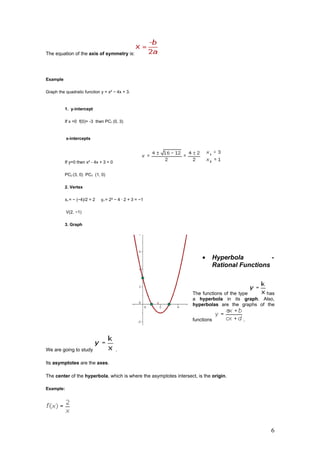
3. Quadratic functions defined as f(x)=ax^2+bx+c and their properties like intercepts, vertex, and parabolic graph shape.
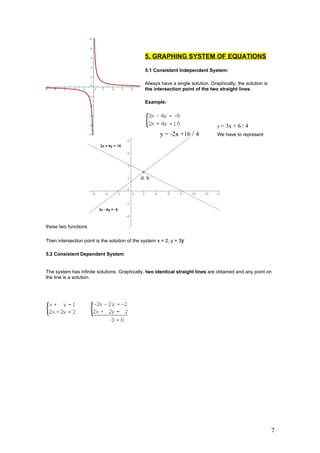
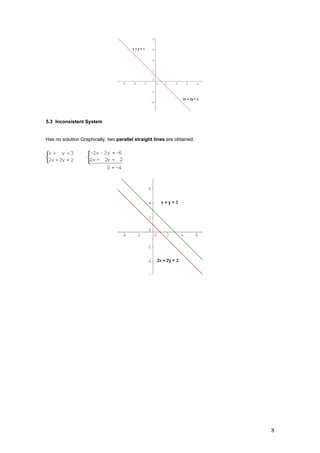
3. Systems of equations and their graphical representations as either a single intersection point, identical overlapping lines, or parallel non-intersecting lines depending on if the systems are consistent/dependent or inconsistent.


![Getting Started with Apache Spark: Big Data Made Simple [Free Meetup]](https://cdn.slidesharecdn.com/ss_thumbnails/apachesparkgettingstarted-260203175547-8361bcc3-thumbnail.jpg?width=640&height=640&fit=bounds)


