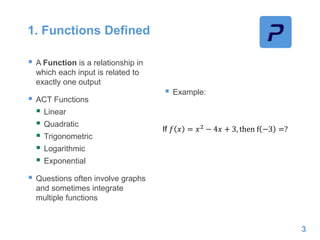
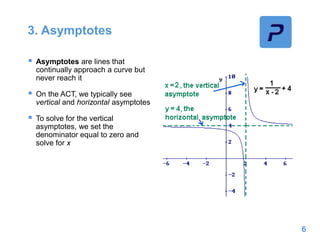
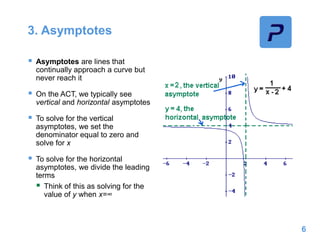
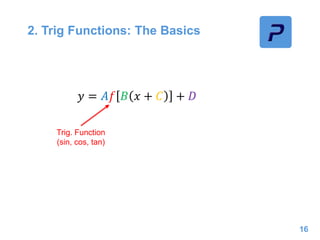
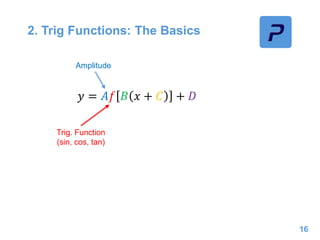
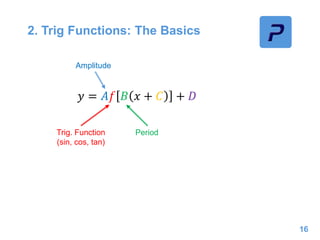
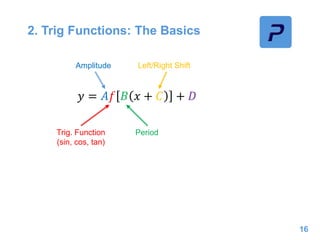
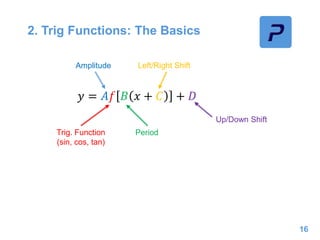
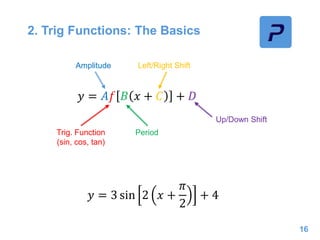
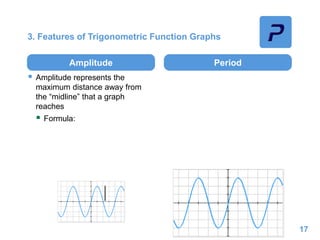
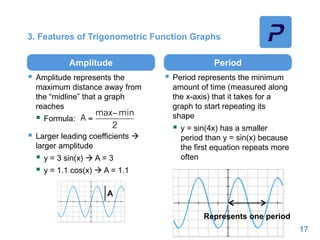
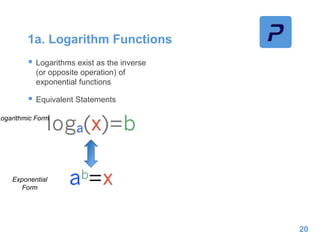
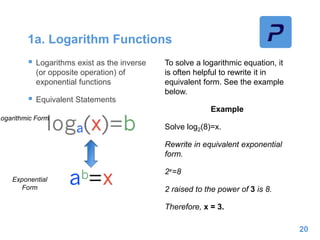
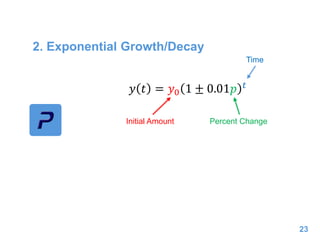
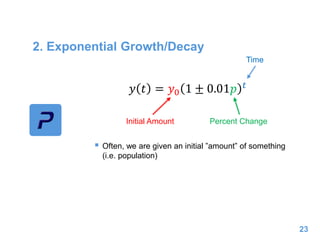
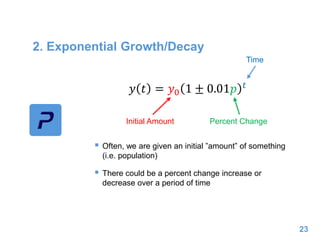
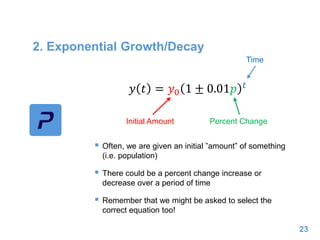
Table of Contents
1
I. Number & Quantity
II. Algebra
III. Functions
IV. Geometry
V. Statistics & Probability
VI. Integrating Essential Skills
III. Functions
2
A. Properties of Functions
B. Linear Functions
C. Quadratic Functions
D. Trigonometric Functions
E. Other Functions
F. Sequences
G. Functions Modeling
1. Functions Defined
 A Function is a relationship in
which each input is related to
exactly one output
 ACT Functions
 Linear
 Quadratic
 Trigonometric
 Logarithmic
 Exponential
 Questions often involve graphs
and sometimes integrate
multiple functions
 Example:
3
If 𝑓 𝑥 = 𝑥2
− 4𝑥 + 3, then f −3 =?
#1
4
Calculator?
Answer Choice Approach?
Drawing?
Hypothetical Numbers?
#1
4
Answer: D
Calculator?
Answer Choice Approach?
Drawing?
Hypothetical Numbers?
2. Domain and Range
Domain
 The set of all possible x values
that output real y values
Range
 The set of all possible output
values (y values)
5
2. Domain and Range
Domain
 The set of all possible x values
that output real y values
Range
 The set of all possible output
values (y values)
5
It can often be helpful to graph a function to “visualize” its domain and range!
3. Asymptotes
6
3. Asymptotes
 Asymptotes are lines that
continually approach a curve but
never reach it
 On the ACT, we typically see
vertical and horizontal asymptotes
6
3. Asymptotes
 Asymptotes are lines that
continually approach a curve but
never reach it
 On the ACT, we typically see
vertical and horizontal asymptotes
6
3. Asymptotes
 Asymptotes are lines that
continually approach a curve but
never reach it
 On the ACT, we typically see
vertical and horizontal asymptotes
 To solve for the vertical
asymptotes, we set the
denominator equal to zero and
solve for x
6
3. Asymptotes
 Asymptotes are lines that
continually approach a curve but
never reach it
 On the ACT, we typically see
vertical and horizontal asymptotes
 To solve for the vertical
asymptotes, we set the
denominator equal to zero and
solve for x
 To solve for the horizontal
asymptotes, we divide the leading
terms
 Think of this as solving for the
value of y when x=∞
6
#2
7
Calculator?
Answer Choice Approach?
Drawing?
Hypothetical Numbers?
#2
7
Answer: C
Calculator?
Answer Choice Approach?
Drawing?
Hypothetical Numbers?
III. Functions
8
A. Properties of Functions
B. Linear Functions
C. Quadratic Functions
D. Trigonometric Functions
E. Other Functions
F. Sequences
G. Functions Modeling
Linear Functions
9
𝑓 𝑥 = −
1
2
𝑥 +
1
2
Linear Functions
 Linear Functions are those that
result in a straight line when
graphed
9
𝑓 𝑥 = −
1
2
𝑥 +
1
2
Linear Functions
 Linear Functions are those that
result in a straight line when
graphed
 Slope:
9
𝑓 𝑥 = −
1
2
𝑥 +
1
2
Linear Functions
 Linear Functions are those that
result in a straight line when
graphed
 Slope:
9
𝑓 𝑥 = −
1
2
𝑥 +
1
2
∆𝑦
∆𝑥
=
𝑦2 − 𝑦1
𝑥2 − 𝑥1
Linear Functions
 Linear Functions are those that
result in a straight line when
graphed
 Slope:
 Perpendicular Line has a slope
with
 Opposite Sign
 Reciprocal
9
𝑓 𝑥 = −
1
2
𝑥 +
1
2
∆𝑦
∆𝑥
=
𝑦2 − 𝑦1
𝑥2 − 𝑥1
#3
10
Calculator?
Answer Choice Approach?
Drawing?
Hypothetical Numbers?
#3
10
Answer: B
Calculator?
Answer Choice Approach?
Drawing?
Hypothetical Numbers?
III. Functions
11
A. Properties of Functions
B. Linear Functions
C. Quadratic Functions
D. Trigonometric Functions
E. Other Functions
F. Sequences
G. Functions Modeling
Quadratic Functions
12
Quadratic Functions
 Quadratic Functions are
equations that form parabolas
when graphed in the coordinate
plane
12
Quadratic Functions
 Quadratic Functions are
equations that form parabolas
when graphed in the coordinate
plane
 Often, quadratic function
questions on the ACT involve the
intersection of multiple functions
(i.e. a line with a parabola or a
circle with a parabola)
12
Quadratic Functions
 Quadratic Functions are
equations that form parabolas
when graphed in the coordinate
plane
 Often, quadratic function
questions on the ACT involve the
intersection of multiple functions
(i.e. a line with a parabola or a
circle with a parabola)
 Hint: it can be helpful to graph
these functions by hand or on
the calculator!
12
#4
13
Calculator?
Answer Choice Approach?
Drawing?
Hypothetical Numbers?
#4
13
Answer: A
Calculator?
Answer Choice Approach?
Drawing?
Hypothetical Numbers?
III. Functions
14
A. Properties of Functions
B. Linear Functions
C. Quadratic Functions
D. Trigonometric Functions
E. Other Functions
F. Sequences
G. Functions Modeling
1. Measuring Angles in Radians
15
1. Measuring Angles in Radians
 Radians are used occasionally on the ACT
 Radians are a second way of measuring angles
 Radians : Degrees :: Inch : Centimeter
15
1. Measuring Angles in Radians
 Radians are used occasionally on the ACT
 Radians are a second way of measuring angles
 Radians : Degrees :: Inch : Centimeter
15
1. Measuring Angles in Radians
 Radians are used occasionally on the ACT
 Radians are a second way of measuring angles
 Radians : Degrees :: Inch : Centimeter
 Conversion between angles in degrees and radians
 Use the proportion below.
 Fill in either the degree measure or radian measure you have
been given.
 Solve for the other using cross multiplication.
15
45° in radians?
2. Trig Functions: The Basics
16
𝑦 = 𝐴𝑓 𝐵 𝑥 + 𝐶 + 𝐷
2. Trig Functions: The Basics
16
𝑦 = 𝐴𝑓 𝐵 𝑥 + 𝐶 + 𝐷
Trig. Function
(sin, cos, tan)
2. Trig Functions: The Basics
16
𝑦 = 𝐴𝑓 𝐵 𝑥 + 𝐶 + 𝐷
Trig. Function
(sin, cos, tan)
Amplitude
2. Trig Functions: The Basics
16
𝑦 = 𝐴𝑓 𝐵 𝑥 + 𝐶 + 𝐷
Trig. Function
(sin, cos, tan)
Amplitude
Period
2. Trig Functions: The Basics
16
𝑦 = 𝐴𝑓 𝐵 𝑥 + 𝐶 + 𝐷
Trig. Function
(sin, cos, tan)
Amplitude
Period
Left/Right Shift
2. Trig Functions: The Basics
16
𝑦 = 𝐴𝑓 𝐵 𝑥 + 𝐶 + 𝐷
Trig. Function
(sin, cos, tan)
Amplitude
Period
Left/Right Shift
Up/Down Shift
2. Trig Functions: The Basics
16
𝑦 = 𝐴𝑓 𝐵 𝑥 + 𝐶 + 𝐷
Trig. Function
(sin, cos, tan)
Amplitude
Period
Left/Right Shift
Up/Down Shift
𝑦 = 3 sin 2 𝑥 +
𝜋
2
+ 4
3. Features of Trigonometric Function Graphs
Amplitude Period
17
3. Features of Trigonometric Function Graphs
Amplitude
 Amplitude represents the
maximum distance away from
the “midline” that a graph
reaches
 Formula:
Period
17
3. Features of Trigonometric Function Graphs
Amplitude
 Amplitude represents the
maximum distance away from
the “midline” that a graph
reaches
 Formula:
Period
17
3. Features of Trigonometric Function Graphs
Amplitude
 Amplitude represents the
maximum distance away from
the “midline” that a graph
reaches
 Formula:
 Larger leading coefficients 
larger amplitude
 y = 3 sin(x)  A = 3
 y = 1.1 cos(x)  A = 1.1
Period
17
3. Features of Trigonometric Function Graphs
Amplitude
 Amplitude represents the
maximum distance away from
the “midline” that a graph
reaches
 Formula:
 Larger leading coefficients 
larger amplitude
 y = 3 sin(x)  A = 3
 y = 1.1 cos(x)  A = 1.1
Period
17
A
3. Features of Trigonometric Function Graphs
Amplitude
 Amplitude represents the
maximum distance away from
the “midline” that a graph
reaches
 Formula:
 Larger leading coefficients 
larger amplitude
 y = 3 sin(x)  A = 3
 y = 1.1 cos(x)  A = 1.1
Period
 Period represents the minimum
amount of time (measured along
the x-axis) that it takes for a
graph to start repeating its
shape
 y = sin(4x) has a smaller
period than y = sin(x) because
the first equation repeats more
often
17
A
Represents one period
#5
18
Calculator?
Answer Choice Approach?
Drawing?
Hypothetical Numbers?
#5
18
Answer: B
Calculator?
Answer Choice Approach?
Drawing?
Hypothetical Numbers?
III. Functions
19
A. Properties of Functions
B. Linear Functions
C. Quadratic Functions
D. Trigonometric Functions
E. Other Functions
F. Sequences
G. Functions Modeling
1a. Logarithm Functions
 Logarithms exist as the inverse
(or opposite operation) of
exponential functions
 Equivalent Statements
20
Logarithmic Form
Exponential
Form
1a. Logarithm Functions
 Logarithms exist as the inverse
(or opposite operation) of
exponential functions
 Equivalent Statements
To solve a logarithmic equation, it
is often helpful to rewrite it in
equivalent form. See the example
below.
Example
Solve log2(8)=x.
Rewrite in equivalent exponential
form.
2x=8
2 raised to the power of 3 is 8.
Therefore, x = 3.
20
Logarithmic Form
Exponential
Form
1b. Basic Properties of Logarithms
 Basic properties to use in
simplification of logarithmic
expressions
1. log(ab) = log(a) + log(b)
2. log(a/b) = log(a) – log(b)
3. log(ax) = x  log(a)
4. loga(ax) = x
Examples of Each Property
1. log(3x) = log(3) + log(x)
2. log(x/4) = log(x) – log(4)
3. log(x3) = 3log(x)
4. log2(25) = 5
21
#6
22
Calculator?
Answer Choice Approach?
Drawing?
Hypothetical Numbers?
#6
22
Answer: B
Calculator?
Answer Choice Approach?
Drawing?
Hypothetical Numbers?
2. Exponential Growth/Decay
23
𝑦 𝑡 = 𝑦0 1 ± 0.01𝑝 𝑡
2. Exponential Growth/Decay
23
𝑦 𝑡 = 𝑦0 1 ± 0.01𝑝 𝑡
Initial Amount
2. Exponential Growth/Decay
23
𝑦 𝑡 = 𝑦0 1 ± 0.01𝑝 𝑡
Initial Amount Percent Change
2. Exponential Growth/Decay
23
𝑦 𝑡 = 𝑦0 1 ± 0.01𝑝 𝑡
Initial Amount Percent Change
Time
2. Exponential Growth/Decay
 Often, we are given an initial ”amount” of something
(i.e. population)
23
𝑦 𝑡 = 𝑦0 1 ± 0.01𝑝 𝑡
Initial Amount Percent Change
Time
2. Exponential Growth/Decay
 Often, we are given an initial ”amount” of something
(i.e. population)
 There could be a percent change increase or
decrease over a period of time
23
𝑦 𝑡 = 𝑦0 1 ± 0.01𝑝 𝑡
Initial Amount Percent Change
Time
2. Exponential Growth/Decay
 Often, we are given an initial ”amount” of something
(i.e. population)
 There could be a percent change increase or
decrease over a period of time
 Remember that we might be asked to select the
correct equation too!
23
𝑦 𝑡 = 𝑦0 1 ± 0.01𝑝 𝑡
Initial Amount Percent Change
Time
#7
24
Calculator?
Answer Choice Approach?
Drawing?
Hypothetical Numbers?
#7
24
Answer: D
Calculator?
Answer Choice Approach?
Drawing?
Hypothetical Numbers?
3. Equation for a Circle
The equation for a circle of radius “r” and center (h,k):
(x – h)2 + (y – k)2 = r2
What you should be able to do:
 From an equation…
 State the radius
 State the center
 Find y-intercepts (set x=0 and solve)
 Find x-intercepts (set y=0 and solve)
 Recognize a graph
 From a graph…
 Find an equation
25
#8
26
Calculator?
Answer Choice Approach?
Drawing?
Hypothetical Numbers?
#8
26
Answer: A
Calculator?
Answer Choice Approach?
Drawing?
Hypothetical Numbers?
III. Functions
27
A. Properties of Functions
B. Linear Functions
C. Quadratic Functions
D. Trigonometric Functions
E. Other Functions
F. Sequences
G. Functions Modeling
1. Arithmetic Sequences
28
1. Arithmetic Sequences
 An Arithmetic Sequence is one
in which the difference between
consecutive terms is constant
28
1. Arithmetic Sequences
 An Arithmetic Sequence is one
in which the difference between
consecutive terms is constant
 When we are asked about an
arithmetic sequence, we should
know to add or subtract by the
same number between terms
28
1. Arithmetic Sequences
 An Arithmetic Sequence is one
in which the difference between
consecutive terms is constant
 When we are asked about an
arithmetic sequence, we should
know to add or subtract by the
same number between terms
 When sequences involve a small
number of terms, we can often
write them out!
28
2. Geometric Sequences
29
2. Geometric Sequences
 A Geometric Sequence is one
in which numbers in the
sequence differ by a factor
29
2. Geometric Sequences
 A Geometric Sequence is one
in which numbers in the
sequence differ by a factor
 When we are asked about a
geometric sequence, we should
know to multiply or divide
between terms
29
2. Geometric Sequences
 A Geometric Sequence is one
in which numbers in the
sequence differ by a factor
 When we are asked about a
geometric sequence, we should
know to multiply or divide
between terms
 Sometimes, we apply skills from
sequences to discover patterns
for other problem types as well
29
#9
30
Calculator?
Answer Choice Approach?
Drawing?
Hypothetical Numbers?
#9
30
Answer: A
Calculator?
Answer Choice Approach?
Drawing?
Hypothetical Numbers?
III. Functions
31
A. Properties of Functions
B. Linear Functions
C. Quadratic Functions
D. Trigonometric Functions
E. Other Functions
F. Sequences
G. Functions Modeling
#10
32
Calculator?
Answer Choice Approach?
Drawing?
Hypothetical Numbers?
#10
32
Answer: A
Calculator?
Answer Choice Approach?
Drawing?
Hypothetical Numbers?

Math Functions

  • 1.
    Table of Contents 1 I.Number & Quantity II. Algebra III. Functions IV. Geometry V. Statistics & Probability VI. Integrating Essential Skills
  • 2.
    III. Functions 2 A. Propertiesof Functions B. Linear Functions C. Quadratic Functions D. Trigonometric Functions E. Other Functions F. Sequences G. Functions Modeling
  • 3.
    1. Functions Defined A Function is a relationship in which each input is related to exactly one output  ACT Functions  Linear  Quadratic  Trigonometric  Logarithmic  Exponential  Questions often involve graphs and sometimes integrate multiple functions  Example: 3 If 𝑓 𝑥 = 𝑥2 − 4𝑥 + 3, then f −3 =?
  • 4.
  • 5.
    #1 4 Answer: D Calculator? Answer ChoiceApproach? Drawing? Hypothetical Numbers?
  • 6.
    2. Domain andRange Domain  The set of all possible x values that output real y values Range  The set of all possible output values (y values) 5
  • 7.
    2. Domain andRange Domain  The set of all possible x values that output real y values Range  The set of all possible output values (y values) 5 It can often be helpful to graph a function to “visualize” its domain and range!
  • 8.
  • 9.
    3. Asymptotes  Asymptotesare lines that continually approach a curve but never reach it  On the ACT, we typically see vertical and horizontal asymptotes 6
  • 10.
    3. Asymptotes  Asymptotesare lines that continually approach a curve but never reach it  On the ACT, we typically see vertical and horizontal asymptotes 6
  • 11.
    3. Asymptotes  Asymptotesare lines that continually approach a curve but never reach it  On the ACT, we typically see vertical and horizontal asymptotes  To solve for the vertical asymptotes, we set the denominator equal to zero and solve for x 6
  • 12.
    3. Asymptotes  Asymptotesare lines that continually approach a curve but never reach it  On the ACT, we typically see vertical and horizontal asymptotes  To solve for the vertical asymptotes, we set the denominator equal to zero and solve for x  To solve for the horizontal asymptotes, we divide the leading terms  Think of this as solving for the value of y when x=∞ 6
  • 13.
  • 14.
    #2 7 Answer: C Calculator? Answer ChoiceApproach? Drawing? Hypothetical Numbers?
  • 15.
    III. Functions 8 A. Propertiesof Functions B. Linear Functions C. Quadratic Functions D. Trigonometric Functions E. Other Functions F. Sequences G. Functions Modeling
  • 16.
    Linear Functions 9 𝑓 𝑥= − 1 2 𝑥 + 1 2
  • 17.
    Linear Functions  LinearFunctions are those that result in a straight line when graphed 9 𝑓 𝑥 = − 1 2 𝑥 + 1 2
  • 18.
    Linear Functions  LinearFunctions are those that result in a straight line when graphed  Slope: 9 𝑓 𝑥 = − 1 2 𝑥 + 1 2
  • 19.
    Linear Functions  LinearFunctions are those that result in a straight line when graphed  Slope: 9 𝑓 𝑥 = − 1 2 𝑥 + 1 2 ∆𝑦 ∆𝑥 = 𝑦2 − 𝑦1 𝑥2 − 𝑥1
  • 20.
    Linear Functions  LinearFunctions are those that result in a straight line when graphed  Slope:  Perpendicular Line has a slope with  Opposite Sign  Reciprocal 9 𝑓 𝑥 = − 1 2 𝑥 + 1 2 ∆𝑦 ∆𝑥 = 𝑦2 − 𝑦1 𝑥2 − 𝑥1
  • 21.
  • 22.
    #3 10 Answer: B Calculator? Answer ChoiceApproach? Drawing? Hypothetical Numbers?
  • 23.
    III. Functions 11 A. Propertiesof Functions B. Linear Functions C. Quadratic Functions D. Trigonometric Functions E. Other Functions F. Sequences G. Functions Modeling
  • 24.
  • 25.
    Quadratic Functions  QuadraticFunctions are equations that form parabolas when graphed in the coordinate plane 12
  • 26.
    Quadratic Functions  QuadraticFunctions are equations that form parabolas when graphed in the coordinate plane  Often, quadratic function questions on the ACT involve the intersection of multiple functions (i.e. a line with a parabola or a circle with a parabola) 12
  • 27.
    Quadratic Functions  QuadraticFunctions are equations that form parabolas when graphed in the coordinate plane  Often, quadratic function questions on the ACT involve the intersection of multiple functions (i.e. a line with a parabola or a circle with a parabola)  Hint: it can be helpful to graph these functions by hand or on the calculator! 12
  • 28.
  • 29.
    #4 13 Answer: A Calculator? Answer ChoiceApproach? Drawing? Hypothetical Numbers?
  • 30.
    III. Functions 14 A. Propertiesof Functions B. Linear Functions C. Quadratic Functions D. Trigonometric Functions E. Other Functions F. Sequences G. Functions Modeling
  • 31.
    1. Measuring Anglesin Radians 15
  • 32.
    1. Measuring Anglesin Radians  Radians are used occasionally on the ACT  Radians are a second way of measuring angles  Radians : Degrees :: Inch : Centimeter 15
  • 33.
    1. Measuring Anglesin Radians  Radians are used occasionally on the ACT  Radians are a second way of measuring angles  Radians : Degrees :: Inch : Centimeter 15
  • 34.
    1. Measuring Anglesin Radians  Radians are used occasionally on the ACT  Radians are a second way of measuring angles  Radians : Degrees :: Inch : Centimeter  Conversion between angles in degrees and radians  Use the proportion below.  Fill in either the degree measure or radian measure you have been given.  Solve for the other using cross multiplication. 15
  • 35.
    1. Measuring Anglesin Radians  Radians are used occasionally on the ACT  Radians are a second way of measuring angles  Radians : Degrees :: Inch : Centimeter  Conversion between angles in degrees and radians  Use the proportion below.  Fill in either the degree measure or radian measure you have been given.  Solve for the other using cross multiplication. 15 45° in radians?
  • 36.
    2. Trig Functions:The Basics 16 𝑦 = 𝐴𝑓 𝐵 𝑥 + 𝐶 + 𝐷
  • 37.
    2. Trig Functions:The Basics 16 𝑦 = 𝐴𝑓 𝐵 𝑥 + 𝐶 + 𝐷 Trig. Function (sin, cos, tan)
  • 38.
    2. Trig Functions:The Basics 16 𝑦 = 𝐴𝑓 𝐵 𝑥 + 𝐶 + 𝐷 Trig. Function (sin, cos, tan) Amplitude
  • 39.
    2. Trig Functions:The Basics 16 𝑦 = 𝐴𝑓 𝐵 𝑥 + 𝐶 + 𝐷 Trig. Function (sin, cos, tan) Amplitude Period
  • 40.
    2. Trig Functions:The Basics 16 𝑦 = 𝐴𝑓 𝐵 𝑥 + 𝐶 + 𝐷 Trig. Function (sin, cos, tan) Amplitude Period Left/Right Shift
  • 41.
    2. Trig Functions:The Basics 16 𝑦 = 𝐴𝑓 𝐵 𝑥 + 𝐶 + 𝐷 Trig. Function (sin, cos, tan) Amplitude Period Left/Right Shift Up/Down Shift
  • 42.
    2. Trig Functions:The Basics 16 𝑦 = 𝐴𝑓 𝐵 𝑥 + 𝐶 + 𝐷 Trig. Function (sin, cos, tan) Amplitude Period Left/Right Shift Up/Down Shift 𝑦 = 3 sin 2 𝑥 + 𝜋 2 + 4
  • 43.
    3. Features ofTrigonometric Function Graphs Amplitude Period 17
  • 44.
    3. Features ofTrigonometric Function Graphs Amplitude  Amplitude represents the maximum distance away from the “midline” that a graph reaches  Formula: Period 17
  • 45.
    3. Features ofTrigonometric Function Graphs Amplitude  Amplitude represents the maximum distance away from the “midline” that a graph reaches  Formula: Period 17
  • 46.
    3. Features ofTrigonometric Function Graphs Amplitude  Amplitude represents the maximum distance away from the “midline” that a graph reaches  Formula:  Larger leading coefficients  larger amplitude  y = 3 sin(x)  A = 3  y = 1.1 cos(x)  A = 1.1 Period 17
  • 47.
    3. Features ofTrigonometric Function Graphs Amplitude  Amplitude represents the maximum distance away from the “midline” that a graph reaches  Formula:  Larger leading coefficients  larger amplitude  y = 3 sin(x)  A = 3  y = 1.1 cos(x)  A = 1.1 Period 17 A
  • 48.
    3. Features ofTrigonometric Function Graphs Amplitude  Amplitude represents the maximum distance away from the “midline” that a graph reaches  Formula:  Larger leading coefficients  larger amplitude  y = 3 sin(x)  A = 3  y = 1.1 cos(x)  A = 1.1 Period  Period represents the minimum amount of time (measured along the x-axis) that it takes for a graph to start repeating its shape  y = sin(4x) has a smaller period than y = sin(x) because the first equation repeats more often 17 A
  • 49.
    3. Features ofTrigonometric Function Graphs Amplitude  Amplitude represents the maximum distance away from the “midline” that a graph reaches  Formula:  Larger leading coefficients  larger amplitude  y = 3 sin(x)  A = 3  y = 1.1 cos(x)  A = 1.1 Period  Period represents the minimum amount of time (measured along the x-axis) that it takes for a graph to start repeating its shape  y = sin(4x) has a smaller period than y = sin(x) because the first equation repeats more often 17 A Represents one period
  • 50.
  • 51.
    #5 18 Answer: B Calculator? Answer ChoiceApproach? Drawing? Hypothetical Numbers?
  • 52.
    III. Functions 19 A. Propertiesof Functions B. Linear Functions C. Quadratic Functions D. Trigonometric Functions E. Other Functions F. Sequences G. Functions Modeling
  • 53.
    1a. Logarithm Functions Logarithms exist as the inverse (or opposite operation) of exponential functions  Equivalent Statements 20 Logarithmic Form Exponential Form
  • 54.
    1a. Logarithm Functions Logarithms exist as the inverse (or opposite operation) of exponential functions  Equivalent Statements To solve a logarithmic equation, it is often helpful to rewrite it in equivalent form. See the example below. Example Solve log2(8)=x. Rewrite in equivalent exponential form. 2x=8 2 raised to the power of 3 is 8. Therefore, x = 3. 20 Logarithmic Form Exponential Form
  • 55.
    1b. Basic Propertiesof Logarithms  Basic properties to use in simplification of logarithmic expressions 1. log(ab) = log(a) + log(b) 2. log(a/b) = log(a) – log(b) 3. log(ax) = x  log(a) 4. loga(ax) = x Examples of Each Property 1. log(3x) = log(3) + log(x) 2. log(x/4) = log(x) – log(4) 3. log(x3) = 3log(x) 4. log2(25) = 5 21
  • 56.
  • 57.
    #6 22 Answer: B Calculator? Answer ChoiceApproach? Drawing? Hypothetical Numbers?
  • 58.
    2. Exponential Growth/Decay 23 𝑦𝑡 = 𝑦0 1 ± 0.01𝑝 𝑡
  • 59.
    2. Exponential Growth/Decay 23 𝑦𝑡 = 𝑦0 1 ± 0.01𝑝 𝑡 Initial Amount
  • 60.
    2. Exponential Growth/Decay 23 𝑦𝑡 = 𝑦0 1 ± 0.01𝑝 𝑡 Initial Amount Percent Change
  • 61.
    2. Exponential Growth/Decay 23 𝑦𝑡 = 𝑦0 1 ± 0.01𝑝 𝑡 Initial Amount Percent Change Time
  • 62.
    2. Exponential Growth/Decay Often, we are given an initial ”amount” of something (i.e. population) 23 𝑦 𝑡 = 𝑦0 1 ± 0.01𝑝 𝑡 Initial Amount Percent Change Time
  • 63.
    2. Exponential Growth/Decay Often, we are given an initial ”amount” of something (i.e. population)  There could be a percent change increase or decrease over a period of time 23 𝑦 𝑡 = 𝑦0 1 ± 0.01𝑝 𝑡 Initial Amount Percent Change Time
  • 64.
    2. Exponential Growth/Decay Often, we are given an initial ”amount” of something (i.e. population)  There could be a percent change increase or decrease over a period of time  Remember that we might be asked to select the correct equation too! 23 𝑦 𝑡 = 𝑦0 1 ± 0.01𝑝 𝑡 Initial Amount Percent Change Time
  • 65.
  • 66.
    #7 24 Answer: D Calculator? Answer ChoiceApproach? Drawing? Hypothetical Numbers?
  • 67.
    3. Equation fora Circle The equation for a circle of radius “r” and center (h,k): (x – h)2 + (y – k)2 = r2 What you should be able to do:  From an equation…  State the radius  State the center  Find y-intercepts (set x=0 and solve)  Find x-intercepts (set y=0 and solve)  Recognize a graph  From a graph…  Find an equation 25
  • 68.
  • 69.
    #8 26 Answer: A Calculator? Answer ChoiceApproach? Drawing? Hypothetical Numbers?
  • 70.
    III. Functions 27 A. Propertiesof Functions B. Linear Functions C. Quadratic Functions D. Trigonometric Functions E. Other Functions F. Sequences G. Functions Modeling
  • 71.
  • 72.
    1. Arithmetic Sequences An Arithmetic Sequence is one in which the difference between consecutive terms is constant 28
  • 73.
    1. Arithmetic Sequences An Arithmetic Sequence is one in which the difference between consecutive terms is constant  When we are asked about an arithmetic sequence, we should know to add or subtract by the same number between terms 28
  • 74.
    1. Arithmetic Sequences An Arithmetic Sequence is one in which the difference between consecutive terms is constant  When we are asked about an arithmetic sequence, we should know to add or subtract by the same number between terms  When sequences involve a small number of terms, we can often write them out! 28
  • 75.
  • 76.
    2. Geometric Sequences A Geometric Sequence is one in which numbers in the sequence differ by a factor 29
  • 77.
    2. Geometric Sequences A Geometric Sequence is one in which numbers in the sequence differ by a factor  When we are asked about a geometric sequence, we should know to multiply or divide between terms 29
  • 78.
    2. Geometric Sequences A Geometric Sequence is one in which numbers in the sequence differ by a factor  When we are asked about a geometric sequence, we should know to multiply or divide between terms  Sometimes, we apply skills from sequences to discover patterns for other problem types as well 29
  • 79.
  • 80.
    #9 30 Answer: A Calculator? Answer ChoiceApproach? Drawing? Hypothetical Numbers?
  • 81.
    III. Functions 31 A. Propertiesof Functions B. Linear Functions C. Quadratic Functions D. Trigonometric Functions E. Other Functions F. Sequences G. Functions Modeling
  • 82.
  • 83.
    #10 32 Answer: A Calculator? Answer ChoiceApproach? Drawing? Hypothetical Numbers?

Editor's Notes

  • #2 Teacher Notes The Functions section focuses on many different types of functions, ranging from simple linear functions to much more complex trigonometric and logarithmic functions. **We recommend that students take notes in the form of an outline, beginning with Roman numeral three (III) for Algebra and on the next slide, letter A**
  • #4 Teacher Notes The definition presented in the first bullet point can be related directly to the Vertical Line Test, which is a test that can be applied to test whether or not a graph represents a function. The Vertical Line Test says that if a vertical line can be drawn anywhere on a graph such that it touches the graph twice, then the graph does not represent a function. The reason for the existence of this Test is that no single x-value (input) can produce more than one y-value (output).
  • #7 Teacher Notes Domain and range can be remembered by noting that “d” and “x” occur alphabetically before “r” and “y.”
  • #8 Teacher Notes Domain and range can be remembered by noting that “d” and “x” occur alphabetically before “r” and “y.”
  • #9 Teacher Notes The horizontal asymptote calculation can be somewhat challenging. For a more full explanation, see this website: http://www.coolmath.com/precalculus-review-calculus-intro/precalculus-algebra/18-rational-functions-finding-horizontal-slant-asymptotes-01
  • #10 Teacher Notes The horizontal asymptote calculation can be somewhat challenging. For a more full explanation, see this website: http://www.coolmath.com/precalculus-review-calculus-intro/precalculus-algebra/18-rational-functions-finding-horizontal-slant-asymptotes-01
  • #11 Teacher Notes The horizontal asymptote calculation can be somewhat challenging. For a more full explanation, see this website: http://www.coolmath.com/precalculus-review-calculus-intro/precalculus-algebra/18-rational-functions-finding-horizontal-slant-asymptotes-01
  • #12 Teacher Notes The horizontal asymptote calculation can be somewhat challenging. For a more full explanation, see this website: http://www.coolmath.com/precalculus-review-calculus-intro/precalculus-algebra/18-rational-functions-finding-horizontal-slant-asymptotes-01
  • #13 Teacher Notes The horizontal asymptote calculation can be somewhat challenging. For a more full explanation, see this website: http://www.coolmath.com/precalculus-review-calculus-intro/precalculus-algebra/18-rational-functions-finding-horizontal-slant-asymptotes-01
  • #17 Teacher Notes This slide should be a reiteration of material from the “Algebra” section, so this is a good opportunity to engage students in reviewing their knowledge of this topic.
  • #18 Teacher Notes This slide should be a reiteration of material from the “Algebra” section, so this is a good opportunity to engage students in reviewing their knowledge of this topic.
  • #19 Teacher Notes This slide should be a reiteration of material from the “Algebra” section, so this is a good opportunity to engage students in reviewing their knowledge of this topic.
  • #20 Teacher Notes This slide should be a reiteration of material from the “Algebra” section, so this is a good opportunity to engage students in reviewing their knowledge of this topic.
  • #21 Teacher Notes This slide should be a reiteration of material from the “Algebra” section, so this is a good opportunity to engage students in reviewing their knowledge of this topic.
  • #25 Teacher Notes This slide should be a reiteration of material from the “Algebra” section, so this is a good opportunity to engage students in reviewing their knowledge of this topic. After reading the second bullet point, you may consider asking students how ANY equation can be solved without using algebraic methods. Students should recall that they can separately graph both sides of the equation and examine the x-values of the intersections.
  • #26 Teacher Notes This slide should be a reiteration of material from the “Algebra” section, so this is a good opportunity to engage students in reviewing their knowledge of this topic. After reading the second bullet point, you may consider asking students how ANY equation can be solved without using algebraic methods. Students should recall that they can separately graph both sides of the equation and examine the x-values of the intersections.
  • #27 Teacher Notes This slide should be a reiteration of material from the “Algebra” section, so this is a good opportunity to engage students in reviewing their knowledge of this topic. After reading the second bullet point, you may consider asking students how ANY equation can be solved without using algebraic methods. Students should recall that they can separately graph both sides of the equation and examine the x-values of the intersections.
  • #28 Teacher Notes This slide should be a reiteration of material from the “Algebra” section, so this is a good opportunity to engage students in reviewing their knowledge of this topic. After reading the second bullet point, you may consider asking students how ANY equation can be solved without using algebraic methods. Students should recall that they can separately graph both sides of the equation and examine the x-values of the intersections.
  • #31 Teacher
  • #32 Teacher Notes For the example on this slide, use the proportion: x = 𝞹 45 180 180x = 45𝞹 x = 𝞹/4
  • #33 Teacher Notes For the example on this slide, use the proportion: x = 𝞹 45 180 180x = 45𝞹 x = 𝞹/4
  • #34 Teacher Notes For the example on this slide, use the proportion: x = 𝞹 45 180 180x = 45𝞹 x = 𝞹/4
  • #35 Teacher Notes For the example on this slide, use the proportion: x = 𝞹 45 180 180x = 45𝞹 x = 𝞹/4
  • #36 Teacher Notes For the example on this slide, use the proportion: x = 𝞹 45 180 180x = 45𝞹 x = 𝞹/4
  • #37 Teacher Notes This material will be unfamiliar to students who have not finished Algebra II. Even students who have finished this course may not have a complete grasp of this material; it tends to be covered more deeply in Pre-Calculus and other post-Algebra II classes. Transformations affect the parent graphs in the following way: A… A < 0: vertical reflection, |A| > 1: vertical stretch, |A| < 1: vertical shrink B… Determines the period of the function: period = 2𝞹/B C… Determines the horizontal shift of the function: C > 0: shift left, C < 0: shift right D… Determines the vertical shift of the function: D > 0: shift up, D < 0: shift down 3. The example function at the bottom would have the following transformations from y=sin(x). Vertical stretch by a factor of three Period of 𝞹 Horizontal shift left by 𝞹/2 Vertical shift up 4 units
  • #38 Teacher Notes This material will be unfamiliar to students who have not finished Algebra II. Even students who have finished this course may not have a complete grasp of this material; it tends to be covered more deeply in Pre-Calculus and other post-Algebra II classes. Transformations affect the parent graphs in the following way: A… A < 0: vertical reflection, |A| > 1: vertical stretch, |A| < 1: vertical shrink B… Determines the period of the function: period = 2𝞹/B C… Determines the horizontal shift of the function: C > 0: shift left, C < 0: shift right D… Determines the vertical shift of the function: D > 0: shift up, D < 0: shift down 3. The example function at the bottom would have the following transformations from y=sin(x). Vertical stretch by a factor of three Period of 𝞹 Horizontal shift left by 𝞹/2 Vertical shift up 4 units
  • #39 Teacher Notes This material will be unfamiliar to students who have not finished Algebra II. Even students who have finished this course may not have a complete grasp of this material; it tends to be covered more deeply in Pre-Calculus and other post-Algebra II classes. Transformations affect the parent graphs in the following way: A… A < 0: vertical reflection, |A| > 1: vertical stretch, |A| < 1: vertical shrink B… Determines the period of the function: period = 2𝞹/B C… Determines the horizontal shift of the function: C > 0: shift left, C < 0: shift right D… Determines the vertical shift of the function: D > 0: shift up, D < 0: shift down 3. The example function at the bottom would have the following transformations from y=sin(x). Vertical stretch by a factor of three Period of 𝞹 Horizontal shift left by 𝞹/2 Vertical shift up 4 units
  • #40 Teacher Notes This material will be unfamiliar to students who have not finished Algebra II. Even students who have finished this course may not have a complete grasp of this material; it tends to be covered more deeply in Pre-Calculus and other post-Algebra II classes. Transformations affect the parent graphs in the following way: A… A < 0: vertical reflection, |A| > 1: vertical stretch, |A| < 1: vertical shrink B… Determines the period of the function: period = 2𝞹/B C… Determines the horizontal shift of the function: C > 0: shift left, C < 0: shift right D… Determines the vertical shift of the function: D > 0: shift up, D < 0: shift down 3. The example function at the bottom would have the following transformations from y=sin(x). Vertical stretch by a factor of three Period of 𝞹 Horizontal shift left by 𝞹/2 Vertical shift up 4 units
  • #41 Teacher Notes This material will be unfamiliar to students who have not finished Algebra II. Even students who have finished this course may not have a complete grasp of this material; it tends to be covered more deeply in Pre-Calculus and other post-Algebra II classes. Transformations affect the parent graphs in the following way: A… A < 0: vertical reflection, |A| > 1: vertical stretch, |A| < 1: vertical shrink B… Determines the period of the function: period = 2𝞹/B C… Determines the horizontal shift of the function: C > 0: shift left, C < 0: shift right D… Determines the vertical shift of the function: D > 0: shift up, D < 0: shift down 3. The example function at the bottom would have the following transformations from y=sin(x). Vertical stretch by a factor of three Period of 𝞹 Horizontal shift left by 𝞹/2 Vertical shift up 4 units
  • #42 Teacher Notes This material will be unfamiliar to students who have not finished Algebra II. Even students who have finished this course may not have a complete grasp of this material; it tends to be covered more deeply in Pre-Calculus and other post-Algebra II classes. Transformations affect the parent graphs in the following way: A… A < 0: vertical reflection, |A| > 1: vertical stretch, |A| < 1: vertical shrink B… Determines the period of the function: period = 2𝞹/B C… Determines the horizontal shift of the function: C > 0: shift left, C < 0: shift right D… Determines the vertical shift of the function: D > 0: shift up, D < 0: shift down 3. The example function at the bottom would have the following transformations from y=sin(x). Vertical stretch by a factor of three Period of 𝞹 Horizontal shift left by 𝞹/2 Vertical shift up 4 units
  • #43 Teacher Notes This material will be unfamiliar to students who have not finished Algebra II. Even students who have finished this course may not have a complete grasp of this material; it tends to be covered more deeply in Pre-Calculus and other post-Algebra II classes. Transformations affect the parent graphs in the following way: A… A < 0: vertical reflection, |A| > 1: vertical stretch, |A| < 1: vertical shrink B… Determines the period of the function: period = 2𝞹/B C… Determines the horizontal shift of the function: C > 0: shift left, C < 0: shift right D… Determines the vertical shift of the function: D > 0: shift up, D < 0: shift down 3. The example function at the bottom would have the following transformations from y=sin(x). Vertical stretch by a factor of three Period of 𝞹 Horizontal shift left by 𝞹/2 Vertical shift up 4 units
  • #44 Teacher Notes Amplitude and period are closely tied to the transformations shown on the slide before. Amplitude is defined as |A|, and the period is defined as 2𝞹/B. It is also valuable to be able to visualize these two characteristics, which is what this slide attempts to do. The concept of a “periodic” function can be applied to non-trigonometric functions as well. Basically any graph that has a repetitive pattern can be described as periodic; the period is the simply the number of units along the x-axis that it takes for the graph to start repeating itself.
  • #45 Teacher Notes Amplitude and period are closely tied to the transformations shown on the slide before. Amplitude is defined as |A|, and the period is defined as 2𝞹/B. It is also valuable to be able to visualize these two characteristics, which is what this slide attempts to do. The concept of a “periodic” function can be applied to non-trigonometric functions as well. Basically any graph that has a repetitive pattern can be described as periodic; the period is the simply the number of units along the x-axis that it takes for the graph to start repeating itself.
  • #46 Teacher Notes Amplitude and period are closely tied to the transformations shown on the slide before. Amplitude is defined as |A|, and the period is defined as 2𝞹/B. It is also valuable to be able to visualize these two characteristics, which is what this slide attempts to do. The concept of a “periodic” function can be applied to non-trigonometric functions as well. Basically any graph that has a repetitive pattern can be described as periodic; the period is the simply the number of units along the x-axis that it takes for the graph to start repeating itself.
  • #47 Teacher Notes Amplitude and period are closely tied to the transformations shown on the slide before. Amplitude is defined as |A|, and the period is defined as 2𝞹/B. It is also valuable to be able to visualize these two characteristics, which is what this slide attempts to do. The concept of a “periodic” function can be applied to non-trigonometric functions as well. Basically any graph that has a repetitive pattern can be described as periodic; the period is the simply the number of units along the x-axis that it takes for the graph to start repeating itself.
  • #48 Teacher Notes Amplitude and period are closely tied to the transformations shown on the slide before. Amplitude is defined as |A|, and the period is defined as 2𝞹/B. It is also valuable to be able to visualize these two characteristics, which is what this slide attempts to do. The concept of a “periodic” function can be applied to non-trigonometric functions as well. Basically any graph that has a repetitive pattern can be described as periodic; the period is the simply the number of units along the x-axis that it takes for the graph to start repeating itself.
  • #49 Teacher Notes Amplitude and period are closely tied to the transformations shown on the slide before. Amplitude is defined as |A|, and the period is defined as 2𝞹/B. It is also valuable to be able to visualize these two characteristics, which is what this slide attempts to do. The concept of a “periodic” function can be applied to non-trigonometric functions as well. Basically any graph that has a repetitive pattern can be described as periodic; the period is the simply the number of units along the x-axis that it takes for the graph to start repeating itself.
  • #50 Teacher Notes Amplitude and period are closely tied to the transformations shown on the slide before. Amplitude is defined as |A|, and the period is defined as 2𝞹/B. It is also valuable to be able to visualize these two characteristics, which is what this slide attempts to do. The concept of a “periodic” function can be applied to non-trigonometric functions as well. Basically any graph that has a repetitive pattern can be described as periodic; the period is the simply the number of units along the x-axis that it takes for the graph to start repeating itself.
  • #53 Teacher Notes This section will cover logarithmic functions, exponential functions, and equations of circles. This content is likely to appear on the ACT, but students who are unfamiliar with the content (especially with logarithmic functions) probably will not be well-served to spend an excessive amount of time studying this part. The question types related to circles are relatively consistent, so it may behoove students to briefly review this material.
  • #54 Teacher Notes Saying “equivalent statements” means that both equations have the exact same message and mathematical truth. In other words, the same relationship can be expressed in two formats.
  • #55 Teacher Notes Saying “equivalent statements” means that both equations have the exact same message and mathematical truth. In other words, the same relationship can be expressed in two formats.
  • #59 Teacher Notes Choose “+” when an increase occurs and “-” when a decrease occurs.
  • #60 Teacher Notes Choose “+” when an increase occurs and “-” when a decrease occurs.
  • #61 Teacher Notes Choose “+” when an increase occurs and “-” when a decrease occurs.
  • #62 Teacher Notes Choose “+” when an increase occurs and “-” when a decrease occurs.
  • #63 Teacher Notes Choose “+” when an increase occurs and “-” when a decrease occurs.
  • #64 Teacher Notes Choose “+” when an increase occurs and “-” when a decrease occurs.
  • #65 Teacher Notes Choose “+” when an increase occurs and “-” when a decrease occurs.
  • #68 Teacher Notes The ACT expects students to have this equation memorized. The radius is r. Frequently, the ACT will give an equation like this: (x-3)2 + (y+1)2 = 4. The radius of this equation is 2, not 4! Remember, the right-hand side represents r2, but the radius is just r. The center is the point (h,k). For the equation from the previous note, the center would be (3, -1). Note that signs must be switched.
  • #72 Teacher Notes These sequences can be modeled using linear functions, but frequently, simple problems involving these sequences can be solved without the use of a formula. Students may recognize this formula as the explicit formula for arithmetic sequences: an = a1 + d(n-1) where an represents the nth term, a1 represents the first term in the sequence, and d represents the common difference.
  • #73 Teacher Notes These sequences can be modeled using linear functions, but frequently, simple problems involving these sequences can be solved without the use of a formula. Students may recognize this formula as the explicit formula for arithmetic sequences: an = a1 + d(n-1) where an represents the nth term, a1 represents the first term in the sequence, and d represents the common difference.
  • #74 Teacher Notes These sequences can be modeled using linear functions, but frequently, simple problems involving these sequences can be solved without the use of a formula. Students may recognize this formula as the explicit formula for arithmetic sequences: an = a1 + d(n-1) where an represents the nth term, a1 represents the first term in the sequence, and d represents the common difference.
  • #75 Teacher Notes These sequences can be modeled using linear functions, but frequently, simple problems involving these sequences can be solved without the use of a formula. Students may recognize this formula as the explicit formula for arithmetic sequences: an = a1 + d(n-1) where an represents the nth term, a1 represents the first term in the sequence, and d represents the common difference.
  • #76 Teacher Notes These sequences can be modeled using exponential functions, but frequently, simple problems involving these sequences can be solved without the use of a formula. Students may recognize this formula as the explicit formula for geometric sequences: an = a1(r)n-1 where an represents the nth term, a1 represents the first term in the sequence, and r represents the common ratio.
  • #77 Teacher Notes These sequences can be modeled using exponential functions, but frequently, simple problems involving these sequences can be solved without the use of a formula. Students may recognize this formula as the explicit formula for geometric sequences: an = a1(r)n-1 where an represents the nth term, a1 represents the first term in the sequence, and r represents the common ratio.
  • #78 Teacher Notes These sequences can be modeled using exponential functions, but frequently, simple problems involving these sequences can be solved without the use of a formula. Students may recognize this formula as the explicit formula for geometric sequences: an = a1(r)n-1 where an represents the nth term, a1 represents the first term in the sequence, and r represents the common ratio.
  • #79 Teacher Notes These sequences can be modeled using exponential functions, but frequently, simple problems involving these sequences can be solved without the use of a formula. Students may recognize this formula as the explicit formula for geometric sequences: an = a1(r)n-1 where an represents the nth term, a1 represents the first term in the sequence, and r represents the common ratio.