Downloaded 124 times

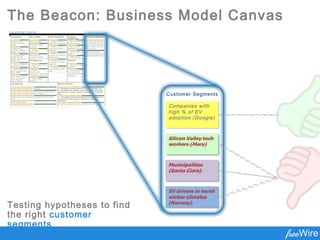
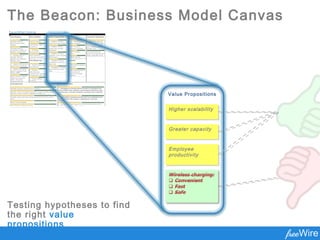
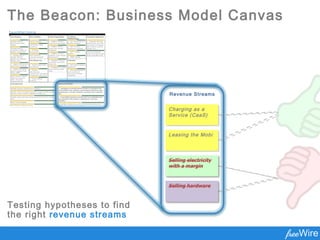
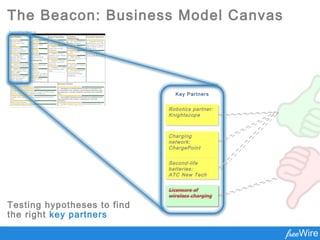

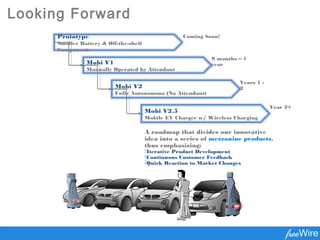
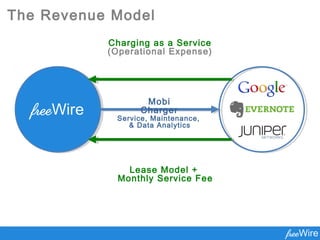
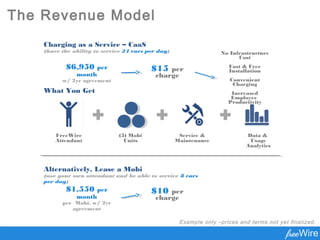


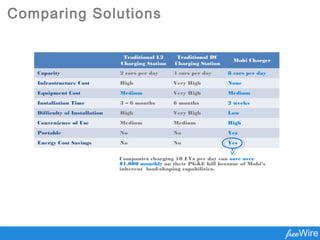
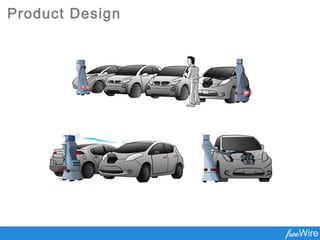
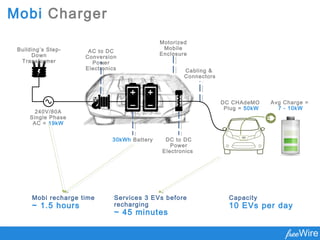
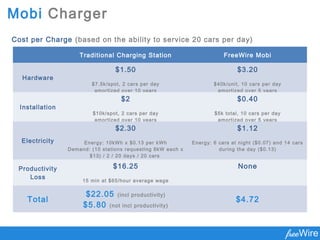
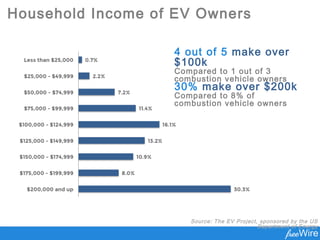


The document outlines a business plan for a startup developing a wireless EV charging solution called Mobi. The company conducted extensive customer research including over 100 interviews and traveled over 6,600 miles. Their solution aims to make EV charging more convenient and scalable by using autonomous robotic chargers that can move to vehicles. The business model canvas details potential partners, activities, value propositions, customer relationships, segments, resources, channels, cost structure, and revenue streams as the company tests various hypotheses to refine their model.