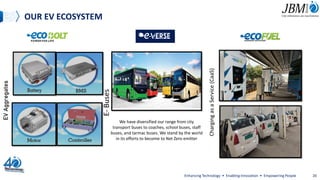
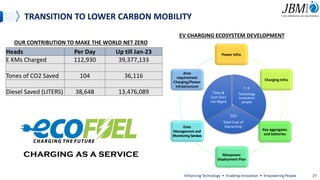
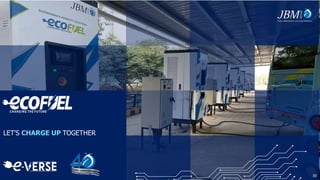
Public transportation electrification and e-cab fleet operations powered by charging infrastructure.
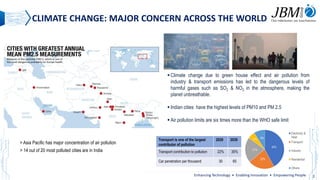
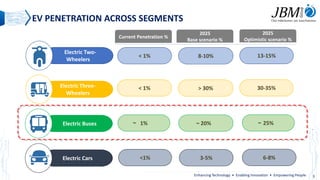
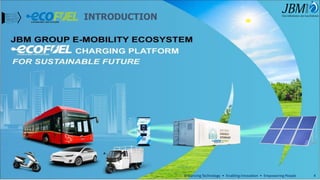
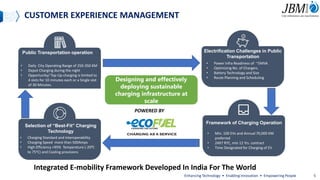
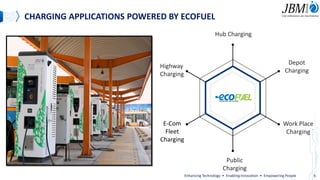
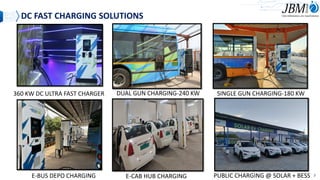
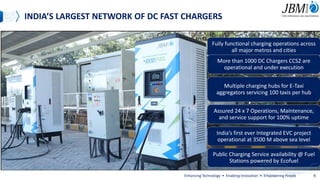
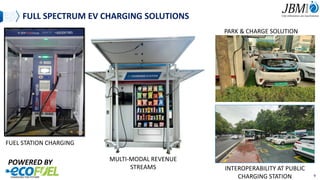
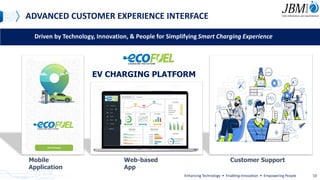
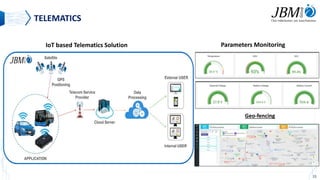
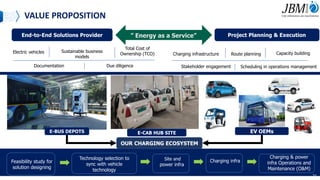
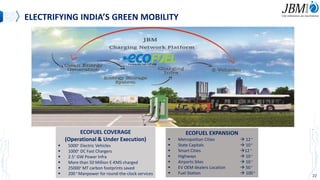
Key points addressed include rising air pollution levels in many cities including India, transportation being a major contributor, and the need to transition to electric vehicles. Targets for electric vehicle penetration by 2025 are provided for different vehicle segments. Challenges of electric bus and public transportation charging are discussed. JBM's electric vehicle charging solutions and ecosystem are described including DC fast chargers, charging hubs, applications, customer experience platforms, and telematics. The document promotes electrification of mobility to reduce emissions.