This document outlines a machine learning project focused on detecting fraudulent credit card transactions. It details the dataset, exploratory data analysis, data cleaning and preprocessing, feature engineering, and the evaluation of several models, ultimately identifying random forest as the best-performing model due to its accuracy and effectiveness in handling imbalanced data. The project aims to enhance fraud detection systems in banking and financial sectors to safeguard user transactions and maintain trust.


![CONFIDENTIAL: The information in this document belongs to Boston Institute of Analytics LLC. Any unauthorized sharing of this
material is prohibited and subject to legal action under breach of IP and confidentiality clauses.
Exploratory Data
Analysis
EDA of the “type” Feature
df['type'].unique() –
Displays all unique transation types in the type
column.
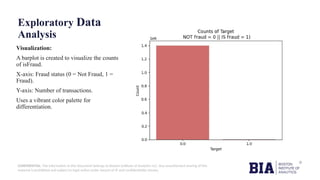
Visualization:
A countplot is created to show the number of
transactions for each type.
•X-axis: Transaction types (CASH_OUT,
PAYMENT, TRANSFER etc.).
•Y-axis: Number of transactions.
•The grid makes the visualization more readable.
•Helps identify which transaction types dominate
the dataset.](https://image.slidesharecdn.com/frauddetectioncapstoneproject-241204135330-da56ac53/85/Fraud-Detection-Harnessing-Data-Science-for-Securing-Transactions-8-320.jpg)
![CONFIDENTIAL: The information in this document belongs to Boston Institute of Analytics LLC. Any unauthorized sharing of this
material is prohibited and subject to legal action under breach of IP and confidentiality clauses.
Exploratory Data
Analysis
• EDA of the "isFraud" Feature
df['isFraud'].unique().astype(int)
Lists the unique values in the isFraud column
(0: Not Fraud, 1: Fraud).
• Dropping unnecessary columns
df.drop(['nameOrig', 'nameDest'], axis=1, inplace=True)
Removes columns nameOrig and nameDest.
These are identifiers and do not contribute to fraud prediction.
Dropping these reduces dimensionality and computational
overhead
• Label Encoding for "type" Feature
df['type'].replace({'CASH_OUT': 0,
'PAYMENT': 1, 'CASH_IN': 2,
'TRANSFER': 3, 'DEBIT': 4},
inplace=True)
df['type'].value_counts()
Converts the categorical values in type into
numerical labels (0–4).
Necessary for feeding data into ML models
that require numerical inputs.
type column now contains integers instead of
strings, simplifying computation](https://image.slidesharecdn.com/frauddetectioncapstoneproject-241204135330-da56ac53/85/Fraud-Detection-Harnessing-Data-Science-for-Securing-Transactions-9-320.jpg)


![PYTHON PROJECT[1] Online Fraud Fraud Detection Cybersecurity Anomaly Detec...](https://cdn.slidesharecdn.com/ss_thumbnails/pythonproject1-250421141954-bd5cebfc-thumbnail.jpg?width=640&height=640&fit=bounds)