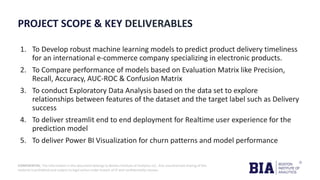
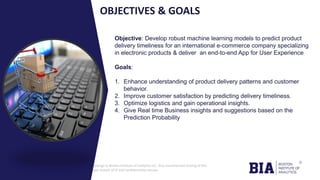
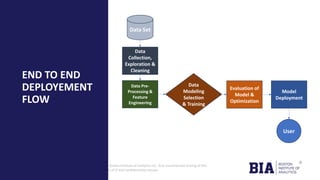
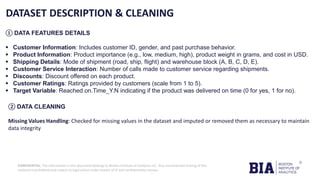
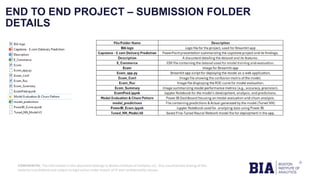
CONFIDENTIAL: The information in this document belongs to Boston Institute of Analytics LLC. Any unauthorized sharing of this
material is prohibited and subject to legal action under breach of IP and confidentiality clauses.
E-commerce Product Delivery Prediction
UMAR IBRAHIM
BIA DHA PHASE 5, LAHORE, PAKISTAN
BATCH 1
CONFIDENTIAL: The information in this document belongs to Boston Institute of Analytics LLC. Any unauthorized sharing of this
material is prohibited and subject to legal action under breach of IP and confidentiality clauses.
PROJECT SCOPE & KEY DELIVERABLES
1. To Develop robust machine learning models to predict product delivery timeliness
for an international e-commerce company specializing in electronic products.
2. To Compare performance of models based on Evaluation Matrix like Precision,
Recall, Accuracy, AUC-ROC & Confusion Matrix
3. To conduct Exploratory Data Analysis based on the data set to explore
relationships between features of the dataset and the target label such as Delivery
success
4. To deliver streamlit end to end deployment for Realtime user experience for the
prediction model
5. To deliver Power BI Visualization for churn patterns and model performance
CONFIDENTIAL: The information in this document belongs to Boston Institute of Analytics LLC. Any unauthorized sharing of this
material is prohibited and subject to legal action under breach of IP and confidentiality clauses.
Click to edit
Master title
style
OBJECTIVES & GOALS
Objective: Develop robust machine learning models to predict product
delivery timeliness for an international e-commerce company specializing
in electronic products & deliver an end-to-end App for User Experience
Goals:
1. Enhance understanding of product delivery patterns and customer
behavior.
2. Improve customer satisfaction by predicting delivery timeliness.
3. Optimize logistics and gain operational insights.
4. Give Real time Business insights and suggestions based on the
Prediction Probability
CONFIDENTIAL: The information in this document belongs to Boston Institute of Analytics LLC. Any unauthorized sharing of this
material is prohibited and subject to legal action under breach of IP and confidentiality clauses.
END TO END
DEPLOYEMENT
FLOW
Data
Collection,
Exploration &
Cleaning
Data Pre-
Processing &
Feature
Engineering
Data
Modeling
Selection
& Training
Evaluation of
Model &
Optimization
Model
Deployment
User
Data Set
CONFIDENTIAL: The information in this document belongs to Boston Institute of Analytics LLC. Any unauthorized sharing of this
material is prohibited and subject to legal action under breach of IP and confidentiality clauses.
DATASET DESCRIPTION & CLEANING
① DATA FEATURES DETAILS
▪ Customer Information: Includes customer ID, gender, and past purchase behavior.
▪ Product Information: Product importance (e.g., low, medium, high), product weight in grams, and cost in USD.
▪ Shipping Details: Mode of shipment (road, ship, flight) and warehouse block (A, B, C, D, E).
▪ Customer Service Interaction: Number of calls made to customer service regarding shipments.
▪ Discounts: Discount offered on each product.
▪ Customer Ratings: Ratings provided by customers (scale from 1 to 5).
▪ Target Variable: Reached.on.Time_Y.N indicating if the product was delivered on time (0 for yes, 1 for no).
② DATA CLEANING
Missing Values Handling: Checked for missing values in the dataset and imputed or removed them as necessary to maintain
data integrity
CONFIDENTIAL: The information in this document belongs to Boston Institute of Analytics LLC. Any unauthorized sharing of this
material is prohibited and subject to legal action under breach of IP and confidentiality clauses.
DATA EXPLORATORY ANALYSIS
CRITICAL OBSERVATIONS:
1. Products have a uniform price distribution, peaking around
higher-cost items (~300 USD).
2. Most products receive minimal discounts, indicating a
strategy that relies on product value.
3. Block 'F' is most used, handling double the products
compared to other blocks.
4. Majority (75%) of shipments are via "Ship", highlighting
cost efficiency but potential delay risks.
5. Over 50% of products are low importance, suggesting
delivery speed may not be a top priority.
6. Male and female customers are equally represented,
showing a diverse customer base.
7. Highest delayed deliveries occur in Block 'F', indicating
possible logistics or capacity issues.
8. "Ship" mode has the most delays, likely due to longer
transit times compared to other methods.
9. Higher median customer care calls are linked to delayed
deliveries, signaling dissatisfaction.
10. Heavier products have a higher likelihood of delays,
possibly due to handling challenges.
Note : Detailed EDA in the code
CONFIDENTIAL: The information in this document belongs to Boston Institute of Analytics LLC. Any unauthorized sharing of this
material is prohibited and subject to legal action under breach of IP and confidentiality clauses.
DATASET PRE PROCESSING & FEATURE ENGINEERING
① DATA ENCODING
Coded categorical features such as Gender, Warehouse_block, Mode_of_Shipment, and Product_importance using
label encoding or one-hot encoding for compatibility with machine learning models.
② DATA NORMALIZATION
Applied scaling techniques (e.g., StandardScaler) to numerical features like Cost_of_the_Product and
Weight_in_gms to ensure models train effectively.
CONFIDENTIAL: The information in this document belongs to Boston Institute of Analytics LLC. Any unauthorized sharing of this
material is prohibited and subject to legal action under breach of IP and confidentiality clauses.
MODEL SELECTION AND
TRAINING
Model Selection Process:
• Evaluated several classification algorithms to
predict delivery timeliness. The models
include:
• Logistic Regression
• Decision Tree
• Random Forest (Optimized)
• Gradient Boosting (Optimized)
• K-Nearest Neighbors (KNN)
• Support Vector Machine (SVM)
• Deep Learning Models: Default Neural Network
and Fine-Tuned Neural Network.
• The selection of models is based on their
ability to handle structured data and their
suitability for classification tasks.
• Test_Train split used to train and evaluate the
performance matrics
CONFIDENTIAL: The information in this document belongs to Boston Institute of Analytics LLC. Any unauthorized sharing of this
material is prohibited and subject to legal action under breach of IP and confidentiality clauses.
TRAINING SETUP
1. Split the dataset into training and testing sets (e.g., 80/20 split) to
validate the model’s performance on unseen data.
2. Used metrics like loss and accuracy to monitor training progress and
adjusted hyperparameters as needed.
3. Incorporated early stopping techniques for neural networks to
prevent overfitting.
CONFIDENTIAL: The information in this document belongs to Boston Institute of Analytics LLC. Any unauthorized sharing of this
material is prohibited and subject to legal action under breach of IP and confidentiality clauses.
EVALUATION OF MODEL
I. Accuracy: Proportion of correct predictions made by the model overall.
II. Precision: Measures correctness of positive predictions (true positives / total positives predicted).
III. Recall: Indicates model's ability to identify actual positive cases (true positives / total actual positives).
IV. F1 Score: Harmonic mean of precision and recall, useful for imbalanced classes.
V. ROC-AUC Score: Area under ROC curve, measures model's ability to distinguish classes.
VI. Confusion Matrix: Visualizes true/false positives and negatives for model error analysis.
VII. ROC Curves: Plots trade-off between true positive and false positive rates for comparison.
VIII.Performance Comparison: Summary table showing metrics for all models side-by-side.
IX. Model Insights: Highlights best models, e.g., Random Forest, Gradient Boosting, Neural Networks.
X. Overfitting : Monitors generalization using early stopping.
CONFIDENTIAL: The information in this document belongs to Boston Institute of Analytics LLC. Any unauthorized sharing of this
material is prohibited and subject to legal action under breach of IP and confidentiality clauses.
EVALUATION OF MODEL
Note : Model by Model AOC & Confusion Matrix available in the code
CONFIDENTIAL: The information in this document belongs to Boston Institute of Analytics LLC. Any unauthorized sharing of this
material is prohibited and subject to legal action under breach of IP and confidentiality clauses.
MODEL FINE TUNING &
OPTIMIZATION
❶ Hyperparameter Tuning: Used GridSearchCV to find the optimal
parameters for Random Forest and Gradient Boosting models.
❷ Parameter Selection: Tuned parameters like n_estimators,
max_depth, min_samples_split, and learning_rate
❸ Random Forest Optimization: Adjusted the number of trees and
depth to maximize accuracy and minimize overfitting.
❹ Gradient Boosting Optimization: Tuned the learning rate and the
number of boosting stages for optimal convergence.
❺ Neural Network Fine-Tuning: Adjusted architecture: added layers,
dropout rates, epochs, and batch sizes for improved performance.
❻ Early Stopping: Implemented early stopping for neural networks to
halt training when validation loss stopped improving.
❼ Validation Metrics: Monitored accuracy, loss, and AUC during
tuning to select the best model configurations.
❽ Regularization Techniques: Applied dropout in neural networks and
adjusted min_samples_split in trees to prevent overfitting.
CONFIDENTIAL: The information in this document belongs to Boston Institute of Analytics LLC. Any unauthorized sharing of this
material is prohibited and subject to legal action under breach of IP and confidentiality clauses.
FINAL MODEL SELECTION OBSERVATIONS
1. Random Forest achieves the highest AUC (0.75), balancing precision and recall well for classification.
2. Gradient Boosting has a high precision (0.86) but slightly lower recall, focusing on correct positive identifications.
3. Decision Tree shows the lowest AUC (0.64), indicating weaker performance in distinguishing between classes.
4. KNN has moderate AUC (0.73) with balanced precision and recall but lower overall accuracy.
5. Logistic Regression's AUC (0.72) is decent but lags behind more complex models in accuracy.
6. Random Forest and Gradient Boosting have the most accurate confusion matrix distributions, with fewer
misclassifications.
7. All models perform better than random guessing; ROC curves confirm this, but advanced models perform slightly better.
8. Precision is prioritized over recall in Random Forest and Gradient Boosting, resulting in fewer false positives.
9. The Fine-Tuned Neural Network shows high precision (0.902) but sacrifices recall, focusing on minimizing false
positives.
10. The Fine-Tuned Neural Network balances accuracy and F1 score effectively, making it a robust choice for deployment.
CONFIDENTIAL: The information in this document belongs to Boston Institute of Analytics LLC. Any unauthorized sharing of this
material is prohibited and subject to legal action under breach of IP and confidentiality clauses.
FINAL MODEL SELECTION
Fine-Tuned Neural Network
1.Best Model:
Fine-Tuned Neural Network selected for its high
performance and adaptability after optimization.
2.Architecture Adjustments:
Enhanced with additional layers, dropout rates, and
optimized hyperparameters (epochs, batch size) for
stability.
3.Performance Metrics:
Achieved high accuracy, precision, and ROC-AUC,
indicating strong predictive capabilities.
4.Generalization:
Early stopping ensured the model generalizes well to
unseen data.
5.Advantages:
Capable of learning complex relationships within the
data, surpassing other models in performance.
6.Optimization Techniques:
Fine-tuned learning rate, batch size, and dropout to
prevent overfitting and maximize model efficiency.
7.Deployment Readiness:
Model validated with multiple metrics and ready for
deployment in the logistics system.
8.Scalability:
Neural network architecture allows for easy
expansion and integration with additional data
sources.
9.Summary:
The Fine-Tuned Neural Network is the most effective
model, offering flexibility and high accuracy for
predicting delivery performance.
CONFIDENTIAL: The information in this document belongs to Boston Institute of Analytics LLC. Any unauthorized sharing of this
material is prohibited and subject to legal action under breach of IP and confidentiality clauses.
Click to edit
Master title style
MODEL DEPLOYMENT
STREAMLIT LIB FOR MODEL DEPLOYMENT
1.Data Loading & Encoding:
Loads the e-commerce dataset and encodes categorical features like Warehouse_block,
Mode_of_Shipment, and Gender using LabelEncoder.
2.Model Loading:
Loads a pre-trained Fine-Tuned Neural Network model (Tuned_NN_Model.h5) for making
predictions.
3.EDA (Exploratory Data Analysis):
•Visualizes feature distributions, correlation matrix, bar plots, and box plots to provide insights
into the data.
•Displays categorical feature distributions and their impact on delivery outcomes.
4.Model Evaluation:
•Presents evaluation metrics using images like model summaries, confusion matrices, and
ROC curves for clarity.
5.Predictor Page:
•Offers an interactive form for users to input shipment details and receive predictions on
delivery timeliness.
•Displays probabilities of delay vs. on-time delivery and provides visual bar charts of these
probabilities.
6.Business Suggestions:
•Based on the predicted probability of delay, provides tailored recommendations for improving
logistics and minimizing delays.
7.Real-time Predictions:
•Uses user inputs to predict delivery outcomes instantly and displays results along with
confidence levels.
CONFIDENTIAL: The information in this document belongs to Boston Institute of Analytics LLC. Any unauthorized sharing of this
material is prohibited and subject to legal action under breach of IP and confidentiality clauses.
STREAMLIT LIB FOR MODEL DEPLOYMENT
CONFIDENTIAL: The information in this document belongs to Boston Institute of Analytics LLC. Any unauthorized sharing of this
material is prohibited and subject to legal action under breach of IP and confidentiality clauses.
STREAMLIT LIB FOR MODEL DEPLOYMENT
CONFIDENTIAL: The information in this document belongs to Boston Institute of Analytics LLC. Any unauthorized sharing of this
material is prohibited and subject to legal action under breach of IP and confidentiality clauses.
POWER BI CHURN PATTERN & MODEL EVALUATION
CONFIDENTIAL: The information in this document belongs to Boston Institute of Analytics LLC. Any unauthorized sharing of this
material is prohibited and subject to legal action under breach of IP and confidentiality clauses.
END TO END PROJECT – SUBMISSION FOLDER
DETAILS
CONFIDENTIAL: The information in this document belongs to Boston Institute of Analytics LLC. Any unauthorized sharing of this
material is prohibited and subject to legal action under breach of IP and confidentiality clauses.
Questions ?
CONFIDENTIAL: The information in this document belongs to Boston Institute of Analytics LLC. Any unauthorized sharing of this
material is prohibited and subject to legal action under breach of IP and confidentiality clauses.
Thank You!

Predicting E-commerce Product Delivery Using Data Analytics

  • 1.
    CONFIDENTIAL: The informationin this document belongs to Boston Institute of Analytics LLC. Any unauthorized sharing of this material is prohibited and subject to legal action under breach of IP and confidentiality clauses. E-commerce Product Delivery Prediction UMAR IBRAHIM BIA DHA PHASE 5, LAHORE, PAKISTAN BATCH 1
  • 2.
    CONFIDENTIAL: The informationin this document belongs to Boston Institute of Analytics LLC. Any unauthorized sharing of this material is prohibited and subject to legal action under breach of IP and confidentiality clauses. PROJECT SCOPE & KEY DELIVERABLES 1. To Develop robust machine learning models to predict product delivery timeliness for an international e-commerce company specializing in electronic products. 2. To Compare performance of models based on Evaluation Matrix like Precision, Recall, Accuracy, AUC-ROC & Confusion Matrix 3. To conduct Exploratory Data Analysis based on the data set to explore relationships between features of the dataset and the target label such as Delivery success 4. To deliver streamlit end to end deployment for Realtime user experience for the prediction model 5. To deliver Power BI Visualization for churn patterns and model performance
  • 3.
    CONFIDENTIAL: The informationin this document belongs to Boston Institute of Analytics LLC. Any unauthorized sharing of this material is prohibited and subject to legal action under breach of IP and confidentiality clauses. Click to edit Master title style OBJECTIVES & GOALS Objective: Develop robust machine learning models to predict product delivery timeliness for an international e-commerce company specializing in electronic products & deliver an end-to-end App for User Experience Goals: 1. Enhance understanding of product delivery patterns and customer behavior. 2. Improve customer satisfaction by predicting delivery timeliness. 3. Optimize logistics and gain operational insights. 4. Give Real time Business insights and suggestions based on the Prediction Probability
  • 4.
    CONFIDENTIAL: The informationin this document belongs to Boston Institute of Analytics LLC. Any unauthorized sharing of this material is prohibited and subject to legal action under breach of IP and confidentiality clauses. END TO END DEPLOYEMENT FLOW Data Collection, Exploration & Cleaning Data Pre- Processing & Feature Engineering Data Modeling Selection & Training Evaluation of Model & Optimization Model Deployment User Data Set
  • 5.
    CONFIDENTIAL: The informationin this document belongs to Boston Institute of Analytics LLC. Any unauthorized sharing of this material is prohibited and subject to legal action under breach of IP and confidentiality clauses. DATASET DESCRIPTION & CLEANING ① DATA FEATURES DETAILS ▪ Customer Information: Includes customer ID, gender, and past purchase behavior. ▪ Product Information: Product importance (e.g., low, medium, high), product weight in grams, and cost in USD. ▪ Shipping Details: Mode of shipment (road, ship, flight) and warehouse block (A, B, C, D, E). ▪ Customer Service Interaction: Number of calls made to customer service regarding shipments. ▪ Discounts: Discount offered on each product. ▪ Customer Ratings: Ratings provided by customers (scale from 1 to 5). ▪ Target Variable: Reached.on.Time_Y.N indicating if the product was delivered on time (0 for yes, 1 for no). ② DATA CLEANING Missing Values Handling: Checked for missing values in the dataset and imputed or removed them as necessary to maintain data integrity
  • 6.
    CONFIDENTIAL: The informationin this document belongs to Boston Institute of Analytics LLC. Any unauthorized sharing of this material is prohibited and subject to legal action under breach of IP and confidentiality clauses. DATA EXPLORATORY ANALYSIS CRITICAL OBSERVATIONS: 1. Products have a uniform price distribution, peaking around higher-cost items (~300 USD). 2. Most products receive minimal discounts, indicating a strategy that relies on product value. 3. Block 'F' is most used, handling double the products compared to other blocks. 4. Majority (75%) of shipments are via "Ship", highlighting cost efficiency but potential delay risks. 5. Over 50% of products are low importance, suggesting delivery speed may not be a top priority. 6. Male and female customers are equally represented, showing a diverse customer base. 7. Highest delayed deliveries occur in Block 'F', indicating possible logistics or capacity issues. 8. "Ship" mode has the most delays, likely due to longer transit times compared to other methods. 9. Higher median customer care calls are linked to delayed deliveries, signaling dissatisfaction. 10. Heavier products have a higher likelihood of delays, possibly due to handling challenges. Note : Detailed EDA in the code
  • 7.
    CONFIDENTIAL: The informationin this document belongs to Boston Institute of Analytics LLC. Any unauthorized sharing of this material is prohibited and subject to legal action under breach of IP and confidentiality clauses. DATASET PRE PROCESSING & FEATURE ENGINEERING ① DATA ENCODING Coded categorical features such as Gender, Warehouse_block, Mode_of_Shipment, and Product_importance using label encoding or one-hot encoding for compatibility with machine learning models. ② DATA NORMALIZATION Applied scaling techniques (e.g., StandardScaler) to numerical features like Cost_of_the_Product and Weight_in_gms to ensure models train effectively.
  • 8.
    CONFIDENTIAL: The informationin this document belongs to Boston Institute of Analytics LLC. Any unauthorized sharing of this material is prohibited and subject to legal action under breach of IP and confidentiality clauses. MODEL SELECTION AND TRAINING Model Selection Process: • Evaluated several classification algorithms to predict delivery timeliness. The models include: • Logistic Regression • Decision Tree • Random Forest (Optimized) • Gradient Boosting (Optimized) • K-Nearest Neighbors (KNN) • Support Vector Machine (SVM) • Deep Learning Models: Default Neural Network and Fine-Tuned Neural Network. • The selection of models is based on their ability to handle structured data and their suitability for classification tasks. • Test_Train split used to train and evaluate the performance matrics
  • 9.
    CONFIDENTIAL: The informationin this document belongs to Boston Institute of Analytics LLC. Any unauthorized sharing of this material is prohibited and subject to legal action under breach of IP and confidentiality clauses. TRAINING SETUP 1. Split the dataset into training and testing sets (e.g., 80/20 split) to validate the model’s performance on unseen data. 2. Used metrics like loss and accuracy to monitor training progress and adjusted hyperparameters as needed. 3. Incorporated early stopping techniques for neural networks to prevent overfitting.
  • 10.
    CONFIDENTIAL: The informationin this document belongs to Boston Institute of Analytics LLC. Any unauthorized sharing of this material is prohibited and subject to legal action under breach of IP and confidentiality clauses. EVALUATION OF MODEL I. Accuracy: Proportion of correct predictions made by the model overall. II. Precision: Measures correctness of positive predictions (true positives / total positives predicted). III. Recall: Indicates model's ability to identify actual positive cases (true positives / total actual positives). IV. F1 Score: Harmonic mean of precision and recall, useful for imbalanced classes. V. ROC-AUC Score: Area under ROC curve, measures model's ability to distinguish classes. VI. Confusion Matrix: Visualizes true/false positives and negatives for model error analysis. VII. ROC Curves: Plots trade-off between true positive and false positive rates for comparison. VIII.Performance Comparison: Summary table showing metrics for all models side-by-side. IX. Model Insights: Highlights best models, e.g., Random Forest, Gradient Boosting, Neural Networks. X. Overfitting : Monitors generalization using early stopping.
  • 11.
    CONFIDENTIAL: The informationin this document belongs to Boston Institute of Analytics LLC. Any unauthorized sharing of this material is prohibited and subject to legal action under breach of IP and confidentiality clauses. EVALUATION OF MODEL Note : Model by Model AOC & Confusion Matrix available in the code
  • 12.
    CONFIDENTIAL: The informationin this document belongs to Boston Institute of Analytics LLC. Any unauthorized sharing of this material is prohibited and subject to legal action under breach of IP and confidentiality clauses. MODEL FINE TUNING & OPTIMIZATION ❶ Hyperparameter Tuning: Used GridSearchCV to find the optimal parameters for Random Forest and Gradient Boosting models. ❷ Parameter Selection: Tuned parameters like n_estimators, max_depth, min_samples_split, and learning_rate ❸ Random Forest Optimization: Adjusted the number of trees and depth to maximize accuracy and minimize overfitting. ❹ Gradient Boosting Optimization: Tuned the learning rate and the number of boosting stages for optimal convergence. ❺ Neural Network Fine-Tuning: Adjusted architecture: added layers, dropout rates, epochs, and batch sizes for improved performance. ❻ Early Stopping: Implemented early stopping for neural networks to halt training when validation loss stopped improving. ❼ Validation Metrics: Monitored accuracy, loss, and AUC during tuning to select the best model configurations. ❽ Regularization Techniques: Applied dropout in neural networks and adjusted min_samples_split in trees to prevent overfitting.
  • 13.
    CONFIDENTIAL: The informationin this document belongs to Boston Institute of Analytics LLC. Any unauthorized sharing of this material is prohibited and subject to legal action under breach of IP and confidentiality clauses. FINAL MODEL SELECTION OBSERVATIONS 1. Random Forest achieves the highest AUC (0.75), balancing precision and recall well for classification. 2. Gradient Boosting has a high precision (0.86) but slightly lower recall, focusing on correct positive identifications. 3. Decision Tree shows the lowest AUC (0.64), indicating weaker performance in distinguishing between classes. 4. KNN has moderate AUC (0.73) with balanced precision and recall but lower overall accuracy. 5. Logistic Regression's AUC (0.72) is decent but lags behind more complex models in accuracy. 6. Random Forest and Gradient Boosting have the most accurate confusion matrix distributions, with fewer misclassifications. 7. All models perform better than random guessing; ROC curves confirm this, but advanced models perform slightly better. 8. Precision is prioritized over recall in Random Forest and Gradient Boosting, resulting in fewer false positives. 9. The Fine-Tuned Neural Network shows high precision (0.902) but sacrifices recall, focusing on minimizing false positives. 10. The Fine-Tuned Neural Network balances accuracy and F1 score effectively, making it a robust choice for deployment.
  • 14.
    CONFIDENTIAL: The informationin this document belongs to Boston Institute of Analytics LLC. Any unauthorized sharing of this material is prohibited and subject to legal action under breach of IP and confidentiality clauses. FINAL MODEL SELECTION Fine-Tuned Neural Network 1.Best Model: Fine-Tuned Neural Network selected for its high performance and adaptability after optimization. 2.Architecture Adjustments: Enhanced with additional layers, dropout rates, and optimized hyperparameters (epochs, batch size) for stability. 3.Performance Metrics: Achieved high accuracy, precision, and ROC-AUC, indicating strong predictive capabilities. 4.Generalization: Early stopping ensured the model generalizes well to unseen data. 5.Advantages: Capable of learning complex relationships within the data, surpassing other models in performance. 6.Optimization Techniques: Fine-tuned learning rate, batch size, and dropout to prevent overfitting and maximize model efficiency. 7.Deployment Readiness: Model validated with multiple metrics and ready for deployment in the logistics system. 8.Scalability: Neural network architecture allows for easy expansion and integration with additional data sources. 9.Summary: The Fine-Tuned Neural Network is the most effective model, offering flexibility and high accuracy for predicting delivery performance.
  • 15.
    CONFIDENTIAL: The informationin this document belongs to Boston Institute of Analytics LLC. Any unauthorized sharing of this material is prohibited and subject to legal action under breach of IP and confidentiality clauses. Click to edit Master title style MODEL DEPLOYMENT STREAMLIT LIB FOR MODEL DEPLOYMENT 1.Data Loading & Encoding: Loads the e-commerce dataset and encodes categorical features like Warehouse_block, Mode_of_Shipment, and Gender using LabelEncoder. 2.Model Loading: Loads a pre-trained Fine-Tuned Neural Network model (Tuned_NN_Model.h5) for making predictions. 3.EDA (Exploratory Data Analysis): •Visualizes feature distributions, correlation matrix, bar plots, and box plots to provide insights into the data. •Displays categorical feature distributions and their impact on delivery outcomes. 4.Model Evaluation: •Presents evaluation metrics using images like model summaries, confusion matrices, and ROC curves for clarity. 5.Predictor Page: •Offers an interactive form for users to input shipment details and receive predictions on delivery timeliness. •Displays probabilities of delay vs. on-time delivery and provides visual bar charts of these probabilities. 6.Business Suggestions: •Based on the predicted probability of delay, provides tailored recommendations for improving logistics and minimizing delays. 7.Real-time Predictions: •Uses user inputs to predict delivery outcomes instantly and displays results along with confidence levels.
  • 16.
    CONFIDENTIAL: The informationin this document belongs to Boston Institute of Analytics LLC. Any unauthorized sharing of this material is prohibited and subject to legal action under breach of IP and confidentiality clauses. STREAMLIT LIB FOR MODEL DEPLOYMENT
  • 17.
    CONFIDENTIAL: The informationin this document belongs to Boston Institute of Analytics LLC. Any unauthorized sharing of this material is prohibited and subject to legal action under breach of IP and confidentiality clauses. STREAMLIT LIB FOR MODEL DEPLOYMENT
  • 18.
    CONFIDENTIAL: The informationin this document belongs to Boston Institute of Analytics LLC. Any unauthorized sharing of this material is prohibited and subject to legal action under breach of IP and confidentiality clauses. POWER BI CHURN PATTERN & MODEL EVALUATION
  • 19.
    CONFIDENTIAL: The informationin this document belongs to Boston Institute of Analytics LLC. Any unauthorized sharing of this material is prohibited and subject to legal action under breach of IP and confidentiality clauses. END TO END PROJECT – SUBMISSION FOLDER DETAILS
  • 20.
    CONFIDENTIAL: The informationin this document belongs to Boston Institute of Analytics LLC. Any unauthorized sharing of this material is prohibited and subject to legal action under breach of IP and confidentiality clauses. Questions ?
  • 21.
    CONFIDENTIAL: The informationin this document belongs to Boston Institute of Analytics LLC. Any unauthorized sharing of this material is prohibited and subject to legal action under breach of IP and confidentiality clauses. Thank You!