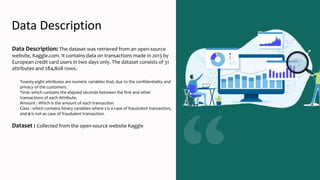
The project explores machine learning algorithms to detect fraudulent credit card transactions, driven by a 44.7% increase in fraud reports in 2020. Various models, including KNN, logistic regression, SVM, and decision trees, were developed and evaluated on a dataset of historical transactions collected from Kaggle. The main goal is to identify the most effective model for detecting fraud while addressing class imbalances in the dataset.


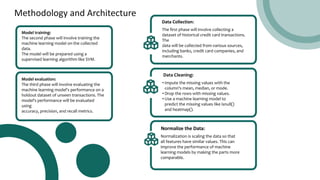
![Literature Review
• The model used by Alenzi and Aljehane to detect Fraud in credit cards was Logis- tic
Regression. Their model scored 97.2% in Accuracy, 97% sensitivity and 2.8% Error Rate.[1]
• Dighe and his team used KNN, Logistic Regression and Neural Networks, multi- layer
perceptron and Decision Tree in their work, then evaluated the results regarding
numerous accuracy metrics. Of all the models created, the best performing one is KNN,
which scored 99.13%, then in second place performing model at 96.40% and in last place is
logistic Regression with 96.27%.[2]
• Sahin and Duman used four Support Vector Machine methods in detecting credit card
fraud. (SVM) Support Vector Machine with RBF, Polynomial, Sigmoid, and Linear
Kernel,all models scored 99.87% in the training model and 83.02% in the test- ing part of
the model.[3]
• Maniraj’s team built a model to recognize if any new transaction is Fraud or non- fraud.
Their goal was to get 100% in detecting fraudulent transactions andtry to minimize the
incorrectly classified fraud instances. Their model has performed well as they got 99.7% of
the fraudulent transactions.[4]](https://image.slidesharecdn.com/toolstechniqueproject-250102143352-9b36c58b/85/Tools-Technique-Project-for-machine-learning-4-320.jpg)


![References
[1] . A. N. O. Alenzi, H. Z., “Fraud detection in credit cards using logistic regression.
https://thesai.org/Publications/ViewPaper?Volume=11&Issue=
12&Code=IJACSA&SerialNo=65, 2020
[2]. P. S. . K. S. Dighe, D., “Detection of credit card fraud transactions using machine learning
algorithms and neural networks.”
https://doi.org/10.1109/iccubea.
[3] . D. E. . Sahin, Y., “Detecting credit card fraud by decision trees and support vector
machines,” 2011. Accessed: 23-oct-2023.
[4] . S. A. A. S. . S. S. D. Maniraj, S. P., “Credit card fraud detection using machine learning and
data science.”
https://doi.org/10.17577/ijertv8is090031, 2019. Accessed: 25-oct-2023.](https://image.slidesharecdn.com/toolstechniqueproject-250102143352-9b36c58b/85/Tools-Technique-Project-for-machine-learning-15-320.jpg)


![[DSC Europe 25] Mijat Kustudic - Building Financial Intelligence with AI Agen...](https://cdn.slidesharecdn.com/ss_thumbnails/38y2lb5lse6wstegtvas-3-mijat-kustudic-building-financial-intelligence-with-ai-agents-260114111931-1a4783ce-thumbnail.jpg?width=640&height=640&fit=bounds)


![[DSC Europe 25] Danilo Djukanovic - From Vibes to KPIs: Turning Culture Into ...](https://cdn.slidesharecdn.com/ss_thumbnails/inqestws5wf0cik2glgv-3-danilo-djukanovic-from-vibes-to-kpis-presentation-260114111931-dacff81f-thumbnail.jpg?width=640&height=640&fit=bounds)


![[DSC Europe 25] Slobodan Dolinic - Smart and Intelligent Green Region.pptx](https://cdn.slidesharecdn.com/ss_thumbnails/0bribinjsp6ghwtvsvor-2-sigre-slobodan-dolinic-260115093812-c9c10e90-thumbnail.jpg?width=640&height=640&fit=bounds)

![[DSC Europe 25] Dragan Jerosimovic - The Anatomy of a Narrative Simulation.pdf](https://cdn.slidesharecdn.com/ss_thumbnails/vzputuprdqr6zwbrwdcw-1-dragan-jerosimovic-the-anatomy-of-a-narrative-simulation-260114111931-9d04fba2-thumbnail.jpg?width=640&height=640&fit=bounds)


![[DSC Europe 25] Ivica Milaric - The Future of Gaming and AI Tools.pptx](https://cdn.slidesharecdn.com/ss_thumbnails/tijgzsmgse2kj2y5pzzp-5-ivica-milaric-the-future-of-gaming-x-ai-tools-260114111931-87c2b3ac-thumbnail.jpg?width=640&height=640&fit=bounds)