This document discusses classification evaluation metrics and their limitations. It introduces the confusion matrix and metrics calculated from it such as precision, recall, F1-score, and accuracy. The summary highlights that these metrics can be "hacked" and misleading. More robust alternatives like balanced accuracy and MCC are presented that account for true negatives and are not as affected by class imbalance. Comprehensive reporting of multiple metrics from different perspectives is recommended for fully understanding a model's performance.
Naive Bayes is a kind of classifier which uses the Bayes Theorem. It predicts membership probabilities for each class such as the probability that given record or data point belongs to a particular class.
How to validate a model?
What is a best model ?
Types of data
Types of errors
The problem of over fitting
The problem of under fitting
Bias Variance Tradeoff
Cross validation
K-Fold Cross validation
Boot strap Cross validation
There are 100,000 applicants for loans. Who is likely to default? How to effectively offer a loan
There are 100,000 consumers who is likely to buy my product? How to effectively market my product?
There are more than 1,000,000,000 transactions in a day. How to identify the fraud transaction?
There are 1,000,000 claims every year. How to identify the fake claims
This Logistic Regression Presentation will help you understand how a Logistic Regression algorithm works in Machine Learning. In this tutorial video, you will learn what is Supervised Learning, what is Classification problem and some associated algorithms, what is Logistic Regression, how it works with simple examples, the maths behind Logistic Regression, how it is different from Linear Regression and Logistic Regression applications. At the end, you will also see an interesting demo in Python on how to predict the number present in an image using Logistic Regression.
Below topics are covered in this Machine Learning Algorithms Presentation:
1. What is supervised learning?
2. What is classification? what are some of its solutions?
3. What is logistic regression?
4. Comparing linear and logistic regression
5. Logistic regression applications
6. Use case - Predicting the number in an image
What is Machine Learning: Machine Learning is an application of Artificial Intelligence (AI) that provides systems the ability to automatically learn and improve from experience without being explicitly programmed.
- - - - - - - -
About Simplilearn Machine Learning course:
A form of artificial intelligence, Machine Learning is revolutionizing the world of computing as well as all people’s digital interactions. Machine Learning powers such innovative automated technologies as recommendation engines, facial recognition, fraud protection and even self-driving cars.This Machine Learning course prepares engineers, data scientists and other professionals with knowledge and hands-on skills required for certification and job competency in Machine Learning.
- - - - - - -
Why learn Machine Learning?
Machine Learning is taking over the world- and with that, there is a growing need among companies for professionals to know the ins and outs of Machine Learning
The Machine Learning market size is expected to grow from USD 1.03 Billion in 2016 to USD 8.81 Billion by 2022, at a Compound Annual Growth Rate (CAGR) of 44.1% during the forecast period.
- - - - - -
What skills will you learn from this Machine Learning course?
By the end of this Machine Learning course, you will be able to:
1. Master the concepts of supervised, unsupervised and reinforcement learning concepts and modeling.
2. Gain practical mastery over principles, algorithms, and applications of Machine Learning through a hands-on approach which includes working on 28 projects and one capstone project.
3. Acquire thorough knowledge of the mathematical and heuristic aspects of Machine Learning.
4. Understand the concepts and operation of support vector machines, kernel SVM, naive bayes, decision tree classifier, random forest classifier, logistic regression, K-nearest neighbors, K-means clustering and more.
5. Be able to model a wide variety of robust Machine Learning algorithms including deep learning, clustering, and recommendation systems
- - - - - - -
K Means Clustering Algorithm | K Means Clustering Example | Machine Learning ...Simplilearn
This K-Means clustering algorithm presentation will take you through the machine learning introduction, types of clustering algorithms, k-means clustering, how does K-Means clustering work and at least explains K-Means clustering by taking a real life use case. This Machine Learning algorithm tutorial video is ideal for beginners to learn how K-Means clustering work.
Below topics are covered in this K-Means Clustering Algorithm presentation:
1. Types of Machine Learning?
2. What is K-Means Clustering?
3. Applications of K-Means Clustering
4. Common distance measure
5. How does K-Means Clustering work?
6. K-Means Clustering Algorithm
7. Demo: k-Means Clustering
8. Use case: Color compression
- - - - - - - -
About Simplilearn Machine Learning course:
A form of artificial intelligence, Machine Learning is revolutionizing the world of computing as well as all people’s digital interactions. Machine Learning powers such innovative automated technologies as recommendation engines, facial recognition, fraud protection and even self-driving cars.This Machine Learning course prepares engineers, data scientists and other professionals with knowledge and hands-on skills required for certification and job competency in Machine Learning.
- - - - - - -
Why learn Machine Learning?
Machine Learning is taking over the world- and with that, there is a growing need among companies for professionals to know the ins and outs of Machine Learning
The Machine Learning market size is expected to grow from USD 1.03 Billion in 2016 to USD 8.81 Billion by 2022, at a Compound Annual Growth Rate (CAGR) of 44.1% during the forecast period.
- - - - - -
What skills will you learn from this Machine Learning course?
By the end of this Machine Learning course, you will be able to:
1. Master the concepts of supervised, unsupervised and reinforcement learning concepts and modeling.
2. Gain practical mastery over principles, algorithms, and applications of Machine Learning through a hands-on approach which includes working on 28 projects and one capstone project.
3. Acquire thorough knowledge of the mathematical and heuristic aspects of Machine Learning.
4. Understand the concepts and operation of support vector machines, kernel SVM, naive bayes, decision tree classifier, random forest classifier, logistic regression, K-nearest neighbors, K-means clustering and more.
5. Be able to model a wide variety of robust Machine Learning algorithms including deep learning, clustering, and recommendation systems
- - - - - - -
In this presentation is given an introduction to Bayesian networks and basic probability theory. Graphical explanation of Bayes' theorem, random variable, conditional and joint probability. Spam classifier, medical diagnosis, fault prediction. The main software for Bayesian Networks are presented.
Basic of Decision Tree Learning. This slide includes definition of decision tree, basic example, basic construction of a decision tree, mathlab example
Page 266LEARNING OBJECTIVES· Explain how researchers use inf.docxkarlhennesey
Page 266
LEARNING OBJECTIVES
· Explain how researchers use inferential statistics to evaluate sample data.
· Distinguish between the null hypothesis and the research hypothesis.
· Discuss probability in statistical inference, including the meaning of statistical significance.
· Describe the t test and explain the difference between one-tailed and two-tailed tests.
· Describe the F test, including systematic variance and error variance.
· Describe what a confidence interval tells you about your data.
· Distinguish between Type I and Type II errors.
· Discuss the factors that influence the probability of a Type II error.
· Discuss the reasons a researcher may obtain nonsignificant results.
· Define power of a statistical test.
· Describe the criteria for selecting an appropriate statistical test.
Page 267IN THE PREVIOUS CHAPTER, WE EXAMINED WAYS OF DESCRIBING THE RESULTS OF A STUDY USING DESCRIPTIVE STATISTICS AND A VARIETY OF GRAPHING TECHNIQUES. In addition to descriptive statistics, researchers use inferential statistics to draw more general conclusions about their data. In short, inferential statistics allow researchers to (a) assess just how confident they are that their results reflect what is true in the larger population and (b) assess the likelihood that their findings would still occur if their study was repeated over and over. In this chapter, we examine methods for doing so.
SAMPLES AND POPULATIONS
Inferential statistics are necessary because the results of a given study are based only on data obtained from a single sample of research participants. Researchers rarely, if ever, study entire populations; their findings are based on sample data. In addition to describing the sample data, we want to make statements about populations. Would the results hold up if the experiment were conducted repeatedly, each time with a new sample?
In the hypothetical experiment described in Chapter 12 (see Table 12.1), mean aggression scores were obtained in model and no-model conditions. These means are different: Children who observe an aggressive model subsequently behave more aggressively than children who do not see the model. Inferential statistics are used to determine whether the results match what would happen if we were to conduct the experiment again and again with multiple samples. In essence, we are asking whether we can infer that the difference in the sample means shown in Table 12.1 reflects a true difference in the population means.
Recall our discussion of this issue in Chapter 7 on the topic of survey data. A sample of people in your state might tell you that 57% prefer the Democratic candidate for an office and that 43% favor the Republican candidate. The report then says that these results are accurate to within 3 percentage points, with a 95% confidence level. This means that the researchers are very (95%) confident that, if they were able to study the entire population rather than a sample, the actual percentage who preferred th ...
A short introduction to sample size estimation for Research methodology workshop at Dr. BVP RMC, Pravara Institute of Medical Sciences(DU), Loni by Dr. Mandar Baviskar
Similar to Confusion matrix and classification evaluation metrics (20)
Data Centers - Striving Within A Narrow Range - Research Report - MCG - May 2...pchutichetpong
M Capital Group (“MCG”) expects to see demand and the changing evolution of supply, facilitated through institutional investment rotation out of offices and into work from home (“WFH”), while the ever-expanding need for data storage as global internet usage expands, with experts predicting 5.3 billion users by 2023. These market factors will be underpinned by technological changes, such as progressing cloud services and edge sites, allowing the industry to see strong expected annual growth of 13% over the next 4 years.
Whilst competitive headwinds remain, represented through the recent second bankruptcy filing of Sungard, which blames “COVID-19 and other macroeconomic trends including delayed customer spending decisions, insourcing and reductions in IT spending, energy inflation and reduction in demand for certain services”, the industry has seen key adjustments, where MCG believes that engineering cost management and technological innovation will be paramount to success.
MCG reports that the more favorable market conditions expected over the next few years, helped by the winding down of pandemic restrictions and a hybrid working environment will be driving market momentum forward. The continuous injection of capital by alternative investment firms, as well as the growing infrastructural investment from cloud service providers and social media companies, whose revenues are expected to grow over 3.6x larger by value in 2026, will likely help propel center provision and innovation. These factors paint a promising picture for the industry players that offset rising input costs and adapt to new technologies.
According to M Capital Group: “Specifically, the long-term cost-saving opportunities available from the rise of remote managing will likely aid value growth for the industry. Through margin optimization and further availability of capital for reinvestment, strong players will maintain their competitive foothold, while weaker players exit the market to balance supply and demand.”
Explore our comprehensive data analysis project presentation on predicting product ad campaign performance. Learn how data-driven insights can optimize your marketing strategies and enhance campaign effectiveness. Perfect for professionals and students looking to understand the power of data analysis in advertising. for more details visit: https://bostoninstituteofanalytics.org/data-science-and-artificial-intelligence/
Opendatabay - Open Data Marketplace.pptxOpendatabay
Opendatabay.com unlocks the power of data for everyone. Open Data Marketplace fosters a collaborative hub for data enthusiasts to explore, share, and contribute to a vast collection of datasets.
First ever open hub for data enthusiasts to collaborate and innovate. A platform to explore, share, and contribute to a vast collection of datasets. Through robust quality control and innovative technologies like blockchain verification, opendatabay ensures the authenticity and reliability of datasets, empowering users to make data-driven decisions with confidence. Leverage cutting-edge AI technologies to enhance the data exploration, analysis, and discovery experience.
From intelligent search and recommendations to automated data productisation and quotation, Opendatabay AI-driven features streamline the data workflow. Finding the data you need shouldn't be a complex. Opendatabay simplifies the data acquisition process with an intuitive interface and robust search tools. Effortlessly explore, discover, and access the data you need, allowing you to focus on extracting valuable insights. Opendatabay breaks new ground with a dedicated, AI-generated, synthetic datasets.
Leverage these privacy-preserving datasets for training and testing AI models without compromising sensitive information. Opendatabay prioritizes transparency by providing detailed metadata, provenance information, and usage guidelines for each dataset, ensuring users have a comprehensive understanding of the data they're working with. By leveraging a powerful combination of distributed ledger technology and rigorous third-party audits Opendatabay ensures the authenticity and reliability of every dataset. Security is at the core of Opendatabay. Marketplace implements stringent security measures, including encryption, access controls, and regular vulnerability assessments, to safeguard your data and protect your privacy.
As Europe's leading economic powerhouse and the fourth-largest hashtag#economy globally, Germany stands at the forefront of innovation and industrial might. Renowned for its precision engineering and high-tech sectors, Germany's economic structure is heavily supported by a robust service industry, accounting for approximately 68% of its GDP. This economic clout and strategic geopolitical stance position Germany as a focal point in the global cyber threat landscape.
In the face of escalating global tensions, particularly those emanating from geopolitical disputes with nations like hashtag#Russia and hashtag#China, hashtag#Germany has witnessed a significant uptick in targeted cyber operations. Our analysis indicates a marked increase in hashtag#cyberattack sophistication aimed at critical infrastructure and key industrial sectors. These attacks range from ransomware campaigns to hashtag#AdvancedPersistentThreats (hashtag#APTs), threatening national security and business integrity.
🔑 Key findings include:
🔍 Increased frequency and complexity of cyber threats.
🔍 Escalation of state-sponsored and criminally motivated cyber operations.
🔍 Active dark web exchanges of malicious tools and tactics.
Our comprehensive report delves into these challenges, using a blend of open-source and proprietary data collection techniques. By monitoring activity on critical networks and analyzing attack patterns, our team provides a detailed overview of the threats facing German entities.
This report aims to equip stakeholders across public and private sectors with the knowledge to enhance their defensive strategies, reduce exposure to cyber risks, and reinforce Germany's resilience against cyber threats.
Levelwise PageRank with Loop-Based Dead End Handling Strategy : SHORT REPORT ...Subhajit Sahu
Abstract — Levelwise PageRank is an alternative method of PageRank computation which decomposes the input graph into a directed acyclic block-graph of strongly connected components, and processes them in topological order, one level at a time. This enables calculation for ranks in a distributed fashion without per-iteration communication, unlike the standard method where all vertices are processed in each iteration. It however comes with a precondition of the absence of dead ends in the input graph. Here, the native non-distributed performance of Levelwise PageRank was compared against Monolithic PageRank on a CPU as well as a GPU. To ensure a fair comparison, Monolithic PageRank was also performed on a graph where vertices were split by components. Results indicate that Levelwise PageRank is about as fast as Monolithic PageRank on the CPU, but quite a bit slower on the GPU. Slowdown on the GPU is likely caused by a large submission of small workloads, and expected to be non-issue when the computation is performed on massive graphs.
Levelwise PageRank with Loop-Based Dead End Handling Strategy : SHORT REPORT ...
Confusion matrix and classification evaluation metrics
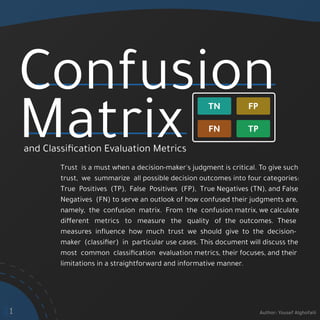
1. Confusion
Trust is a must when a decision-maker's judgment is critical. To give such
trust, we summarize all possible decision outcomes into four categories:
True Positives (TP), False Positives (FP), True Negatives (TN), and False
Negatives (FN) to serve an outlook of how confused their judgments are,
namely, the confusion matrix. From the confusion matrix, we calculate
different metrics to measure the quality of the outcomes. These
measures influence how much trust we should give to the decision-
maker (classifier) in particular use cases. This document will discuss the
most common classification evaluation metrics, their focuses, and their
limitations in a straightforward and informative manner.
Matrix TN
TP
FP
FN
and Classification Evaluation Metrics
Author: Yousef Alghofaili
1
2. NPV
(Negative Predictive Value)
TN
TN FN
True Negative Rate
Specificity
TN
TN FP
TP
TP
Recall
FN
Sensitivity or True Positive Rate
TP
TP FP
Precision
Positive Predictive Value
Matthews Correlation Coefficient (MCC)
( )
FP FN
( )
TP TN
( )
TP FP TP FN FP TN FN
( ) ( ) ( )
Accuracy
TP TN
TP TN
FP FN
F1-Score
Precision Recall
Precision Recall
2
Balanced Accuracy
Sensitivity Specificity
2
2
TN
Author: Yousef Alghofaili
Predicted Value
Actual
Value
Negative Positive
Positive
Negative
TN
TP
FP
FN
TN
This car is NOT red This car is NOT red
TP
This car is red This car is red
FN
This car is NOT red This car is red
FP
This car is red This car is NOT red
Guess Fact
Confusion Matrix
3. Precision & Recall
FP FP
FP
FP
FP
FP
This customer loves steak! No, this customer is vegan.
Bad Product Recommendation → Less Conversion → Decrease in Sales
FN FN
FN
FN
FN
FN
The product has no defects. A customer called... He's angry.
Bad Defect Detector → Bad Quality → Customer Dissatisfaction
TP
TP TP TP TP
Common Goal
Precision Goal
Recall Goal
We use both metrics when actual negatives are less relevant. For example, googling "Confusion Matrix"
will have trillions of unrelated (negative) web pages, such as the "Best Pizza Recipe!" web page. Accounting
for whether we have correctly predicted the latter webpage and alike as negative is impractical.
3 Author: Yousef Alghofaili
4. Specificity & NPV
FN FN
FN
FN
FN
FN
No, they should be treated!
Bad Diagnosis → No Treatment → Consequences
FP FP
FP
FP
FP
FP
This person is a criminal. They were detained for no reason.
Bad Predictive Policing → Injustice
Specificity Goal
NPV Goal
TN
TN TN TN TN
Common Goal
We use both metrics when actual positives are less relevant. In essence, we aim to rule out a
phenomenon. For example, we want to know how many healthy people (no disease detected) there are
in a population. Or, how many trustworthy websites (not fraudulent) is someone visiting.
They don't have cancer.
4 Author: Yousef Alghofaili
5. Hacks
Previously explained evaluation metrics, among many, are
granular, as they focus on one angle of prediction quality
which can mislead us into thinking that a predictive model
is highly accurate. Generally, these metrics are not used
solely. Let us see how easy it is to manipulate the
aforementioned metrics.
5 Author: Yousef Alghofaili
6. Get at least one positive sample correctly Predict almost all samples as negative
TP≈1
TP≈1 FP≈0
100%
Predicting positive samples with a high confidence threshold would potentially bring out this case. In
addition, when positive samples are disproportionately higher than negatives, false positives will
probabilistically be rarer. Hence, precision will tend to be high.
Precision
Negatives
TN≈50
Positives
FN≈49
TP≈1
Hacking
6 Author: Yousef Alghofaili
Precision is the ratio of correctly classified positive samples to the total number of positive predictions.
Hence the name, Positive Predictive Value.
50 Positive Samples 50 Negative Samples
Dataset
7. 7 Author: Yousef Alghofaili
50 Positive Samples 50 Negative Samples
Dataset
Recall Hacking
Recall is the ratio of correctly classified positive samples to the total number of actual positive samples.
Hence the name, True Positive Rate.
Predict all samples as positive
Negatives
Positives
TP=50 FP=50
TP=50
TP=50 FN=0
100%
Similar to precision, when positive samples are disproportionately higher, the classifier would generally
be biased towards positive class predictions to reduce the number of mistakes.
8. 8 Author: Yousef Alghofaili
50 Positive Samples 50 Negative Samples
Dataset
Specificity Hacking
Specificity is the ratio of correctly classified negative samples to the total number of actual negative
samples. Hence the name, True Negative Rate.
Predict all samples as negative
Negatives
Positives
FN=50 TN=50
TN=50
TN=50 FP=0
100%
Contrary to Recall (Sensitivity), Specificity focuses on the negative class. Hence, we face this problem
when negative samples are disproportionately higher. Notice how the Balanced Accuracy metric
intuitively solves this issue in subsequent pages.
9. 9 Author: Yousef Alghofaili
50 Positive Samples 50 Negative Samples
Dataset
Negative Predictive Value is the ratio of correctly classified negative samples to the total number of negative
predictions. Hence the name.
NPV Hacking
Get at least one negative sample correctly
Predict almost all samples as positive
Negatives
Positives
TP≈50 FP≈49
TN≈1
TN≈1
TN≈1 FN≈0
100%
Predicting negative samples with a high confidence threshold has this case as a consequence. Also,
when negative samples are disproportionately higher, false negatives will probabilistically be rarer.
Thus, NPV will tend to be high.
10. As we have seen above, some metrics can misinform us
about the actual performance of a classifier. However,
there are other metrics that include more information
about the performance. Nevertheless, all metrics can be
“hacked” in one way or another. Hence, we commonly
report multiple metrics to observe multiple viewpoints
of the model's performance.
10 Author: Yousef Alghofaili
Comprehensive
Metrics
11. Accuracy
TP TN
TP TN
FP FN
Accuracy treats all error types (false positives and false negatives) as equal. However, equal is not always
preferred.
Since accuracy assigns equal cost to all error types, having significantly more positive samples than
negatives will make accuracy biased towards the larger class. In fact, the Accuracy Paradox is a direct
"hack" against the metric. Assume you have 99 samples of class 1 and 1 sample of class 0. If your
classifier predicts everything as class 1, it will get an accuracy of 99%.
Positives Negatives
Accuracy Paradox
11 Author: Yousef Alghofaili
12. F1-Score is asymmetric to the choice of which class is negative or positive. Changing the positive
class into the negative one will not produce a similar score in most cases.
Precision Recall
Precision Recall
2
F1-Score does not account for true negatives. For example, correctly diagnosing a patient with no
disease (true negative) has no impact on the F1-Score.
Positives Negatives Negatives Positives
Asymmetric Measure
True Negatives Absence
F1-Score
F1-Score will combine precision and recall in a way that is sensitive to a decrease in any of the two (Harmonic
Mean). Note that the issues mentioned below do apply to Fβ
score in general.
Extra: Know more about Fβ
Score on Page 18 Author: Yousef Alghofaili
12
13. Balanced Accuracy
Balanced Accuracy accounts for the positive and negative classes independently using Sensitivity and
Specificity, respectively. The metric partially solves the Accuracy paradox through independent calculation
of error types and solves the true negative absence problem in Fβ
-Score through the inclusion of Specificity.
Sensitivity Specificity
2
Balanced Accuracy is commonly robust against imbalanced datasets, but that does not apply to the
above-illustrated cases. Both models perform poorly at predicting one of the two (positive P or
negative N) classes, therefore unreliable at one. Yet, Balanced Accuracy is 90%, which is misleading.
Relative Differences in error types
13
9
1000
TP
FP
1
TP
FP
9000
9
TN
FN
1000
9000
TN
1
FN
Author: Yousef Alghofaili
14. Matthews Correlation Coefficient (MCC)
MCC calculates the correlation between the actual and predicted labels, which produces a number between
-1 and 1. Hence, it will only produce a good score if the model is accurate in all confusion matrix components.
MCC is the most robust metric against imbalanced dataset issues or random classifications.
( )
FP FN
( )
TP TN
( )
TP FP TP FN FP TN FN
( ) ( ) ( )
MCC faces an issue of it being undefined whenever a full
row or a column in a confusion matrix is zeros. However,
the issue is outside the scope of this document. Note
that this is solved by simply substituting zeros with an
arbitrarily small value.
14
TN
Author: Yousef Alghofaili
15. Conclusion
We have gone through all confusion matrix components,
discussed some of the most popular metrics, how easy it is
for them to be "hacked", alternatives to overcome these
problems through more generalized metrics, and each one's
limitations. The key takeaways are:
Recognize the hacks against granular metrics as you might fall into one unintentionally. Although
these metrics are not solely used in reporting, they are heavily used in development settings to
debug a classifier's behavior.
Know the limitations of popular classification evaluations metrics used in reporting so that you
become equipped with enough acumen to decide whether you have obtained the optimal
classifier or not.
Never get persuaded by the phrase "THE BEST" in the context of machine learning, especially
evaluation metrics. Every metric approached in this document (including MCC) is the
best metric only when it best fits the project's objective.
15 Author: Yousef Alghofaili
16. References
Chicco, D., & Jurman, G. (2020). The advantages of the Matthews correlation coefficient
(MCC) over F1 score and accuracy in binary classification evaluation. BMC genomics, 21(1),
1-13.
16
Chicco, D., Tötsch, N., & Jurman, G. (2021). The Matthews correlation coefficient (MCC) is
more reliable than balanced accuracy, bookmaker informedness, and markedness in two-class
confusion matrix evaluation. BioData mining, 14(1), 1-22.
Lalkhen, A. G., & McCluskey, A. (2008). Clinical tests: sensitivity and specificity. Continuing
education in anaesthesia critical care & pain, 8(6), 221-223.
Hull, D. (1993, July). Using statistical testing in the evaluation of retrieval experiments. In
Proceedings of the 16th annual international ACM SIGIR conference on Research and
development in information retrieval (pp. 329-338).
Hossin, M., & Sulaiman, M. N. (2015). A review on evaluation metrics for data classification
evaluations. International journal of data mining & knowledge management process, 5(2), 1.
Jurman, G., Riccadonna, S., & Furlanello, C. (2012). A comparison of MCC and CEN error
measures in multi-class prediction.
Chicco, D. (2017). Ten quick tips for machine learning in computational biology. BioData
mining, 10(1), 1-17.
Author: Yousef Alghofaili
17. Yousef Alghofaili
AI solutions architect and researcher who has studied at KFUPM
and Georgia Institute of Technology. He worked with multiple
research groups from KAUST, KSU, and KFUPM. He has also built
and managed noura.ai data science R&D team as the AI Director.
He is an official author at Towards Data Science Publication and
developer of KMeansInterp Algorithm.
THANK YOU!
17
For any feedback, issues, or inquiries, contact yousefalghofaili@gmail.com
Author: Yousef Alghofaili
Author
Reviewer
Dr. Motaz Alfarraj
Assistant Professor at KFUPM, and the Acting Director of SDAIA-
KFUPM Joint Research Center for Artificial Intelligence (JRC-AI).
He has received his Bachelor's degree from KFUPM, and earned
his Master's and Ph.D. degrees in Electrical Engineering, Digital
Image Processing and Computer Vision from Georgia Institute
of Technology. He has contributed to ML research as an author
of many research papers and won many awards in his field.
https://www.linkedin.com/in/yousefgh/
https://www.linkedin.com/in/motazalfarraj/
mailto:yousefalghofaili@gmail.com
18. Fβ
Score is the generalized form of F1 Score (Fβ = 1
Score) where the difference lies within the variability of the
β Factor. The β Factor skews the final score into favoring recall β times over precision, enabling us to weigh
the risk of having false negatives (Type II Errors) and false positives (Type I Errors) differently.
Precision Recall
( 1 + β2
)
Precision Recall
( β2
)
β
β
β = 1
Precision is β times Less important than Recall
Precision is β times More important than Recall
Balanced F1-Score
β
β
β = 1
Fβ
Score has been originally developed to evaluate Information Retrieval (IR) systems such as Google
Search Engine. When you search for a webpage, but it does not appear, you are experiencing the
engine's low Recall. When the results you see are completely irrelevant, you are experiencing its low
Precision. Hence, search engines play with the β Factor to optimize User Experience by favoring one
of the two experiences you have had over another.
Fβ
Score
Extra
18 Author: Yousef Alghofaili