The document discusses planning time and determining the schedule for an integrative project. It provides information on:
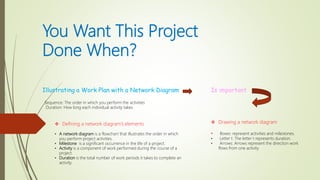
1) How to illustrate a work plan using a network diagram by defining its elements such as activities, milestones, and durations.
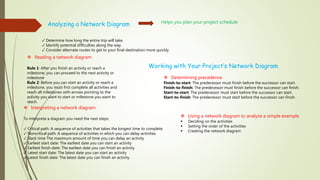
2) How analyzing a network diagram can help plan the project schedule and identify potential issues.
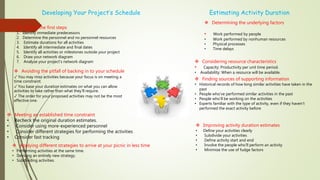
3) Steps for developing a project's schedule including identifying predecessors, estimating durations, and drawing the network diagram.
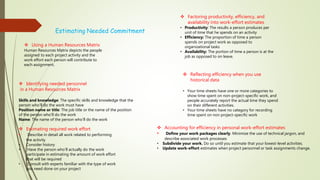
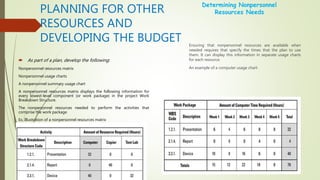
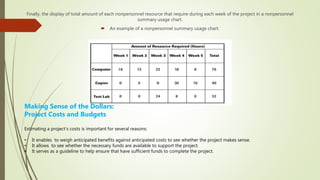
4) Techniques for determining resource needs such as using a skills matrix to identify team members' proficiencies and a resource loading chart to estimate work efforts.
Part II: Planning Time: Determining When and How MuchMuzo Bacan
The document provides guidance on planning timelines and estimating durations for projects. It discusses determining project deadlines, developing network diagrams to visualize activity sequences and durations, and analyzing the diagrams to calculate earliest and latest start/finish dates. The document recommends identifying predecessors, estimating durations, and determining required resources as first steps in timeline planning. It also discusses developing Gantt charts and milestone lists to present project schedules.
The critical path in this network diagram is activities A, B, D, and E. This path has the longest total duration of 15 days. Any delay to activities on this path would delay the entire project completion. Activities C and F are not on the critical path and have float.
This document defines key terms related to scheduling projects in Microsoft Project, including duration, work, resources, resource units, and scheduling formulas. It explains the differences between fixed units, fixed work, and fixed duration task types and how changing resources or work affects duration for each type. The document also covers effort-driven tasks, over-allocation of resources, and leveling of resources to resolve conflicts.
Resource planning is crucial for small consulting firms to effectively allocate developers across multiple projects. The document recommends starting simply by planning only for developers in weekly increments. It involves identifying available developers and their capacities, current projects and their needs, and adjusting to keep the difference between available and needed resources at zero. Regularly updating the shared resource plan helps optimize allocation and improves estimates over time. Keeping the process simple and data-driven helps objectively evaluate scenarios to deliver projects on schedule.
This document discusses Project Evaluation and Review Technique (PERT), Gantt charts, and Management by Objectives (MBO). PERT is a project management tool used to schedule tasks, analyze time needed to complete tasks, and identify the minimum time to complete a project. Gantt charts are graphical representations of project schedules that show tasks, resources, and timelines. MBO is a comprehensive management system that integrates key activities to effectively achieve organizational objectives through goal-setting and periodic performance reviews.
A Gantt chart is a project management tool used to visualize tasks, milestones, and durations of a project. It displays activities along a timeline to help schedule resources and track progress. Gantt charts break large projects into smaller activities, show dependencies between tasks, and identify overlapping work to help ensure projects stay on schedule and meet deadlines. They provide visibility into the project plan and allow managers to monitor performance and coordinate work across teams.
A guide to create a quality project scheduleNirtiSingla
The document provides guidance on creating a quality project schedule in 7 steps: 1) Plan with the team to create a basic high-level schedule, 2) Cover the entire project scope by listing all required activities, 3) Group tasks into phases like initiation, build, and closure, 4) Add milestones to track progress, 5) Estimate task times using experience, 6) Assign team members to tasks matching their skills, and 7) Review the schedule for errors and hold daily meetings to update it. Following these steps helps create a meaningful and realistic schedule that is the basis for project success.
The document discusses project evaluation and review technique (PERT). It begins by explaining that PERT was developed in the 1950s for the Polaris submarine missile program to reduce time and costs of projects. PERT breaks projects down into activities, events, and relationships between them in a network diagram. It estimates optimistic, most likely, and pessimistic durations for activities to account for uncertainty. The critical path showing the longest sequence of activities determining the project duration is identified. PERT is useful for planning resources, reviewing progress, and evaluating performance. Limitations include not directly considering costs and variable activity times.
The document discusses project scheduling and the critical path method (CPM) for project management. It explains that a project schedule lays out the sequence and timing of tasks to transform a project vision into a time-based plan. The critical path method uses a network diagram to identify the longest continuous chain of tasks in a project as the "critical path" that must be followed to complete the project on time. Monitoring and controlling activities on the critical path is essential to keeping the project on schedule.
Project scheduling involves defining tasks, estimating durations, determining dependencies, assigning resources, and communicating a timeline. The key steps are to create a work breakdown structure, estimate task durations using techniques like three-point estimating, determine relationships between tasks, and finalize the schedule by allocating resources. Project schedules can be modeled and optimized using techniques like what-if scenario analysis, simulation, and resource leveling to balance workloads. Common schedule formats include network diagrams, Gantt charts, and milestones.
“Application of the Program Evaluation Review and TechniquePantho Sarker
The document provides an overview of the Program Evaluation and Review Technique (PERT). It discusses the origin and history of PERT and how it was developed parallel to the Critical Path Method (CPM). The document outlines the key features of PERT, including that it uses three time estimates (optimistic, pessimistic, most likely) to calculate the expected time to complete each task. The advantages of PERT are also summarized, such as how it can be used to determine the estimated project completion date and flexibility in a project schedule.
This document discusses several project scheduling and management techniques including Gantt charts, PERT charts, critical path method, critical chain scheduling, and using project management software. It provides descriptions and examples of each technique. Gantt charts track task progress visually on a timeline. PERT uses statistical analysis to estimate activity durations. Critical path method identifies the longest sequence of tasks. Critical chain scheduling accounts for limited resources by removing buffers and adding buffers to the project schedule. Project management software can help facilitate communications and schedule analysis if used properly.
1. The document discusses various ways to manage resource assignments and costs in Microsoft Project, including delaying resource start times, applying work contours, setting different cost rates, and assigning material resources.
2. It provides exercises for applying predefined contours to assignments, manually editing assignment values, changing cost rate tables, and addressing overallocation through reassignment.
3. The summary examines resource availability, scheduling unassigned tasks, and addressing overallocation issues visible in the timeline view.
This document provides instructions for using Microsoft Project to view resource allocations, costs, and scheduling details. It describes how to use the Resource Usage view to identify and resolve overallocated resources by editing assignments. It also explains how to level resources to resolve overallocations, potentially adjusting start dates or splitting work. Finally, it outlines how to view overall project costs, task costs, and the project's finish date using various views and the project properties dialog box.
Ash Samadi company in Australia, Samadi Group share market knowledge in the areas of leasing, property management, land development, commercial area estate brokerage, acquisition, commercial lending and other areas of commercial real estate, providing a one-stop shop for clients across the country. Our proven track record and expertise exemplifies our commitment to providing the best in quality and value to our clients, tenants and investors.
12 Tracking Progress on Tasks and AssignmentsSoe Naing Win
The document discusses updating baselines in Microsoft Project. It provides instructions on updating a baseline for the entire project or selected tasks. The exercises describe entering actual work values at the task and assignment level for specific time periods, and rescheduling uncompleted work for a task after a delay.
This document discusses resource allocation for projects. It defines resource allocation as assigning available resources in the most effective and economical manner to balance competing demands. The critical path method is described as a way to calculate crash durations to expedite projects by spending more on resources. Resource leveling is discussed as a way to smooth resource usage over time to avoid overallocation. Finally, priority rules and software can be used to allocate scarce resources between multiple projects.
This document outlines 9 activities related to tracking progress and monitoring productivity in an agile software development project: 1) Team members log remaining work hours for in-progress tasks daily. 2) Team members enter hours worked for in-progress tasks daily. 3) The team updates the work status of sprint tasks, tests and stories daily during scrums. 4) The team estimates story points for all backlog items at release planning. 5) The team establishes a velocity baseline before each sprint planning. 6) Team members share and update their sprint capacity. 7) A project start date is set. 8) A consistent sprint length is established. 9) Impediment cycle times are monitored.
The document provides an agenda for a 1-day introduction to IFR project management requirements course. The agenda covers project planning, scheduling, reporting tools and includes exercises for developing a project plan and Gantt chart. It also defines key project management terms and concepts like projects, work breakdown structure, milestones and tasks. Sample project charter, assumptions, and objectives are provided.
This document discusses Planning and Control Programme Evaluation and Review Technique (PERT). It defines PERT as a method to analyze the time required to complete a project using a graphical representation called a PERT chart. A PERT chart shows the sequence of activities, with circles marking the start and end of tasks (nodes) and arrows marking the tasks. It also discusses the components of a PERT model including predecessor/successor events, optimistic/pessimistic/likely durations, expected time, slack, and the critical path. The document outlines the steps to PERT planning and benefits like determining the completion date and identifying the critical path, as well as limitations such as the need for time estimates.
NCV 4 Project Management Hands-On Support Slide Show - Module 3Future Managers
This slide show complements the Learner Guide NCV 4 Project Management Hands-On Training by Bert Eksteen, published by Future Managers. For more information visit our website www.futuremanagers.net
Tools for project management is described some of the commonly used tools such as gantt chart, pert chart, logic network, product breakdown structure, work breakdown structure is defined briefly.
This document discusses project management techniques including CPM, PERT, and Gantt charts. It defines CPM and PERT, describing how CPM uses deterministic activity times while PERT uses probabilistic times. It explains the process for each including constructing network diagrams and determining critical paths. Benefits are outlined such as providing completion dates and critical activities. Limitations include difficulty estimating times and costs accurately. Gantt charts are defined as horizontal bar charts showing work periods. Their process, model, advantages and disadvantages are outlined.
The ninth lesson of the course on Planning and Managing Software projects (http://emanueledellavalle.org/Teaching/PMSP-2011-12.html) that I give at Politecnico di Milano
This document discusses Gantt charts and PERT charts, which are project management tools used to organize tasks, resources, and timelines. It provides information on how to create a basic Gantt chart by listing tasks, durations, and dependencies. PERT charts take a similar approach but use nodes and arrows to represent tasks and dependencies. The document also discusses key terms like critical path, slack time, and dummy tasks. It provides examples of using Gantt and PERT charts to plan a construction project and family routine. Overall, the document introduces the basic concepts and components of Gantt and PERT charts for project scheduling and management.
Time management in project management involves planning the total time spent on a project, monitoring progress, and controlling project tasks and activities. There are seven key processes: 1) planning the project schedule, 2) identifying activities, 3) sequencing activities, 4) estimating resources, 5) estimating activity times, 6) developing the project schedule, and 7) monitoring and controlling the schedule. Critical techniques include using a critical path method to identify critical activities, schedule compression to shorten timelines, and resource leveling to optimize resource allocation. Good time management practices include planning work in advance, setting priorities, focusing on one task at a time, minimizing interruptions on critical tasks, planning to complete tasks early, delegating tasks, learning to say no
This Project Management Presentation was made for the Ateneo Graduate School of Business (AGSB) Middle Managers Operations Management Class, Semester 1 of 2011.
The document discusses project management techniques presented by Brian Pichman. It covers defining a project and key terms, estimating timelines, using tools like Slack, Google Drive and Trello for collaboration, creating Gantt charts and dashboards to track progress, and ensuring clear expectations and communications during the project. It emphasizes accurate planning and scoping to reduce stress and having contingencies like a Plan B in case issues arise.
Wrap up the rest of the year with smoother well-defined projects and a toolbox of skills and resources to help you organize and bring projects to life. Whenever you are putting a project together, it is essential to keep timelines in check, follow up, and watch out for scope creep. In this webinar, Brian Pichman will discuss different project management techniques and tools to help you not only have a successful project but more importantly, a well defined and detailed project launch. By having a solid foundation and a few easy-to-use tools, you can significantly reduce that project management stress and be more excited for the next project you tackle!
Start the new decade off, with help creating a toolbox of skills and resources to help you organize and bring projects to life.
Whenever you are putting a project together, it is essential to keep timelines in check, follow up, and watch out for scope creep. In this webinar, Brian Pichman will discuss different project management techniques and certifications to help you not only have a successful project but more importantly, a well defined and detailed project launch.
By having a solid foundation and a few easy-to-use tools, you can significantly reduce that project management stress and be more excited for the next project you tackle!
This document summarizes key concepts around resource allocation and scheduling projects. It discusses allocating human and technical resources to individual or multiple simultaneous projects. The critical path method and crashing projects to expedite them is covered, noting that faster completion incurs higher costs. Crashing changes the schedule and budget for all activities. Resource allocation problems arise from considering both time and resource availability constraints. The resource allocation problem, time vs resource limitations, and resource loading are defined to understand resource demands on a firm. Leveling resources can shift activity timing to smooth resource usage over a project's duration.
The document discusses project management. It defines a project as a series of related tasks focused on completing an overall objective. Project management involves planning, directing, and controlling resources to meet technical, cost, and time constraints. The stages of the project life cycle are identified as initiation, planning, execution, monitoring and control, and closure. Project management software supports projects through task scheduling, resource allocation, communication, and tracking progress. Gantt charts, PERT charts, and critical path analysis are tools and techniques used for project management tasks.
component 5 project planning, monitoring and evaluation.pdfAnatole9
The document discusses various aspects of project planning, monitoring, and evaluation including:
1. Creating a project schedule by defining activities, understanding sequence, estimating resources and durations, and developing the schedule.
2. Developing the project budget by creating a cost management plan, estimating costs of resources for each activity, and establishing a cost baseline.
3. Implementing the project by monitoring and controlling the five parameters of time, money, quality, organization, and information according to the project plan, and reporting on progress and completion.
A brief introduction of Project Time Management, covering the main concepts like Activities, Project Schedule, Activity dependencies, Critical Path, Lead and Lags etc.
The document discusses project time management processes including:
1. Defining activities by decomposing work packages and identifying specific tasks.
2. Sequencing activities by determining dependencies between tasks using precedence diagramming.
3. Developing schedule attributes like activity lists, relationships, and milestones to build the project schedule network diagram.
This document discusses project scheduling concepts like PERT and CPM. It defines a project and provides examples. It explains key aspects of project scheduling including network analysis, determining critical paths, calculating floats, and allocating resources. It also discusses constructing PERT/CPM networks and numbering events. It covers procedures for determining earliest and latest times, float/slack times, and identifying the critical path. The document is an overview of fundamental concepts for project scheduling and critical path analysis.
1. The document discusses several project management techniques including PERT (Program Evaluation and Review Technique), Gantt charts, and Management by Objectives (MBO).
2. PERT involves identifying activities, determining sequences, estimating times, and identifying critical paths to manage projects. Gantt charts use horizontal bars to visualize task relationships and allocate resources over time.
3. MBO involves setting objectives collaboratively, periodic reviews, and integrating individual goals with organizational goals. These techniques aim to effectively plan, monitor, and control projects.
The document provides an overview of project time management processes according to the Project Management Body of Knowledge (PMBOK). It discusses the key processes including (1) defining activities, (2) sequencing activities, (3) estimating activity resources, (4) estimating activity durations, (5) developing the project schedule, and (6) controlling the project schedule. For each process, it describes the inputs, tools and techniques, and outputs involved in planning, monitoring, and managing the timely completion of project activities and the overall project schedule.
Project scheduling involves defining tasks, estimating durations, determining dependencies, assigning resources, and communicating a timeline. The key steps are to create a work breakdown structure, estimate activity times using techniques like three-point estimating, determine relationships between tasks, and finalize the schedule by allocating resources. Project schedules can be modeled and optimized using techniques like what-if analysis, simulation, and resource leveling to balance workloads. Common schedule formats include network diagrams, Gantt charts, and milestones.
1. The document discusses managing projects through tracking progress, maintaining control, and establishing project management information systems. It covers monitoring schedules, work efforts, expenditures, and implementing control processes.
2. It also discusses providing effective leadership through clarifying the differences between leadership and management, understanding why people do tasks, and encouraging motivation and persistence on projects.
3. The project communications management plan specifies communications for target audiences regarding information needs, sharing activities, content, and frequency to encourage project success.
The Work Breakdown Structure (WBS) is a key project management tool used to define and group the total scope of work to be performed by the project team. It provides a common understanding of the project and can be used for planning, estimating costs and schedules, tracking progress, and assigning responsibilities. The WBS breaks down the project into smaller, more manageable components, typically in a hierarchical structure with up to six levels of detail. It helps ensure all required work is defined and accounted for and provides a framework for managing the project.
This document discusses the six key processes involved in project time management: define activities, sequence activities, estimate activity resources, estimate activity duration, develop schedule, and control schedule. For each process, it identifies the typical inputs, tools and techniques, and outputs. The main goal of project time management is to ensure timely completion of the project through planning, monitoring, and controlling the schedule.
This document discusses teaching mixed ability classes. It notes that mixed ability classes can present problems for teachers as students have differing levels. Some challenges include providing learning for all students, managing pacing, and designing assessments. However, there are also advantages such as developing tolerance and cooperation. The document recommends strategies for teaching mixed ability classes like differentiated instruction, grouping students by ability, and allowing peer learning. The conclusion states that mixed ability classes challenge teachers to understand diverse student needs, but various grouping strategies and open discussion can help address difficulties.
Foro english socioeducational project #2Lorena Tapia
Este manual proporciona orientación para la implementación y evaluación de los estándares de calidad educativa en Ecuador. Explica que los estándares describen los logros esperados de los actores e instituciones educativas y cómo están estructurados en dimensiones, componentes, estándares e indicadores. Además, guía a la comunidad educativa en la realización de autoevaluaciones institucionales para identificar áreas de mejora basadas en el cumplimiento de los estándares.
Total quality management english socioeducational projectLorena Tapia
This document provides an overview of 16 lessons on quality management. It discusses key concepts like quality definitions, competitive advantage, quality philosophies from Deming, Juran and Crosby. It also covers topics like ISO 9000 standards, total quality management principles and evolution, contributions to TQM, Just-in-Time manufacturing, seven quality tools and techniques, measurement and analytical tools, improvement tools like quality circles, and control tools like Gantt charts. The document serves as a guide for teaching quality management concepts across multiple lessons.
Este documento describe un proyecto llamado "El Festival del Reciclaje" que tiene como objetivo enseñar a los niños en edad preescolar sobre la importancia del reciclaje y la conservación del medio ambiente. El proyecto utilizará actividades lúdicas y manualidades con materiales reciclados para crear conciencia ambiental en los estudiantes y la comunidad educativa. El resultado final será una exhibición del trabajo de los niños con materiales reciclados llamada "El Festival del Reciclaje".
Las fases-de-un-proyecto-y-sus-relaciones (1)Lorena Tapia
Este documento describe las fases de un proyecto, sus relaciones y tipos de ciclos de vida. Explica que un proyecto puede dividirse en fases, cada una enfocada en un entregable específico. Las fases pueden tener relaciones secuenciales o de superposición. También describe los ciclos de vida predictivos, iterativos e incrementales, y adaptativos.
Learning activity 1.4 english teaching practicumLorena Tapia
This document summarizes theories of how humans learn languages. It discusses behaviorist theories from Pavlov and Skinner, cognitive theories from Ausubel about meaningful vs rote learning, and constructivist theories from Rogers about empowering learners. It also outlines eight types of language learning, including signal, stimulus-response, and concept learning. Factors like transfer, interference, overgeneralization, inductive/deductive reasoning, aptitude, intelligence and methods like audiolingualism and total physical response are summarized in relation to second language acquisition. The conclusion states that comprehensible input at the right level is key to language learning.
Learning activity 2.3 theory and practice of translationLorena Tapia
This document discusses different types of neologisms, or new words, and considerations for their translation. It identifies several categories of neologisms including derived words formed from ancient Greek and Latin morphemes, abbreviations, collocations, eponyms derived from proper names, phrasal words in English, transferred words common across languages, acronyms, and pseudoneologisms where a generic word stands in for a specific one. For each type of neologism, issues relevant to their translation are outlined, such as whether an equivalent word already exists in the target language or if a descriptive term would be better.
Forum theory and practice of translationLorena Tapia
This document discusses the role of culture in translation. It notes that language and culture are deeply intertwined, as language expresses the culture of its speakers. When translating between languages, the cultures of both languages influence the translation process. Culture is manifested in vocabulary items that are specific to a given culture, as well as concepts expressed in culture-specific ways. The document defines translation and culture, examines culture-specific items that pose challenges in translation, and reviews strategies for translating these items such as repetition, synonymy, universalization, deletion, and creation of new terms.
Presentacion.sobre exponga el perfil personal y profesional de un docente de ...Lorena Tapia
Un docente de educación ambiental es un profesional de las ciencias de la educación especializado en la conservación del medio ambiente. Debe poseer características de liderazgo, facilidad de comunicación y amor por la naturaleza, además de sensibilidad hacia los problemas ambientales. Profesionalmente, se requiere preparación en temas ambientales, habilidad para guiar a los estudiantes hacia la conservación del medio ambiente, y dominio de los principios relacionados con el medio ambiente.
Presentacion del perfil del estudianteLorena Tapia
El perfil del estudiante destaca su capacidad para analizar e interpretar problemas ambientales, ser sensible a dichos problemas, tener la predisposición de cambiar la realidad ambiental a través de sus acciones, y participar de manera entusiasta en actividades relacionadas con la conservación.
La eutrofización es una forma de contaminación química de aguas causada por un exceso de nutrientes como fósforo y nitrógeno en un ecosistema acuático. Puede ocurrir de forma natural pero la eutrofización antropogénica, causada por vertidos industriales, agrícolas y urbanos, fertilizantes y aguas residuales, es la más preocupante. Los nutrientes que más contribuyen son los fosfatos y nitratos, siendo el fósforo el factor limitante más común en lagos de agua
This document summarizes and compares two approaches to school improvement: the external research and development (R&D) approach and the school-based, faculty-centered approach. It outlines the key characteristics of each, including that the R&D approach involves experts designing programs that are field tested, while the school-based approach involves shared decision making at the school level. Both approaches can be effective if they focus on student benefits, use an inquiry process, involve staff and the community, and provide support for implementation. Common mistakes occur when advocates believe a single strategy will surely work without ongoing modification based on evaluation data.
Colaborative work entrepreneur developmentLorena Tapia
This document outlines the marketing plan for a business that trains stray dogs to assist people with disabilities. It discusses developing a marketing plan, producing advertising materials, preparing a sales approach, and describing the advantages of the business location. The marketing plan targets people with disabilities and aims to promote the services of providing trained dogs through advertising and an empathetic sales approach. The business is located in a central, safe area near a hospital with lots of foot traffic.
This document discusses key aspects of second language acquisition from linguistic, psychological, and social perspectives. It addresses what L2 learners come to know, including patterns of language as well as pragmatic competence. The document also discusses how L2 knowledge is acquired through innate capacity, interaction, and automatization. Finally, it examines why some learners are more successful based on factors like social context, age, aptitude, and motivation, and provides implications for L2 learning and teaching.
Este documento describe un proyecto para estudiar la creación de una empresa de seguridad en la ciudad de Latacunga, Ecuador. El proyecto busca conocer los requisitos para establecer una empresa de seguridad, incluyendo la legislación aplicable y los recursos necesarios. El estudio recolectará información sobre los pasos para crear legalmente una empresa de seguridad y evaluará qué tan difícil es este proceso en Ecuador.
This document discusses the psychology of second language acquisition. It covers topics like how the brain processes language, learning theories, individual differences in learners, and the effects of multilingualism. Key points include:
- The left brain hemisphere processes logic/speech while the right processes creativity. Areas like Broca's, Wernicke's, and the visual/auditory cortices are involved in language.
- Learning theories include information processing, connectionism, and theories on the order of acquisition.
- Individual differences that impact success include age, sex, aptitude, motivation, cognitive style, personality, and learning strategies.
- Multilingualism has benefits like enhanced cognitive functions and allows people to experience the world
English methodology.activity2.1 lorena pruna tapiaLorena Tapia
This document discusses analyzing patterns of classroom interaction in EFL classrooms. It aims to provide a detailed linguistic description of the patterns of interaction between teachers and students in Iranian EFL classrooms. Specifically, it will examine whether interactions are teacher-dominated or student-dominated, and how patterns are affected by the gender of teachers and students. The method involves collecting classroom interaction data and analyzing it using a discourse analysis approach to identify different types of talk between teachers and students.
The document discusses the role and responsibilities of an ESP (English for Specific Purposes) teacher. An ESP teacher must gather information about their students' strengths and weaknesses. They must also be able to adapt teaching materials to suit their students' specific needs and the requirements of their institution. An effective ESP teacher should have the ability to teach different professional fields without extensive preparation time. They must remain up-to-date on the latest research in ESP fields and select appropriate teaching methodologies that involve a variety of classroom activities.
This document discusses semantics and vocabulary teaching. It presents a three-stage model of adult second language vocabulary acquisition: 1) a word association stage where learners recognize words through their native language translation, 2) a native language mediation stage where words are integrated with some native language influence, and 3) a full integration stage where words are autonomous from the native language. The document reports on a study that investigated the effect of semantic mapping as an instructional strategy and found that reaction times in semantic judgments were affected by the degree of semantic overlap between words. It concludes that vocabulary acquisition requires active participation from students and teaching words in context rather than in isolation.
Beyond Degrees - Empowering the Workforce in the Context of Skills-First.pptxEduSkills OECD
Iván Bornacelly, Policy Analyst at the OECD Centre for Skills, OECD, presents at the webinar 'Tackling job market gaps with a skills-first approach' on 12 June 2024
How to Make a Field Mandatory in Odoo 17Celine George
In Odoo, making a field required can be done through both Python code and XML views. When you set the required attribute to True in Python code, it makes the field required across all views where it's used. Conversely, when you set the required attribute in XML views, it makes the field required only in the context of that particular view.
Main Java[All of the Base Concepts}.docxadhitya5119
This is part 1 of my Java Learning Journey. This Contains Custom methods, classes, constructors, packages, multithreading , try- catch block, finally block and more.
it describes the bony anatomy including the femoral head , acetabulum, labrum . also discusses the capsule , ligaments . muscle that act on the hip joint and the range of motion are outlined. factors affecting hip joint stability and weight transmission through the joint are summarized.
This document provides an overview of wound healing, its functions, stages, mechanisms, factors affecting it, and complications.
A wound is a break in the integrity of the skin or tissues, which may be associated with disruption of the structure and function.
Healing is the body’s response to injury in an attempt to restore normal structure and functions.
Healing can occur in two ways: Regeneration and Repair
There are 4 phases of wound healing: hemostasis, inflammation, proliferation, and remodeling. This document also describes the mechanism of wound healing. Factors that affect healing include infection, uncontrolled diabetes, poor nutrition, age, anemia, the presence of foreign bodies, etc.
Complications of wound healing like infection, hyperpigmentation of scar, contractures, and keloid formation.
Gender and Mental Health - Counselling and Family Therapy Applications and In...PsychoTech Services
A proprietary approach developed by bringing together the best of learning theories from Psychology, design principles from the world of visualization, and pedagogical methods from over a decade of training experience, that enables you to: Learn better, faster!
How to Create a More Engaging and Human Online Learning Experience
Foro #1 integrative project lll
1. INTEGRATIVE PROJECT lll
Part II: Planning Time:
Determining When and
How Much
INTEGRANTS: Fabiola Carvajal Cajas
Lorena Pruna Tapia
TEACHER: Msc. Miguel Ponce
2. You Want This Project
Done When?
Illustrating a Work Plan with a Network Diagram
Sequence: The order in which you perform the activities
Duration: How long each individual activity takes
Is important
Defining a network diagram’s elements
• A network diagram is a flowchart that illustrates the order in which
you perform project activities.
• Milestone is a significant occurrence in the life of a project.
• Activity is a component of work performed during the course of a
project.
• Duration is the total number of work periods it takes to complete an
activity.
Drawing a network diagram
• Boxes: represent activities and milestones.
• Letter t: The letter t represents duration.
• Arrows: Arrows represent the direction work
flows from one activity
3. Analyzing a Network Diagram Helps you plan your project schedule
✓ Determine how long the entire trip will take.
✓ Identify potential difficulties along the way.
✓ Consider alternate routes to get to your final destination more quickly
Reading a network diagram
Rule 1: After you finish an activity or reach a
milestone, you can proceed to the next activity or
milestone
Rule 2: Before you can start an activity or reach a
milestone, you must first complete all activities and
reach all milestones with arrows pointing to the
activity you want to start or milestone you want to
reach.
Interpreting a network diagram
To interprete a diagram you need the next steps:
✓ Critical path: A sequence of activities that takes the longest time to complete
✓ Noncritical path: A sequence of activities in which you can delay activities
✓ Slack time The maximum amount of time you can delay an activity
✓ Earliest start date: The earliest date you can start an activity
✓ Earliest finish date: The earliest date you can finish an activity
✓ Latest start date: The latest date you can start an activity
✓ Latest finish date: The latest date you can finish an activity
Working with Your Project’s Network Diagram
Determining precedence
Finish-to-start: The predecessor must finish before the successor can start.
Finish-to-finish: The predecessor must finish before the successor can finish.
Start-to-start: The predecessor must start before the successor can start.
Start-to-finish: The predecessor must start before the successor can finish.
Using a network diagram to analyze a simple example
Deciding on the activities
Setting the order of the activities
Creating the network diagram
4. Developing Your Project’s Schedule
Taking the first steps
1. Identify immediate predecessors
2. Determine the personnel and no personnel resources
3. Estimate durations for all activities
4. Identify all intermediate and final dates
5. Identify all activities or milestones outside your project
6. Draw your network diagram
7. Analyze your project’s network diagram
Avoiding the pitfall of backing in to your schedule
✓ You may miss activities because your focus is on meeting a
time constraint.
✓ You base your duration estimates on what you can allow
activities to take rather than what they’ll require.
✓ The order for your proposed activities may not be the most
effective one.
Meeting an established time constraint
• Recheck the original duration estimates.
• Consider using more-experienced personnel
• Consider different strategies for performing the activities
• Consider fast tracking
Applying different strategies to arrive at your picnic in less time
• Performing activities at the same time.
• Devising an entirely new strategy.
• Subdividing activities.
Estimating Activity Duration
Determining the underlying factors
• Work performed by people
• Work performed by nonhuman resources
• Physical processes
• Time delays
Considering resource characteristics
• Capacity: Productivity per unit time period.
• Availability: When a resource will be available.
Finding sources of supporting information
• Historical records of how long similar activities have taken in the
past
• People who’ve performed similar activities in the past
• People who’ll be working on the activities
• Experts familiar with the type of activity, even if they haven’t
performed the exact activity before
Improving activity duration estimates
• Define your activities clearly
• Subdivide your activities
• Define activity start and end
• Involve the people who’ll perform an activity
• Minimize the use of fudge factors
5. Displaying Your Project’s Schedule
✓ Milestone list: A table that lists milestones and the
dates you plan to reach them
✓ Activity list: A table that lists activities and the
dates you plan to start and end them
✓ Combined milestone/activity list: A table that
includes milestone and activity dates
✓ Gantt chart: A timeline that illustrates when each
activity starts, how long it continues, and when it
ends
✓ Combined milestone and Gantt chart: A timeline
that illustrates when activities start, how long they
continue, when they end, and when selected
milestones are achieved
6. Establishing Whom You Need,
How Much, and When
Getting the Information You Need to
Match People to Tasks
• Determining the skills and knowledge that each activity requires
• Confirming that the people assigned to those activities possess the required skills and
knowledge and that they’re genuinely interested in working on their assignments
Deciding the skills and knowledge that team members must have
• The required levels of proficiency in the needed
skills and knowledge
• Whether the assignment will entail working under
someone else’s guidance when applying the skills
or knowledge.
Values
1=requires a basic level of proficiency
2 = requires an intermediate level of proficiency
3 = requires an advanced level of proficiency
Representing skills, knowledge, and interests in a Skills Matrix
A Skills Matrix is a table that displays people’s proficiency in specified skills and
knowledge
1. Discuss with each team member his or her skills, knowledge.
2. Determine each person’s level of interest in working on the tasks
3. Consult with team members’ functional managers and/or the people who
assigned them to your project to determine their opinions
4. Check to see whether any areas of your organization have already prepared
Skills Matrices.
5. Incorporate all the information you gather in a Skills Matrix and review it.
7. Estimating Needed Commitment
Using a Human Resources Matrix
Human Resources Matrix depicts the people
assigned to each project activity and the
work effort each person will contribute to
each assignment.
Identifying needed personnel
in a Human Resources Matrix
Skills and knowledge: The specific skills and knowledge that the
person who’ll do the work must have
Position name or title: The job title or the name of the position
of the person who’ll do the work
Name: The name of the person who’ll do the work
Estimating required work effort
• Describe in detail all work related to performing
the activity
• Consider history
• Have the person who’ll actually do the work
participate in estimating the amount of work effort
that will be required
• Consult with experts familiar with the type of work
you need done on your project
Factoring productivity, efficiency, and
availability into work-effort estimates
• Productivity: The results a person produces per
unit of time that he spends on an activity
• Efficiency: The proportion of time a person
spends on project work as opposed to
organizational tasks
• Availability: The portion of time a person is at the
job as opposed to on leave.
Reflecting efficiency when you use
historical data
• Your time sheets have one or more categories to
show time spent on non-project-specific work, and
people accurately report the actual time they spend
on their different activities.
• Your time sheets have no category for recording
time spent on non project-specific work
Accounting for efficiency in personal work-effort estimates
• Define your work packages clearly. Minimize the use of technical jargon, and
describe associated work processes
• Subdivide your work. Do so until you estimate that your lowest-level activities.
• Update work-effort estimates when project personnel or task assignments change.
8. Ensuring Your Project Team Members Can Meet Their
Resource Commitments
Planning your initial allocations
Begin planning out your workload by
developing
A Human Resources Matrix is a bar graph
that depicts the level of work effort you’ll
spend each day, week, or month on an
activity.
A Person-Loading Graph presents the
same information in a table
Resolving potential resource overloads
• Allocate your time unevenly over the duration of one or more
activities.
• Take advantage of any slack time that may exist in your
assigned activities.
• Assign some of the work you were planning.
Coordinating assignments across multiple projects
If Summary Person-Loading Charts are available for each project your people
are assigned to, you can manage each person’s overall resource commitments
by combining the information from the projects’ Summary Person-Loading
Charts into an Overall Summary Person-Loading Chart.
9. Determining Nonpersonnel
Resources Needs
Ensuring that nonpersonnel resources are available when
needed requires that specify the times that the plan to use
them. It can display this information in separate usage charts
for each resource.
An example of a computer usage chart:
As part of a plan, develop the following:
Nonpersonnel resources matrix
Nonpersonnel usage charts
A nonpersonnel summary usage chart
A nonpersonnel resources matrix displays the following information for
every lowest-level component (or work package) in the project Work
Breakdown Structure.
The nonpersonnel resources needed to perform the activities that
comprise the work package
Ex. Illustration of a nonpersonnel resources matrix
PLANNING FOR OTHER
RESOURCES AND
DEVELOPING THE BUDGET
10. Finally, the display of total amount of each nonpersonnel resource that require during each week of the project in a nonpersonnel
summary usage chart.
An example of a nonpersonnel summary usage chart.
Making Sense of the Dollars:
Project Costs and Budgets
Estimating a project’s costs is important for several reasons:
• It enables to weigh anticipated benefits against anticipated costs to see whether the project makes sense.
• It allows to see whether the necessary funds are available to support the project.
• It serves as a guideline to help ensure that have sufficient funds to complete the project.
11. Looking at different types of project costs
Direct costs include the following:
• Salaries for team members on the project
• Specific materials, supplies, and equipment for the project
• Travel to perform work on the project
• Subcontracts that provide support exclusively to the project
Planning for Other Resources and Developing the Budget
• Indirect costs are costs for resources that support more than
one project but aren’t readily identifiable with or chargeable
to any of the projects individually. Indirect costs fall into the
following two categories:
• Overhead costs: Costs for products and services for the
project that are difficult to subdivide and allocate directly.
• General and administrative costs: Expenditures that keep the
organization operational
Direct costs for this project may include the following:
• Labor: Salaries for the and other team members for the
hours to work on the brochure
• Materials: The special paper stock for the brochure
• Travel: The costs for driving to investigate firms that may
design the brochure cover
• Subcontract: The services of an outside company to
design the cover art Indirect costs for this project may
include the following:
o Employee benefits: Benefits (such as annual, sick, and
holiday leave; health and life insurance; and retirement
plan contributions)
o Rent: The cost of the office space that use when is
developing the copy for the brochure
o Equipment: The computer to use to compose the copy
for the brochure
o Management and administrative salaries: A portion of
the salaries of upper managers and staff who perform
the administrative duties necessary to keep the
organization functioning.
12. Recognizing the three stages
of a project budget
- Rough order-of-magnitude estimate: This
stage is an initial estimate of costs based on a
general sense of the project work.
- Detailed budget estimate: This stage entails
itemization of the estimated costs for each
project activity
- Completed, approved project budget: This
final stage is a detailed project budget that
essential people approve and agree to
Venturing into the
Unknown: Dealing with
Risk and Uncertainty
Defining Risk and Risk Management
Risk is the possibility that may not achieve the product, schedule, or resource targets
because something unexpected occurs or something planned doesn’t occur. All projects
have some degree of risk because predicting the future with certainty is impossible.
However, project risk is greater
The longer the project lasts
The longer the time is between preparing the project plan and starting the work
The less experience, the organization, or the team members have with similar projects
The newer project’s technology is asserts that risk can be either negative or positive:
o Negative risks, also referred to as threats, potentially have a detrimental effect on one
or more of the project objectives, such as causing to miss a deadline.
o Positive risks, also referred to as opportunities, potentially have a beneficial effect on
project objectives, such as allowing to complete a task with fewer personnel than the
originally planned.
13. So how can you address your project’s risks?
Take the following steps to determine, evaluate, and manage the risks that may affect the
project:
1. Identify risks. Determine which aspects of the plan or project environment may change.
2. Assess the potential effects of those risks on the project. Consider what can happen if those
aspects don’t work out the way the envision.
3. Develop plans for mitigating the effects of the risks. Decide how it can protect the project
from the consequences of risks.
4. Monitor the status of the project’s risks throughout performance. Determine whether existing
risks are still present, whether the likelihood of these risks is increasing or decreasing, and
whether new risks are arising.
5. Inform key audiences of all risks involved with the project. Explain the status and potential
effect of all project risks — from the initial concept to the project’s completion.
Focusing on Risk Factors
and Risks
Recognizing risk factors
A risk factor is a situation that may give rise
to one or more project risks. A risk factor
itself doesn’t cause to miss a product,
schedule, or resource target. However, it
increases the chances that something may
happen that will cause to miss one.
All projects progress through the following
four life cycle stages, and each stage can
present new risk factors for the project:
Starting the project
Organizing and preparing
Carrying out the work
Closing the project
14. To identify specific potential risks for each risk factor, do
the following:
Review past records of problems encountered in similar
situations. If a risk factor actually resulted in an unexpected
occurrence in the past, it is definitely want to be prepared
for it this time.
- Brainstorm with experts and other people who have
related experiences.
- Be specific. The more specifically describe a risk, the
better it can assess its potential effect.
- Nonspecific: Activities may be delayed.
- Specific: Delivery may take three weeks rather than two.
- It is necessary try to eliminate potential risk factors as
soon as possible.
Identifying risks
After recognize the project’s risk factors, the next step
in the risk assessment is to identify the specific risks that
may result from each of the risk factors:
- Product risk: The technology may not produce the
desired results.
- Schedule risk: Tasks using the new technology may
take longer than the anticipate.
- Resource risk: Existing facilities and equipment may
not be adequate to support the use of the new
technology.
15. Assessing Risks: Probability and
Consequences
Probability of occurrence: It can express the likelihood that a risk
will occur as probability.
Category ranking: Classify risks into categories that represent
their likelihood. It may use high, medium, and low, or always,
often, sometimes, rarely, and never.
Ordinal ranking: Order the risks so the first is the most likely to
occur, the second is the next most likely, and so on.
Relative likelihood of occurrence: If it have two possible risks, it
can express how much more likely one is to occur than the
other.
When using objective information, such as past project reports,
to determine the likelihood of different risks:
Consider previous experience with similar projects.
Consider as many similar situations as possible.
Developing a risk-management strategy
Avoidance: Act to eliminate the risk factor that gave rise to the risk.
Transfer: Pay someone else to assume some or all of the effect of
the risk.
Mitigation: Either reduce the likelihood that a risk occurs, or
minimize the negative consequences if it does occur.
Communicating about risks
Starting the project: To support the process of deciding whether or
not to undertake the project
Organizing and preparing: To guide the development of all aspects
of the project plan
Carrying out the work
Preparing a Risk-Management Plan
Include the following in your risk-management plan:
Risk factors
Associated risks
The assessment of the likelihood of occurrence and the
consequences for each risk
The plan for managing selected risks
The plan for keeping people informed about those risks
throughout your project