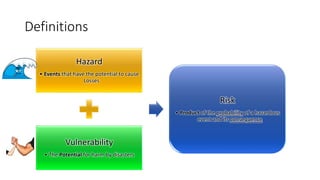
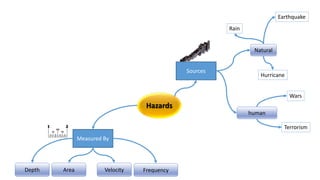
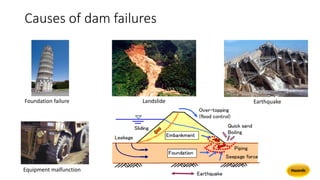
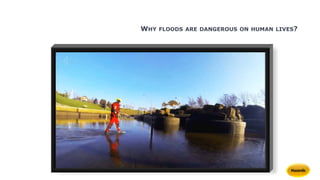
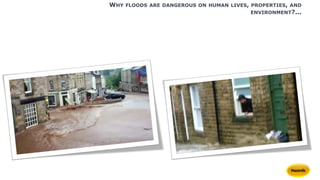
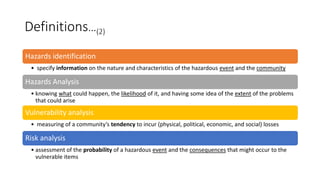
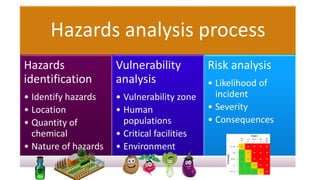
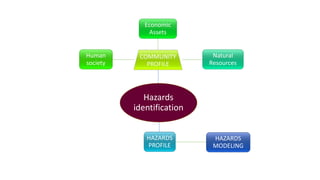
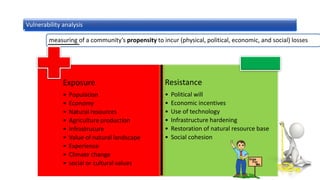
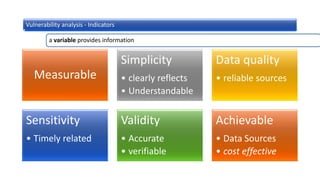
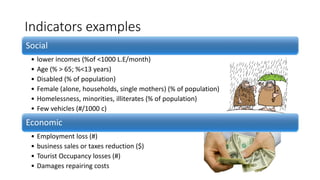
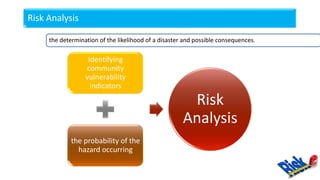
Water Resources Research Institute
email: wrri@wrri.org.eg
Web: www.wrri.org.eg
Eng. Ahmed Adel Saleh
email: norahmed1@gmail.com
F.B. | https://www.facebook.com/ahmed.a.saleh.965
CONTENTS
01
Introduction
Risk analysis process
02
Examples
03
Ending
04
01
Introduction
Definitions
Hazard
• Events that have the potential to cause
Losses
Vulnerability
• The Potential for harm by disasters
Risk
• Product of the probability of a hazardous
event and its consequence
Hazards
Sources
Natural
human
Measured By
Rain
Hurricane
Earthquake
Wars
Terrorism
Velocity FrequencyDepth Area
Causes of dam failures
EarthquakeLandslideFoundation failure
Equipment malfunction
WHY FLOODS ARE DANGEROUS ON HUMAN LIVES?
WHY FLOODS ARE DANGEROUS ON HUMAN LIVES, PROPERTIES, AND
ENVIRONMENT?...
WHY FLOODS ARE DANGEROUS ON HUMAN LIVES, PROPERTIES, AND
ENVIRONMENT?...
WHY FLOODS ARE DANGEROUS ON HUMAN LIVES, PROPERTIES, AND
ENVIRONMENT?...
WHY FLOODS ARE DANGEROUS ON HUMAN LIVES, PROPERTIES, AND
ENVIRONMENT?...
Vulnerability
Dimensions
Social
Economical
Ecological
Levels of coping
Individual
/personal
Community Regional
Administrative/
institutional
Structural
Losses
Interruption of business
Death
Injuries
Property damage
Agricultural losses
Age
Dependency on the government
Experience
Education
access to transportation
degree of home ownership or renters
special needs
Social dimension
Types of buildings (residential, commercial, industrial, etc.)
Infrastructures and critical sites ( schools, hospitals, emergency
services, etc.)
local building codes, zoning regulations, flood control programs
and structures, etc.)
Urbanization ongoing expansion
Economic Activities (Unemployment, taxes, etc.)
Structural & Economic dimension
Availability of fresh water resources
Climate Change impact of flood frequency
Rare species, Nature reserves, etc.
Environmental or Natural
Definitions…(2)
Hazards identification
• specify information on the nature and characteristics of the hazardous event and the community
Hazards Analysis
• knowing what could happen, the likelihood of it, and having some idea of the extent of the problems
that could arise
Vulnerability analysis
• measuring of a community’s tendency to incur (physical, political, economic, and social) losses
Risk analysis
• assessment of the probability of a hazardous event and the consequences that might occur to the
vulnerable items
Definitions…(3)
 RISK/RELIABILITY-BASED ENGINEERING DESIGN
Cost of
protection
Losses of
damages
Appropriate level of
protection
Risk analysis process
02
CONTENTS
 Risk analysis process
 Risk Matrix
 Hazard-vulnerability function
 Applications
 Conclusions and recommendations
Where flood risk analysis is necessary?
 Historical information (human memory,
chronicles etc.)
 Meteorological and hydrological data
 Analysis of potential breakdowns of hydro-
technological sites
Watershed’s outlet
Hazards analysis process
Hazards
identification
• Identify hazards
• Location
• Quantity of
chemical
• Nature of hazards
Vulnerability
analysis
• Vulnerability zone
• Human
populations
• Critical facilities
• Environment
Risk analysis
• Likelihood of
incident
• Severity
• Consequences
Hazards
identification
COMMUNITY
PROFILE
Human
society
Economic
Assets
Natural
Resources
HAZARDS
PROFILE
HAZARDS
MODELING
HAZARDS MODELING
HAZARDS PROFILE
measuring of a community’s propensity to incur (physical, political, economic, and social) losses
Exposure
• Population
• Economy
• Natural resources
• Agriculture production
• Infrastrucure
• Value of natural landscape
• Experience
• Climate change
• social or cultural values
Resistance
• Political will
• Economic incentives
• Use of technology
• Infrastructure hardening
• Restoration of natural resource base
• Social cohesion
Vulnerability analysis
a variable provides information
Vulnerability analysis - Indicators
Measurable
Simplicity
• clearly reflects
• Understandable
Data quality
• reliable sources
Sensitivity
• Timely related
Validity
• Accurate
• verifiable
Achievable
• Data Sources
• cost effective
Indicators examples
Social
• lower incomes (%of <1000 L.E/month)
• Age (% > 65; %<13 years)
• Disabled (% of population)
• Female (alone, households, single mothers) (% of population)
• Homelessness, minorities, illiterates (% of population)
• Few vehicles (#/1000 c)
Economic
• Employment loss (#)
• business sales or taxes reduction ($)
• Tourist Occupancy losses (#)
• Damages repairing costs
the determination of the likelihood of a disaster and possible consequences.
Identifying
community
vulnerability
indicators
the probability of the
hazard occurring
Risk
Analysis
Risk Analysis
Significant None
Minor
First aid or minor medical treatment,
little or no impact to the community
Moderate
Minor injuries, lost workday accident,
minor system damage, minor property damage, and
some community disruption
Major
Permanent partial disability,
temporary disability in excess of 3 months,
major or significant property damage,
Significant disruption
Catastrophic
Death or permanent and total disability,
Major or significant property damage,
failure or complete community trouble
Chance of occurring in a given
year
Certain >99%
Likely 50%–99%
Possible 5%–49%
Unlikely 2%–5%
Rare 1%–2%
Extremely rare <1%
Risk Analysis
ACTION
NECESSARY
Risk Analysis
Risk Matrix
Hazard-vulnerability functions (example)
Hazard-vulnerability function
Damage Hazard information Vulnerability
Building content Flood depth (and duration) Financial
Building construction Flood velocity (and duration) Building resistance
Human beings Flood depth and Flood velocity Human physical resistance
Vehicle Flood depth and Flood velocity Vehicle resistance
Human body health Contaminations Human body resistance
Examples
03
Crops’ flood hazard mapping - Bangladesh
Frequency
analysis
water level
DEM
Flood Depth
Crops maps
Flood Hazard
Maps
satellite
images
Landuse map
Land cover
map
Vulnerability
Hazard
damage
functions
Cost
Estimation
 Estimation of probable
maximum flood
 Development of Dam break
simulation model using MIKE 11
 Flood hazard assessment
Assessing flooding hazards on a proposed
industrial plant/site is northern India
the Flood Protection of the City of Dahab
Experiments to test mathematical models
results
Testa, G., et all, 2007. Flash flood flow experiment in a simplified urban district. J. Hydraul. Res. 45, 37–44
Bending moments Shear forces
Simulating flood risk vulnerability of buildings
Mazzorana, B., 2014. A physical approach on flood risk vulnerability of buildings. Hydrol. Earth Syst. Sci.
Developing new criterion for the stability of a
human body in flood waters
Xia, J., et all., 2014. New criterion for the stability of a human body in floodwaters. J. Hydraul. Res. 52, 93–104
Better estimation of risk and damages
Yamaguchi, Satoshi, et al. "Development of GIS-based flood-simulation software and application to flood-risk assessment."
Second IMA International Conference on Flood Risk Assessment. 2007.
Ending
04
Conclusions
 Hazards analysis is not an isolated process but ongoing one that
engages the local community.
 Risk communication, citizen participation, risk management, and
ongoing assessment are all parts of comprehensive emergency
management.
Recommendations
 Data collecting (surveys, questioners,
 Develop risk assessment models.
 Develop Evacuation plans
 Develop Community Resilience plans
 Provide Risks Communicating tools
References
 Pine, J., 2015. Hazards analysis : reducing the impact of disasters.
 Joern, Birkmann. Measuring vulnerability to natural hazards: towards
disaster resilient societies. United Nations University Press, 2006.
 Natale, E., 2009. Dam Break Risk Assessment in Baker Valley (Chilean
Patagonia).
 Voortman, H. G., Van Gelder, P. H. A. J. M., & Vrijling, J. K. (2002). Risk-
based design of large-scale flood defence systems. Delft University of
Technology, Faculty of Civil Engineering and Geosciences.
 Tung, Yeou-Koung. "Risk/reliability-based hydraulic engineering
design." L. May (1999): 1-56.
Questions Time
Thank you

Flood risk assessment: Introduction and examples.

  • 1.
    Water Resources ResearchInstitute email: wrri@wrri.org.eg Web: www.wrri.org.eg Eng. Ahmed Adel Saleh email: norahmed1@gmail.com F.B. | https://www.facebook.com/ahmed.a.saleh.965
  • 2.
  • 3.
  • 4.
    Definitions Hazard • Events thathave the potential to cause Losses Vulnerability • The Potential for harm by disasters Risk • Product of the probability of a hazardous event and its consequence
  • 5.
  • 6.
    Causes of damfailures EarthquakeLandslideFoundation failure Equipment malfunction
  • 7.
    WHY FLOODS AREDANGEROUS ON HUMAN LIVES?
  • 8.
    WHY FLOODS AREDANGEROUS ON HUMAN LIVES, PROPERTIES, AND ENVIRONMENT?...
  • 9.
    WHY FLOODS AREDANGEROUS ON HUMAN LIVES, PROPERTIES, AND ENVIRONMENT?...
  • 10.
    WHY FLOODS AREDANGEROUS ON HUMAN LIVES, PROPERTIES, AND ENVIRONMENT?...
  • 11.
    WHY FLOODS AREDANGEROUS ON HUMAN LIVES, PROPERTIES, AND ENVIRONMENT?...
  • 12.
    Vulnerability Dimensions Social Economical Ecological Levels of coping Individual /personal CommunityRegional Administrative/ institutional Structural Losses Interruption of business Death Injuries Property damage Agricultural losses
  • 13.
    Age Dependency on thegovernment Experience Education access to transportation degree of home ownership or renters special needs Social dimension
  • 14.
    Types of buildings(residential, commercial, industrial, etc.) Infrastructures and critical sites ( schools, hospitals, emergency services, etc.) local building codes, zoning regulations, flood control programs and structures, etc.) Urbanization ongoing expansion Economic Activities (Unemployment, taxes, etc.) Structural & Economic dimension
  • 15.
    Availability of freshwater resources Climate Change impact of flood frequency Rare species, Nature reserves, etc. Environmental or Natural
  • 16.
    Definitions…(2) Hazards identification • specifyinformation on the nature and characteristics of the hazardous event and the community Hazards Analysis • knowing what could happen, the likelihood of it, and having some idea of the extent of the problems that could arise Vulnerability analysis • measuring of a community’s tendency to incur (physical, political, economic, and social) losses Risk analysis • assessment of the probability of a hazardous event and the consequences that might occur to the vulnerable items
  • 17.
    Definitions…(3)  RISK/RELIABILITY-BASED ENGINEERINGDESIGN Cost of protection Losses of damages Appropriate level of protection
  • 18.
  • 19.
    CONTENTS  Risk analysisprocess  Risk Matrix  Hazard-vulnerability function  Applications  Conclusions and recommendations
  • 20.
    Where flood riskanalysis is necessary?  Historical information (human memory, chronicles etc.)  Meteorological and hydrological data  Analysis of potential breakdowns of hydro- technological sites Watershed’s outlet
  • 21.
    Hazards analysis process Hazards identification •Identify hazards • Location • Quantity of chemical • Nature of hazards Vulnerability analysis • Vulnerability zone • Human populations • Critical facilities • Environment Risk analysis • Likelihood of incident • Severity • Consequences
  • 22.
  • 23.
  • 24.
  • 25.
    measuring of acommunity’s propensity to incur (physical, political, economic, and social) losses Exposure • Population • Economy • Natural resources • Agriculture production • Infrastrucure • Value of natural landscape • Experience • Climate change • social or cultural values Resistance • Political will • Economic incentives • Use of technology • Infrastructure hardening • Restoration of natural resource base • Social cohesion Vulnerability analysis
  • 26.
    a variable providesinformation Vulnerability analysis - Indicators Measurable Simplicity • clearly reflects • Understandable Data quality • reliable sources Sensitivity • Timely related Validity • Accurate • verifiable Achievable • Data Sources • cost effective
  • 27.
    Indicators examples Social • lowerincomes (%of <1000 L.E/month) • Age (% > 65; %<13 years) • Disabled (% of population) • Female (alone, households, single mothers) (% of population) • Homelessness, minorities, illiterates (% of population) • Few vehicles (#/1000 c) Economic • Employment loss (#) • business sales or taxes reduction ($) • Tourist Occupancy losses (#) • Damages repairing costs
  • 28.
    the determination ofthe likelihood of a disaster and possible consequences. Identifying community vulnerability indicators the probability of the hazard occurring Risk Analysis Risk Analysis
  • 29.
    Significant None Minor First aidor minor medical treatment, little or no impact to the community Moderate Minor injuries, lost workday accident, minor system damage, minor property damage, and some community disruption Major Permanent partial disability, temporary disability in excess of 3 months, major or significant property damage, Significant disruption Catastrophic Death or permanent and total disability, Major or significant property damage, failure or complete community trouble Chance of occurring in a given year Certain >99% Likely 50%–99% Possible 5%–49% Unlikely 2%–5% Rare 1%–2% Extremely rare <1% Risk Analysis
  • 30.
  • 31.
  • 32.
    Hazard-vulnerability function Damage Hazardinformation Vulnerability Building content Flood depth (and duration) Financial Building construction Flood velocity (and duration) Building resistance Human beings Flood depth and Flood velocity Human physical resistance Vehicle Flood depth and Flood velocity Vehicle resistance Human body health Contaminations Human body resistance
  • 33.
  • 34.
    Crops’ flood hazardmapping - Bangladesh Frequency analysis water level DEM Flood Depth Crops maps Flood Hazard Maps satellite images Landuse map Land cover map Vulnerability Hazard damage functions Cost Estimation
  • 35.
     Estimation ofprobable maximum flood  Development of Dam break simulation model using MIKE 11  Flood hazard assessment Assessing flooding hazards on a proposed industrial plant/site is northern India
  • 36.
    the Flood Protectionof the City of Dahab
  • 37.
    Experiments to testmathematical models results Testa, G., et all, 2007. Flash flood flow experiment in a simplified urban district. J. Hydraul. Res. 45, 37–44
  • 38.
    Bending moments Shearforces Simulating flood risk vulnerability of buildings Mazzorana, B., 2014. A physical approach on flood risk vulnerability of buildings. Hydrol. Earth Syst. Sci.
  • 39.
    Developing new criterionfor the stability of a human body in flood waters Xia, J., et all., 2014. New criterion for the stability of a human body in floodwaters. J. Hydraul. Res. 52, 93–104
  • 40.
    Better estimation ofrisk and damages Yamaguchi, Satoshi, et al. "Development of GIS-based flood-simulation software and application to flood-risk assessment." Second IMA International Conference on Flood Risk Assessment. 2007.
  • 41.
  • 42.
    Conclusions  Hazards analysisis not an isolated process but ongoing one that engages the local community.  Risk communication, citizen participation, risk management, and ongoing assessment are all parts of comprehensive emergency management.
  • 43.
    Recommendations  Data collecting(surveys, questioners,  Develop risk assessment models.  Develop Evacuation plans  Develop Community Resilience plans  Provide Risks Communicating tools
  • 44.
    References  Pine, J.,2015. Hazards analysis : reducing the impact of disasters.  Joern, Birkmann. Measuring vulnerability to natural hazards: towards disaster resilient societies. United Nations University Press, 2006.  Natale, E., 2009. Dam Break Risk Assessment in Baker Valley (Chilean Patagonia).  Voortman, H. G., Van Gelder, P. H. A. J. M., & Vrijling, J. K. (2002). Risk- based design of large-scale flood defence systems. Delft University of Technology, Faculty of Civil Engineering and Geosciences.  Tung, Yeou-Koung. "Risk/reliability-based hydraulic engineering design." L. May (1999): 1-56.
  • 45.
  • 46.