Downloaded 500 times


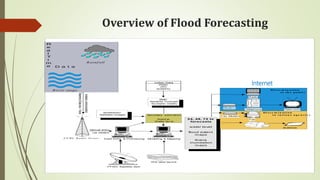


The document provides a comprehensive overview of flood forecasting, its importance in flood mitigation, and the methodologies used in Bangladesh and England & Wales. It emphasizes the need for accurate meteorological and hydrological data, as well as the significance of effective dissemination of warnings to the public. Challenges such as limited resources and data quality in Bangladesh highlight the complexities of implementing effective flood forecasting systems.