Keynote Lecture, Waheed Uddin:
Disaster Resilience Management and Flood Hazard Assessment of Infrastructure Using Computational Modeling and Geospatial Risk Mapping
Atif Kubursi - McMaster University
ERF 24th Annual Conference
The New Normal in the Global Economy: Challenges & Prospects for MENA
July 8-10, 2018
Cairo, Egypt
In 2019, WRI released an updated version of the Aqueduct Water Risk Atlas with new indicators in the Water Risk Framework as well as an updated hydrological model underpinning these indicators. While Aqueduct 2.1 relied on sub-basins as defined by the Global Drainage Basin Database, Aqueduct 3.0 uses HydroBASINS level 6 sub-basins. The updated Aqueduct Water Risk Atlas calculates water supply and demand together, while the underlying model has a higher spatial resolution and a more recent and higher temporal resolution.
Water risk assessments using the old version of the tool may need to be reassessed or reanalyzed to ensure results are current. One of the key improvements is the inclusion of groundwater resources when estimating available water supplies — critical for agricultural production, ecosystems, drinking water and industry.
Climate Tipping Points and the Insurance SectorOpen Knowledge
Climate change won’t be a smooth transition to a warmer world, warns the Tipping Points Report by Allianz and WWF. Twelve regions around the world will be most affected by abrupt changes.
Planning scheme flood provisions - avoidance v risk management and context is...Developing InSight
A recent Planning and Environment Court decision Black Ink Architecture Pty Ltd v Ipswich City Council [2020] QPEC 13 highlights that contextual consideration is key when interpreting planning scheme flood provisions.
FEMIP Report on Climate Change in the Mediterraneangueste33f29
FEMIP, the European Investment Bank’s (EIB) dedicated facility for the Mediterranean, together with the UNEP have published a study on "Climate change, energy and water in the Mediterranean".
The report, available in English and French, deals with the impact of climate change in the region. It calls for a strong investment in renewable energy and measures to modernise electricity production and improve energy efficiency.
Dr. Cynthia Rosenzweig, Senior Research Scientist, NASA Goddard Institute for Space Studies Senior Research Scientist, Earth Institute at Columbia University Co-Chair Mayor Bloomberg’s Climate Change Commission Co-Director Urban Climate Change Research Network (UCCRN); National Institute for Coastal & Harbor Infrastructure, John F. Kennedy Center, Boston, Nov. 12, 2013: "The Triple Threat of Rising Sea Levels, Extreme Storms and Aging Infrastructure: Coastal Community Responses and The Federal Role" See http://www.nichiusa.org or http://www.nichi.us
Urban Disaster Prevention Policies in KoreaByoungjaeBJLee
'Urban Disaster Prevention Policies in Korea' at 2018 UNESCAP Capacity Building Program (Spatial data and Technologies for Urban Planning and Disaster Management)
1: Strong Public Private Partnerships
2: Resilience in the Built Environment
3: Risk‐sensitive Investments and Accounting
4: Positive Cycle of Reinforcement for a Resilient Society
5: Private Sector Risk Disclosure
1: Strong Public Private Partnerships
2: Resilience in the Built Environment
3: Risk‐sensitive Investments and Accounting
4: Positive Cycle of Reinforcement for a Resilient Society
5: Private Sector Risk Disclosure
Economic Evaluation for Flood Control Investment in JapanOECD Governance
Investing in infrastructure: Costs, benefits and effectiveness of disaster risk reduction measures.
Presentation made by:
Kazushi FURUMOTO
Director for International Coordination of River Engineering
River Planning Division, Water and Disaster Management Bureau
Ministry of Land, Infrastructure, Transport and Tourism (MLIT), Japan
NEUSSNER-Risk maps for the support of reconstruction after Typhoon Haiyan-ID1...Global Risk Forum GRFDavos
5th International Disaster and Risk Conference IDRC 2014 Integrative Risk Management - The role of science, technology & practice 24-28 August 2014 in Davos, Switzerland
Similar to 2017 MAIREINFRA Conference, Seoul, South Korea, July 19-21. (20)
GDG Cloud Southlake #33: Boule & Rebala: Effective AppSec in SDLC using Deplo...James Anderson
Effective Application Security in Software Delivery lifecycle using Deployment Firewall and DBOM
The modern software delivery process (or the CI/CD process) includes many tools, distributed teams, open-source code, and cloud platforms. Constant focus on speed to release software to market, along with the traditional slow and manual security checks has caused gaps in continuous security as an important piece in the software supply chain. Today organizations feel more susceptible to external and internal cyber threats due to the vast attack surface in their applications supply chain and the lack of end-to-end governance and risk management.
The software team must secure its software delivery process to avoid vulnerability and security breaches. This needs to be achieved with existing tool chains and without extensive rework of the delivery processes. This talk will present strategies and techniques for providing visibility into the true risk of the existing vulnerabilities, preventing the introduction of security issues in the software, resolving vulnerabilities in production environments quickly, and capturing the deployment bill of materials (DBOM).
Speakers:
Bob Boule
Robert Boule is a technology enthusiast with PASSION for technology and making things work along with a knack for helping others understand how things work. He comes with around 20 years of solution engineering experience in application security, software continuous delivery, and SaaS platforms. He is known for his dynamic presentations in CI/CD and application security integrated in software delivery lifecycle.
Gopinath Rebala
Gopinath Rebala is the CTO of OpsMx, where he has overall responsibility for the machine learning and data processing architectures for Secure Software Delivery. Gopi also has a strong connection with our customers, leading design and architecture for strategic implementations. Gopi is a frequent speaker and well-known leader in continuous delivery and integrating security into software delivery.
GraphSummit Singapore | The Future of Agility: Supercharging Digital Transfor...Neo4j
Leonard Jayamohan, Partner & Generative AI Lead, Deloitte
This keynote will reveal how Deloitte leverages Neo4j’s graph power for groundbreaking digital twin solutions, achieving a staggering 100x performance boost. Discover the essential role knowledge graphs play in successful generative AI implementations. Plus, get an exclusive look at an innovative Neo4j + Generative AI solution Deloitte is developing in-house.
GridMate - End to end testing is a critical piece to ensure quality and avoid...ThomasParaiso2
End to end testing is a critical piece to ensure quality and avoid regressions. In this session, we share our journey building an E2E testing pipeline for GridMate components (LWC and Aura) using Cypress, JSForce, FakerJS…
UiPath Test Automation using UiPath Test Suite series, part 5DianaGray10
Welcome to UiPath Test Automation using UiPath Test Suite series part 5. In this session, we will cover CI/CD with devops.
Topics covered:
CI/CD with in UiPath
End-to-end overview of CI/CD pipeline with Azure devops
Speaker:
Lyndsey Byblow, Test Suite Sales Engineer @ UiPath, Inc.
Removing Uninteresting Bytes in Software FuzzingAftab Hussain
Imagine a world where software fuzzing, the process of mutating bytes in test seeds to uncover hidden and erroneous program behaviors, becomes faster and more effective. A lot depends on the initial seeds, which can significantly dictate the trajectory of a fuzzing campaign, particularly in terms of how long it takes to uncover interesting behaviour in your code. We introduce DIAR, a technique designed to speedup fuzzing campaigns by pinpointing and eliminating those uninteresting bytes in the seeds. Picture this: instead of wasting valuable resources on meaningless mutations in large, bloated seeds, DIAR removes the unnecessary bytes, streamlining the entire process.
In this work, we equipped AFL, a popular fuzzer, with DIAR and examined two critical Linux libraries -- Libxml's xmllint, a tool for parsing xml documents, and Binutil's readelf, an essential debugging and security analysis command-line tool used to display detailed information about ELF (Executable and Linkable Format). Our preliminary results show that AFL+DIAR does not only discover new paths more quickly but also achieves higher coverage overall. This work thus showcases how starting with lean and optimized seeds can lead to faster, more comprehensive fuzzing campaigns -- and DIAR helps you find such seeds.
- These are slides of the talk given at IEEE International Conference on Software Testing Verification and Validation Workshop, ICSTW 2022.
State of ICS and IoT Cyber Threat Landscape Report 2024 previewPrayukth K V
The IoT and OT threat landscape report has been prepared by the Threat Research Team at Sectrio using data from Sectrio, cyber threat intelligence farming facilities spread across over 85 cities around the world. In addition, Sectrio also runs AI-based advanced threat and payload engagement facilities that serve as sinks to attract and engage sophisticated threat actors, and newer malware including new variants and latent threats that are at an earlier stage of development.
The latest edition of the OT/ICS and IoT security Threat Landscape Report 2024 also covers:
State of global ICS asset and network exposure
Sectoral targets and attacks as well as the cost of ransom
Global APT activity, AI usage, actor and tactic profiles, and implications
Rise in volumes of AI-powered cyberattacks
Major cyber events in 2024
Malware and malicious payload trends
Cyberattack types and targets
Vulnerability exploit attempts on CVEs
Attacks on counties – USA
Expansion of bot farms – how, where, and why
In-depth analysis of the cyber threat landscape across North America, South America, Europe, APAC, and the Middle East
Why are attacks on smart factories rising?
Cyber risk predictions
Axis of attacks – Europe
Systemic attacks in the Middle East
Download the full report from here:
https://sectrio.com/resources/ot-threat-landscape-reports/sectrio-releases-ot-ics-and-iot-security-threat-landscape-report-2024/
Communications Mining Series - Zero to Hero - Session 1DianaGray10
This session provides introduction to UiPath Communication Mining, importance and platform overview. You will acquire a good understand of the phases in Communication Mining as we go over the platform with you. Topics covered:
• Communication Mining Overview
• Why is it important?
• How can it help today’s business and the benefits
• Phases in Communication Mining
• Demo on Platform overview
• Q/A
Epistemic Interaction - tuning interfaces to provide information for AI supportAlan Dix
Paper presented at SYNERGY workshop at AVI 2024, Genoa, Italy. 3rd June 2024
https://alandix.com/academic/papers/synergy2024-epistemic/
As machine learning integrates deeper into human-computer interactions, the concept of epistemic interaction emerges, aiming to refine these interactions to enhance system adaptability. This approach encourages minor, intentional adjustments in user behaviour to enrich the data available for system learning. This paper introduces epistemic interaction within the context of human-system communication, illustrating how deliberate interaction design can improve system understanding and adaptation. Through concrete examples, we demonstrate the potential of epistemic interaction to significantly advance human-computer interaction by leveraging intuitive human communication strategies to inform system design and functionality, offering a novel pathway for enriching user-system engagements.
Sudheer Mechineni, Head of Application Frameworks, Standard Chartered Bank
Discover how Standard Chartered Bank harnessed the power of Neo4j to transform complex data access challenges into a dynamic, scalable graph database solution. This keynote will cover their journey from initial adoption to deploying a fully automated, enterprise-grade causal cluster, highlighting key strategies for modelling organisational changes and ensuring robust disaster recovery. Learn how these innovations have not only enhanced Standard Chartered Bank’s data infrastructure but also positioned them as pioneers in the banking sector’s adoption of graph technology.
Threats to mobile devices are more prevalent and increasing in scope and complexity. Users of mobile devices desire to take full advantage of the features
available on those devices, but many of the features provide convenience and capability but sacrifice security. This best practices guide outlines steps the users can take to better protect personal devices and information.
PHP Frameworks: I want to break free (IPC Berlin 2024)Ralf Eggert
In this presentation, we examine the challenges and limitations of relying too heavily on PHP frameworks in web development. We discuss the history of PHP and its frameworks to understand how this dependence has evolved. The focus will be on providing concrete tips and strategies to reduce reliance on these frameworks, based on real-world examples and practical considerations. The goal is to equip developers with the skills and knowledge to create more flexible and future-proof web applications. We'll explore the importance of maintaining autonomy in a rapidly changing tech landscape and how to make informed decisions in PHP development.
This talk is aimed at encouraging a more independent approach to using PHP frameworks, moving towards a more flexible and future-proof approach to PHP development.
Elevating Tactical DDD Patterns Through Object CalisthenicsDorra BARTAGUIZ
After immersing yourself in the blue book and its red counterpart, attending DDD-focused conferences, and applying tactical patterns, you're left with a crucial question: How do I ensure my design is effective? Tactical patterns within Domain-Driven Design (DDD) serve as guiding principles for creating clear and manageable domain models. However, achieving success with these patterns requires additional guidance. Interestingly, we've observed that a set of constraints initially designed for training purposes remarkably aligns with effective pattern implementation, offering a more ‘mechanical’ approach. Let's explore together how Object Calisthenics can elevate the design of your tactical DDD patterns, offering concrete help for those venturing into DDD for the first time!
GraphRAG is All You need? LLM & Knowledge GraphGuy Korland
Guy Korland, CEO and Co-founder of FalkorDB, will review two articles on the integration of language models with knowledge graphs.
1. Unifying Large Language Models and Knowledge Graphs: A Roadmap.
https://arxiv.org/abs/2306.08302
2. Microsoft Research's GraphRAG paper and a review paper on various uses of knowledge graphs:
https://www.microsoft.com/en-us/research/blog/graphrag-unlocking-llm-discovery-on-narrative-private-data/
GraphSummit Singapore | The Art of the Possible with Graph - Q2 2024Neo4j
Neha Bajwa, Vice President of Product Marketing, Neo4j
Join us as we explore breakthrough innovations enabled by interconnected data and AI. Discover firsthand how organizations use relationships in data to uncover contextual insights and solve our most pressing challenges – from optimizing supply chains, detecting fraud, and improving customer experiences to accelerating drug discoveries.
Essentials of Automations: The Art of Triggers and Actions in FMESafe Software
In this second installment of our Essentials of Automations webinar series, we’ll explore the landscape of triggers and actions, guiding you through the nuances of authoring and adapting workspaces for seamless automations. Gain an understanding of the full spectrum of triggers and actions available in FME, empowering you to enhance your workspaces for efficient automation.
We’ll kick things off by showcasing the most commonly used event-based triggers, introducing you to various automation workflows like manual triggers, schedules, directory watchers, and more. Plus, see how these elements play out in real scenarios.
Whether you’re tweaking your current setup or building from the ground up, this session will arm you with the tools and insights needed to transform your FME usage into a powerhouse of productivity. Join us to discover effective strategies that simplify complex processes, enhancing your productivity and transforming your data management practices with FME. Let’s turn complexity into clarity and make your workspaces work wonders!
A tale of scale & speed: How the US Navy is enabling software delivery from l...sonjaschweigert1
Rapid and secure feature delivery is a goal across every application team and every branch of the DoD. The Navy’s DevSecOps platform, Party Barge, has achieved:
- Reduction in onboarding time from 5 weeks to 1 day
- Improved developer experience and productivity through actionable findings and reduction of false positives
- Maintenance of superior security standards and inherent policy enforcement with Authorization to Operate (ATO)
Development teams can ship efficiently and ensure applications are cyber ready for Navy Authorizing Officials (AOs). In this webinar, Sigma Defense and Anchore will give attendees a look behind the scenes and demo secure pipeline automation and security artifacts that speed up application ATO and time to production.
We will cover:
- How to remove silos in DevSecOps
- How to build efficient development pipeline roles and component templates
- How to deliver security artifacts that matter for ATO’s (SBOMs, vulnerability reports, and policy evidence)
- How to streamline operations with automated policy checks on container images
A tale of scale & speed: How the US Navy is enabling software delivery from l...
2017 MAIREINFRA Conference, Seoul, South Korea, July 19-21.
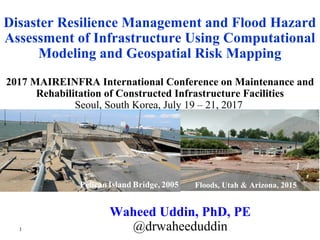
1. Floods, Utah & Arizona, 2015
Waheed Uddin, PhD, PE
@drwaheeduddin
2017 MAIREINFRA International Conference on Maintenance and
Rehabilitation of Constructed Infrastructure Facilities
Seoul, South Korea, July 19 – 21, 2017
Disaster Resilience Management and Flood Hazard
Assessment of Infrastructure Using Computational
Modeling and Geospatial Risk Mapping
1
2. 2
• About 60% of all disasters costing one billion dollars or more in the
United States were related to weather. Worldwide floods and
storms accounted for 65% of total 13,757 natural disasters during
1900 to 2015.
• Extreme weather events are occurring as devastating floods in
recent years worldwide due to heavy rainfall, hurricanes/cyclones,
and hydrological events of dam & levee breaks.
• Extreme weather events caused $208 billion of economic cost in the
United States with more than 1,200 casualties between 2011 & 2013.
• 2005 Hurricane Katrina disaster on Louisiana and Mississippi
Gulf Coast resulted in more than $100 billion in infrastructure and
economic costs.
• Critical transportation infrastructure assets are under a continuous
risk of flood hazards and subject to significant damage, such as
washing away of pavements and bridges.
Background and Motıvatıon
2
4. 4
Flood Destruction: Roadways and Bridges
2005
Mississippi Gulf Coast
Hurricane Irene, 2011
4 I-10 Bridge, Arizona, Aug 2015
Scour failure
2005 Hurricane Katrina
New Orleans
5. 5
Review natural disaster occurrences and their
impacts on the built environment and communities
Implement computational modeling and geospatial
visualization technologies for extreme flood
simulations and coastal disaster risk mapping.
Discuss case studies of disaster vulnerability risk
mapping and damage assessment for selected port
cities.
Results used to enhance decision support systems for
safeguard of bridge and highway infrastructure
from extreme weather related natural disasters such
as floods.
Objectives
5
6. 6
Natural Hazards and Declared Natural
Disasters
6
• Geological disasters: volcanoes, earthquakes, tsunamis,
landslides, land subsidence, cavities.
• Meteorological disasters (including extreme weather and
climate impacts): rainfall floods, storms, hail, coastal hurricanes
and cyclones, snow, drought, famine.
• Hydrological disasters: rainfall floods, flash floods, dam and
levee breaks, river overflow, mudslide.
• Environmental disasters: toxic spills, river and groundwater
contamination, wetland pollution, air pollution, air quality
degradation, nuclear radiation leaks, deforestation
• Fire disasters: wildfire, forest fire, accidental
industrial/chemical fire, terrorism
• Epidemic disasters: epidemics and fatal diseases
• Disaster incidents and/or accidental disasters:
water pipeline breaks, gas pipeline explosions, oil spills
8. 8
Time Series of Global Disaster Occurrences
8
A rate of decrease in disasters of 2.2% per year was
calculated in annual number of disasters from the peak
in year 2000 to 2015 period
9. 9
ARIMA Model vs. the Observed Time Series
9
Worldwide floods and storms accounted for 65% of
total 13,757 natural disasters during 1900 to 2015.
10. 10
10
This evidence contradicts the UN IPCC’s Carbon Dioxide (CO2)-Anthropogenic
Global Warming (AGW) hypothesis of increasing number of weather and
climate change related natural disaster predicted in 2015.
11. 11
11
Physical evidence:
Global Warming is not caused by Anthropogenic
Carbon Dioxide (CO2) as hypothesized by UN IPCC
for 2015 Paris Climate deal, which was based on
fabricated global temperature anomaly.
Global Warming and Climate Change Hypothesis?
12. 12
12
Global Warming is not caused by Anthropogenic CO2 as hypothesized by
IPCC for 2015 Paris Climate deal using fabricated global temperature anomaly.
13. 13
Spatial Map of Worldwide Natural Disasters, 2011
13
2011 Costliest Year: Recovery Effort over US$380 billion
242 Federally declared disasters in the United States
including the Hurricane Irene disaster on the East coast
15. 15
15
An Enhanced BMS Framework (after Uddin et al. 2013)
15
• Vertical Underclearance
• Flood Probability
Flood Vulnerability Rating (FVR)
Flood Disaster Resilience Analysis
16. 16
Infrastructure Disaster Resilience Improvement
How to prioritize infrastructure
asset groups for disaster resilience
improvement?
Goal –
Measure
Quantifiable
Reduction
Identify
Risk
Assess
Risk
Communicate
Risk
Mitigate
Risk
Continuous
Renewal &
Improvement
Map Risk
Data
Assess Present
& Future Risks
Plan for
Risk
Reduce
Risk
Enhance
Resilience:
Hardening
Infrastructure
Disaster Resilience Rating
17. 17
Visualization of First Flood Inundation Simulation, and Calculated Flood Depth
at Selected Feature Locations along River CL (10m Cell), Sardis, Mississippi
Maximum Flood Depth
Feature Number
Hwy 315
Hwy 35
Infrastructure Feature
CAIT / NCCHE
Sardis Site
17
18. 18
Objective of 3D-FE Modeling of Bridge Structure
Structural integrity analysis of US-51 Highway Bridge
(Sardis, Mississippi) subjected to lateral floodwater force
using 3D-FE modeling and simulation
• Deck
• Deck and Girders
• Individual Girder
• Bearings
• Pile Caps
• Piles
• Foundation Soil
18
19. 19
3D-FE Modeling & Simulation: US-51 Bridge
View of US-51 Bridge (Credit: MDOT)
Lateral Hydrodynamic Force Acting on the Bridge
19
20. Highway US-51 Bridge: 3D-FE
Simulation Results
Subjected to Lateral
Floodwater Force
Maximum Lateral Displacement in Floodwater direction: 2.4 m
20
23. 23
23
Data Used in Budget Optimization Problem and Value
Engineering Analysis for Reconstruction or Hardening
Case Study of Concrete Girder Bridge
FVR Group
Unit Cost of
Reconstruction ($)
Unit Cost of
Hardening ($)
Unit Cost
Avoidance ($)
Unit Net
Benefit ($)
Net Benefit
($)
1. Catastrophic Risk 10,000,000 - 15,000,000 5,000,000 5,400,000
2. Very High Risk 5,000,000 - 15,000,000 10,000,000 27,000,000
3. High Risk - 5,000,000 15,000,000 10,000,000 16,200,000
4. Moderate Risk - 1,000,000 4,000,000 3,000,000 1,620,000
5. Low Risk - 1,000,000 4,000,000 3,000,000 162,000
6. Very Low Risk - 1,000,000 4,000,000 3,000,000 81,000
n = Analysis period= 100 years, i = Annual Discount Rate= 5%
( )
( ) ( )
+
−
+
−+
+= nn
n
i1
1
S
i1i
1i1
MCP
The present worth (P) of a flood resilience project for (n) years, with an initial
cost C, a yearly maintenance cost M, and a salvage value S.
23
FVR = Flood
Vulnerability Rating
24. 24
Extreme Flood Modeling and Simulation for Los Angeles
24
In recent years, 130 ports were struck by tropical cyclones each year.
25. 25
25
Extreme Flood Modeling and Simulation for Los Angeles
37% Area Inundated by extreme rainfall flood (using HEC-RAS Software)
26. 26
2m Seal Level Rise (SLR) Simulation and Visualization of
Land Submerge, Projected by NOAA for Year 2100
26
1.68% Land Area Submerges
(using CAIT Methodology)
27. 27
27
2m Seal Level Rise (SLR) Simulation and Visualization of
Land Submerge
2m Peak Wave Height Tsunami simulation shows just 0.4 % less submerged
land area than that by 2 m SLR. However, a tsunami can occur any time if
there is a strong earthquake in Pacific ocean along the west coast.
29. 29
29
Better communications,
emergency response
management and natural
disaster preparedness
contributed to a lower
number of annual
disaster deaths
worldwide.
Thanks to Former Graduate
Students: Dr. Alper Durmus
Dr. Quang Nguyen
W. Tucker Stafford, MS
2017 Book
Editor's Notes
Traditional asset management systems do not consider failure and disruptions of service arising from catastrophic disasters.
Goals and Policies (Reflect Customer Input)
Short- and Long-Range Plans (Project Selection)
Performance Monitoring (Feedback)
All bridge parts modeled using “Elastic” material model.
8 states have more than 90% of their bridges on rivers/channels.
Displays the number of bridges in Mississippi which are in 80-1,600 ft (approximately 25-500 m) proximity to major rivers.
It is assumed that total 270 bridges identified in 160 ft (approximately 50 m) proximity to a river/channel are already prioritized in FVR groups. Total net benefit in the table (for all identified number of bridges in each FVR group) is based on the assumption that budget is not constrained. If a budget constraint of $15 million is considered, linear programming (LP) optimization Solver selects 15 bridges from FVR category 1 for reconstruction/hardening.