

Recommended
More Related Content
Similar to risk assessment
Similar to risk assessment (20)
Recently uploaded
Recently uploaded (20)
risk assessment
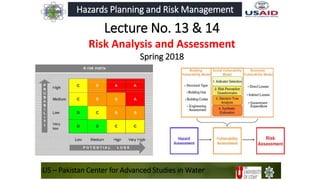
- 1. US – Pakistan Center for Advanced Studies in Water Hazards Planning and Risk Management Lecture No. 13 & 14 Risk Analysis and Assessment Spring 2018
- 2. Learning Outcome Students will Learn how to analyze and assess disaster related risks
- 3. Reading Material • Dr. Cees Westen (ITC) Guide Book 01 (pdf provided at wordpress)
- 4. Recap - Risk? • Probability that loss will occur as the result of an adverse event, given the hazard and the vulnerability • What is at Risk? – consequence of Hazards • Personal Injury • Destruction of property • Poor building material and maintenance • Damage local economy • Opportunity Loss: diversion of economic resources to recovery efforts
- 5. Risks can also be prioritized according to the acceptability of the population at risk. How?
- 6. Risk and Risk Assessment Dr. Cees Westen (ITC) slides
- 8. Purpose of Risk Analysis? • To plan for public safety by developing • Hazard Reduction Plans • Vulnerability reduction Plans • Emergency Preparedness Plans
- 9. Risk = Probability of Losses Risk = Hazard * Vulnerability * Amount of elements-at-risk Or Risk = Hazard * Vulnerability / Capacity • Capacity = Expresses the positive managerial and operational resources and procedures for reducing risk factors Examples: • awareness raising • early warning • preparedness planning
- 10. RISK = HAZARD * VULNERABILITY * AMOUNT • Hazard = Probability of event with a certain magnitude • Triggering mechanism • Type of event • Magnitude: Volume, distance, duration, speed etc • Vulnerability = Degree of damage. Function of: • Magnitude of event, and • Type of elements at risk • Amount = Quantification of the elements at risk e.g. • Replacement costs of buildings, infrastructure etc. • Loss of function or economic activities • Number of people
- 11. Vulnerability of five (05) elements of a community 1. People 2. Property 3. Services 4. Livelihood 5. Environment • Each of the above has specific vulnerability to specific hazard
- 12. Risk Analysis Steps 1. Identify a Hazard 2. Identify the communities exposed to that hazard 3. Determine the vulnerabilities of the 05 elements of these communities 4. Identify the capacities of the communities to respond to that hazard 5. Predict the consequences or impact of the hazard on communities exposed 6. Assess the risks for each hazard identified 7. Analyze the hazard risks in relation to one another 8. Treat the hazards risk according to prioritization
- 13. Generic Risk Assessment Model 1. Description of intention 1. Screening: whether assessment is required or not? 2. Scoping: spatial and temporal limits depending on budgetary and time constrains and availability of data and human resources 2. Hazard identification (hazard auditing) 3. Estimation of magnitude and frequency/probability of hazards 4. Identification of consequences 5. Estimation of magnitude of consequences 6. Estimation of frequency/probability of consequences 7. Risk estimation (combining 5 & 6) 8. Risk evaluation (so what? – determining the significance of estimated risks for those affected)
- 15. Vulnerability Assessment • The process of estimating the vulnerability to potential disaster hazards of specified elements at risk • A process to determine the nature and extent of vulnerability by analyzing existing conditions and characteristics of an element or system exposed to a particular type of natural hazard event.
- 16. Vulnerability Assessment • Vulnerability assessment identify the relationship between the hazard and the element at risk • Vulnerability is evaluated as the interaction between the intensity of the hazard and the type of element at-risk, making use of so-called vulnerability curves
- 17. How to do Vulnerability Assessment? • Which are the most important elements at risk? • Which methods for vulnerability assessment could be used? • What are the data requirements? • Aggravating factors of vulnerability? Examples?
- 18. Hazard Risk Assessment • Process by which threat posed by each identified hazard is investigated • Risk depends on Hazard likelihood and hazard consequences • The above two (02) factors are constantly changing as a result of changing environment • High-likelihood/high-consequence hazards are of special consideration • A comprehensive Risk Management Program can greatly reduce life and property losses
- 19. Risk Assessment • For different hazards there are different • Methods for loss estimation • Data requirements Risk Assessment = Risk Estimation + Risk Evaluation
- 20. Risk Analysis Methodology • Both Qualitative and Quantitative • Various computer based models • Risk assessment outcomes depend on quality and availability of data
- 21. Qualitative Risk Analysis • An analysis which uses word form, descriptive or numeric rating scales to describe the magnitude of potential consequences and the likelihood that those consequences will occur • Resulting in a qualitative value of the risk. e.g. High Risk, Moderate Risk, Low Risk etc.
- 22. Quantitative Risk Analysis • An analysis which is based on numerical values of the probability, vulnerability, and consequences • Resulting in a numerical value of the risk. e.g. Risk = $ 5,000, etc.
- 29. Risk Curve
- 36. Elements at Risk • All objects, persons, animals, activities and processes that may be adversely affected by hazardous phenomena, in a particular area, either directly or indirectly. • This includes: buildings, facilities, population, livestock, economic activities, public services, environment.
- 38. Elements of Risk Matrix Hazard Type Element at Risk Sources (bold = primary source) Register Map Field Image Earth Quake Buildings Building type √ √ √ √ Structure type Material Height Use Shape age Lifelines Population Essential facilities Flood
- 40. Source: Cees Van Westen, ITC
- 41. Summary • Therefore 3 major components to be considered in disaster management • Hazard • Vulnerability • Capacity/amount of losses • Therefore disaster risk can be reduced through systematic efforts of • reducing hazard exposure, • lessening vulnerability and • developing greater capacity to face these disasters may reduce the impact of a hazard
Editor's Notes
- Picture from Internet.
- Definition Source: Disaster Management Version 1. Probability or likelihood of a hazard event of a certain magnitude occurring. “measure of the expected losses due to a hazard event occurring in a given area over a specific time period.” Risk (R) can be determined as a product of hazard (H) and vulnerability (V). i.e. R = H x V
- For instance, despite the fact that more people are exposed to a particular risk or that it causes more fatalities or damages each year, it might still be more palatable to the exposed population than another much less dangerous or damaging risk due to the benefits that would be lost if the risk was partially or fully mitigated. For example, transportation accidents have caused more fatalities in the United States and worldwide than nuclear power accidents. Yet, most people are much more willing to accept the risk of transportation accidents than nuclear accidents because the loss of automobiles would have a much more personal and profound impact. (Coppola Emergency-Management)
- Source: Westen Guidebook 01 Essentially, a natural hazard risk assessment is a study undertaken to determine the range of possible consequences from a natural hazard and is shown in Figure UN-ISDR: United Nations International Strategy for Disaster Reduction
- Source: Westen Guidebook 01
- Pic source: Dr. Pual Hofstee ITC
- Equation 2 is said to be a conceptual equation. Equation [1], given above, is not only a conceptual one, but can also be actually calculated with spatial data in a GIS to quantify risk, with a focus on (direct) physical, population and economic losses. Source: ITC Summation for all possible risks.
- Source: Cees van Westen
- Source: http://ebookbrowse.com/day1-concepts-in-emergency-management-pdf-d116896500 vulnerability to natural hazards generally refer to the characteristics of an element exposed to a hazard. Extent to which a community’s structure, services or environment is likely to be damaged or disrupted by the impact of a hazard Definition Source: Disaster Management Version 1. Risk vulnerability looks at four factors, including social vulnerability, environmental vulnerability, physical vulnerability, and economic vulnerability. The expected degree of loss of the element at risk
- Identify the characteristics of a particular type of a hazard Magnitude /Intensity/destructive power Frequency Duration Time of onset Warning time Make a list of all possible effects/impacts Identify the nature of effects/impacts
- http://booklens.com/e-mark-lee/landslide-risk-assessment 8: last stage requires gathering information regarding how affected people feel about and value objects, actions, processes, amenities, etc. --- risk perception
- Source: Disaster Management Version 1.
- Source: Dr. Cees Westen ITC
- Source: Dr. Cees Westen ITC
- Source: ITC Aggravating factors: Degraded Environment, urbanization, population explosion, etc.
- low-likelihood/low-consequence hazards are of least concern. And all fall in between. The above 2 factors are constantly changing as a result of increased development, access to new information, changes in climate and community characteristics, etc. Extrapolation of these values is also impossible.
- Cees Van Westen Data: (base data from which information related to risk can be derived e.g. soil data, DEM, landuse/land cover, social/economical, hydrological conditions, building footprints, building heights, road networks, etc.) Lack of base data may impose problem in modeling risk.
- ITC
- ITC
- ITC
- ITC A = Very High Risk B= High C = Medium D = Low Risk
- Source: Westen Guidebook 01 See more on the above source
- RP = Return Period
- Expected degree of loss = risk 2 years RP – prob or hazard = ½ = 0.5 10 years RP – prob = 1/10 = 0.1 50 years RP – prob = 1/50 = 0.02
- Multi-Hazard Risk Assessment is very complicated
- See more on Westen Guidebook 01
- Capacity of people/community and environment Example of Vulnerability: poor people can not construct strong houses and there more susceptible to hazard of a hazard. Capacity: Rich people have more resources and hence have capacity to recover from a disaster's impact. (resources, means, and strength to recover from a disaster)